
DAVID VON HIPPEL AND PETER HAYES
SEPTEMBER 2, 2020
I. INTRODUCTION
In this Special Report, David von Hippel and Peter Hayes provide an update to their estimates, originally published in June 2019, of DPRK supply of and demand for petroleum products in recent years. Demand (and thus balancing supply) for key oil products in 2018 and 2019 are estimated to have been considerably higher than official trade statistics and reports of member countries to the United Nations Security Council Panel of Experts would indicate, meaning that oil products are making their way into the DPRK economy in other ways. This update factors in a key finding—that the DPRK’s main active refinery in 2016 added a piece of equipment, called a catalytic cracking unit, that has changed the mix of products that the DPRK can produce from the crude oil it imports from China. The result of this addition was that the DPRK was able to produce more motor fuels and other light products—especially gasoline—from each ton of crude oil it imported from China, partially offsetting supply restrictions imposed by UN Security Council sanctions on the DPRK’s oil imports. We estimate that as a result of installing the cracking unit the DPRK produced on the order of 95,000 more tonnes of light products (gasoline, kerosene, diesel and LPG) in 2017 than it did in 2016, with reduction in production of heavy fuel oil (which can be substituted for by coal in the DPRK for most end uses) of over 100,000 tonnes. In addition, this update includes our estimates and projections of oil supply and demand in the DPRK during 2020, factoring in the impacts of the COVID-19 pandemic and the DPRK’s response to same.
David von Hippel is Nautilus Institute Senior Associate. Peter Hayes is Director of the Nautilus Institute and Honorary Professor at the Centre for International Security Studies at the University of Sydney.
This report may be downloaded as a PDF file here.
This report was produced for the Regional Energy Security Project funded by the John D. and Catherine T. MacArthur Foundation.
The views expressed in this report do not necessarily reflect the official policy or position of the Nautilus Institute. Readers should note that Nautilus seeks a diversity of views and opinions on significant topics in order to identify common ground.
This report is published under a 4.0 International Creative Commons License the terms of which are found here.
Banner image: Estimated DPRK Petroleum Products Supplies, both Refined Domestically and Imported, 1990 through 2020, based on Nautilus Institute data and projections.
II. NAPSNET SPECIAL REPORT BY DAVID VON HIPPEL AND PETER HAYES
UPDATED ESTIMATES OF REFINED PRODUCT SUPPLY AND DEMAND IN THE DPRK, 2010 – 2020
SEPTEMBER 2, 2020
The supply of refined oil products in the Democratic People’s Republic of Korea (DPRK) has been constrained to varying degrees since the breakup of the Soviet Union after 1990. The economic dislocation in the DPRK—due to severed access to concessional oil supplies, to markets for goods formerly made in the DPRK for use in Soviet republics and satellite nations, and to spare parts for factories largely provisioned by the USSR, among other factors—meant that crude oil and oil products imports in the quantities consumed in 1990 and earlier became unaffordable for the DPRK. What imports were available after the early 1990s were at levels that constrained demand, meaning, for example, that vehicles were used less (and human and animal labor more) in transport and in farming, and that substitute fuels for various end uses became more important. In more recent years, the availability of oil products in the DPRK, at least judging from anecdotal evidence and based on statistics on imports of oil-consuming vehicles and equipment, appears to have been improved.[1] This trend has been interrupted to some extent starting in 2017 by United Nations Security Council (UNSC) sanctions targeting DPRK oil imports in response to the DPRK’s nuclear weapons and missile programs, but sanctions do not have appeared to have had the dramatic impact on the DPRK economy that the United States and others had hoped for, likely meaning that oil products are finding their way into the country by routes not reported in, for example, customs statistics.
This Updated Special Report presents Nautilus’ estimates of refined oil product supply and demand in the DPRK for the years 2010 and 2014 through 2020, along with the methods and assumptions used to prepare these estimates, key conclusions, and a related comparison of a potential DPRK engagement strategy for humanitarian relief of some impacts of UN Security Council sanctions versus the volume of petroleum products use in the DPRK. Although as of this writing the year 2020 is not yet complete, we include estimates and projections for oil and oil product supply and demand for 2020 here in part to illustrate the likely effects of the coronavirus SARS-CoV2 (COVID-19) pandemic, and national measures put in place to control it, on the DPRK. An additional factor that has led us to update the report at this time has been the finding that the DPRK’s main active refinery added a piece of equipment, called a catalytic cracking unit, in approximately 2016, and that the use of that unit has likely changed the mix of products that the DPRK can produce from the crude oil it imports from China. This finding caused us to reexamine our refined product balance for the year 2017, as well as changing our assumptions for subsequent years, and suggests that supplies of (and demand for) diesel fuel and (especially) gasoline were in fact higher in that year than we originally estimated.
Key elements of these results presented in the sections that follow include:
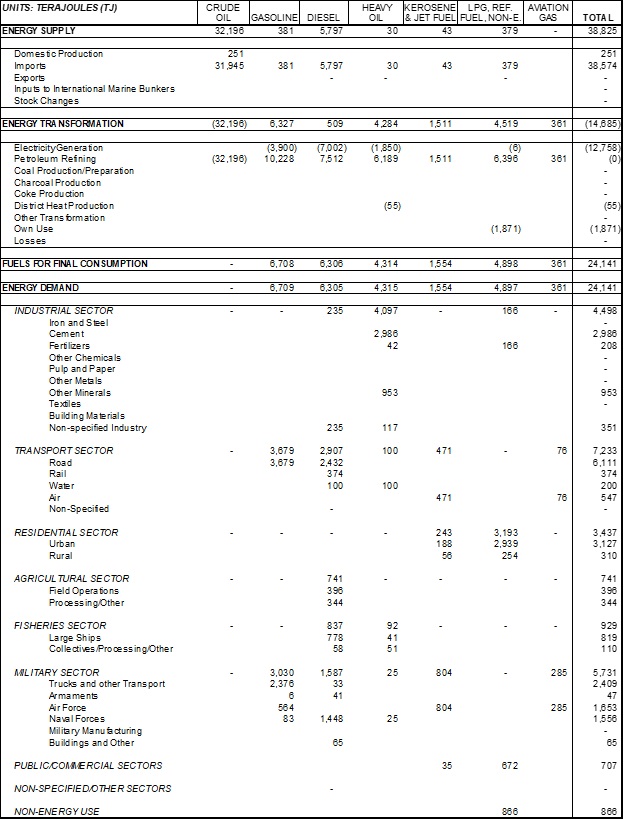
- Estimated refined product balances, showing the origin of refined product supplies (that is, imported or produced in domestic refineries), the use of refined product in energy transformation (such as electricity generation), and estimated demand for refined products by fuel and by sector through 2020.
- Figures showing the estimated volumes of oil product imports and oil products refined in-country by type of refined product for selected years between 2000 and 2020.
- Tables and graphs showing fuel demand by end-use sector (and for electricity generation) for diesel oil, gasoline (petrol) and kerosene/jet fuel.
- A brief description of the potential impacts of a program of rapid-deployment building energy efficiency and solar photovoltaic power measures, were it to be offered by the international community, that would address some of the humanitarian issues associated with UNSC sanctions on the DPRK related to coal exports and oil product imports without removing those sanctions.
Our analysis of DPRK oil products supply and demand shows fairly robust growth in the use of petroleum products in most sectors from 2010 through 2016. This growth included very rapid growth in the use of diesel fuel and gasoline to fuel imported internal combustion electricity generators that were imported in large quantities, particularly in 2014 through 2016, and mostly from China. As UNSC sanctions came into full force, our analysis shows declines in oil products use in most sectors, as well as in electricity generation by households and organizations, between 2016 and 2019, due to the oil supply restrictions brought on by sanctions. Even with reduced demand, we found that a balancing was required between assumptions as to reductions in domestic demand for oil products from 2016 to 2019—given reports of only modest fuel shortages and limited evident reduction in economic activity in the DPRK as reported by visitors—together with what we assume, based in part on reports by others, must be the availability of additional “off-books” oil supplies procured by various means. The combination of the impacts of quarantines to protect the DPRK population from COVID-19, together with the impacts of those quarantines on fuel supplies (both “on-books” and “off-books”), has meant that our projections for fuel demand and supply in 2020 will ultimately be significantly lower than in 2019, although these demand reductions vary significantly by sector.
Although energy supply and, particularly, demand statistics are less complete than analysts might prefer in many countries, the DPRK is an outliner in terms of information provision, as it publishes essentially no direct information on its energy supply and demand. At the same time, its “energy insecurity”—that is, its lack of access to fuels, particularly petroleum fuels, and the energy services that those fuels provide, has been (and continues to be), in our view, a key driver of its decision to pursue nuclear weapons and related missile technology development over the past three decades. As such, understanding the DPRK’s fuels supply and demand situation is critical to understanding potential solutions to the current political stalemate that international community actors might pursue.
Given the need to understand the DPRK energy sector, and the lack of direct data available, Nautilus Institute has built and periodically updated its analysis of North Korean energy supply and demand by collecting as much available public sector data relating to energy use and the DPRK economy as possible, including anecdotal information from visitors, customs statistics from the DPRK’s trading partners, estimates on sectoral output by international and other organizations, and analyses of the DPRK economy by other researchers. This information was and is used to compile a “bottom-up” (demand-driven) analysis of changes to the DPRK economy, starting in 1990 (the last “normal” year for DPRK energy supply and demand), using as much sector detail as can be included. In order to ensure that these estimates are internally consistent, we use an “energy balance” approach widely used to report national energy supply and demand worldwide, for example, by the International Energy Agency (IEA).[2]
Our DPRK energy analysis works includes the preparation of energy balances—in which supplies (imports, exports, domestic production) of fuels are balanced by their use and conversion to other forms via energy transformation processes such as oil refining and electricity generation, and, ultimately, by end-use demand—for all of the fuel categories used in the DPRK economy.[3] In addition, we prepare estimated detailed supply-demand balances for oil products in particular, meaning for crude oil and for the refined petroleum products made from crude oil, whether those products are domestically refined or imported. Our most recent estimated refined product balances for the DPRK are provided in the section of this report that follows.
Refined Products Balances, 2010 and 2014-2020
Table 1 through Table 8 present refined product balance tables for the years 2010 and 2014 through 2020, respectively. Table 5 has been updated from the balance presented in the earlier (June 2019) version of this Special Report. By our estimates, overall supplies of refined products increased by on the order of 25 percent between 2010 and 2016, with some of that increase being used to expand activity in the transport and other end-use sectors, but much of it going to fuel gasoline- and, particularly, diesel-engine generators, which had been imported in increasing number in previous years, largely from China. Increased use of generators is an indicator of DPRK citizens and organizations taking more of the initiative in providing for their needs for energy services—in this case electricity—in response to limited supplies of electricity available from national and regional grids.
The supplies and thus use of oil products decreased between 2016 and 2017, by our estimates, as the impacts of UNSC sanctions on oil products imports, although it is our estimate that “off-books” imports of oil products must have continued at a significant level in 2017. Supplies decreased only somewhat from 2017 to 2018, despite ongoing UNSC sanctions, again, we estimate, because off-books imports were significant, and also because we assume that crude oil supplies increased somewhat in 2018 (see below).
Another key set of difference between the refined product balances estimated for 2017 and subsequent years versus those of 2016 and previous years is the implication of the impacts of the installation of a catalytic cracking unit at the DPRK’s refinery in its far Northwest at Sinuiju, the Ponghwa Chemical Factory. The estimated impacts of the addition of this unit are presented in more detail below, but include a reduction in the amount of heavy fuel oil available to and used by the DPRK (as heavy fuel oil is a key input to the cracking unit) and a nearly corresponding increase in gasoline and diesel oil, with an emphasis on gasoline and similar light oil products.
Although there have been no official-reported cases of COVID-19 in the DPRK, the DPRK government has responded to the pandemic with a number of measures designed to protect North Koreans from the virus. It is clear that the DPRK’s response to the pandemic has changed the way that the country operated its economy, including its energy sector, through at least the first half of 2020, and many of these changes seem likely to persist, at least partially, through the end of 2020 at least. Worldwide, national and local “lock-downs” and “stay-at-home” orders have resulted in vast reductions in energy demand, particularly for transportation, in part causing, among other impacts, a vast drop in oil prices, and rapidly filling oil and gas storage depots. The DPRK’s energy supply situation is unlike that of other countries, particularly for oil products, due to UNSC sanctions and resulting restrictions on its oil imports. These restrictions require the DPRK to use “unofficial” means to obtain oil supplies and export coal, strategies that are likely more difficult to carry out during the pandemic, due to the need for cooperation by outside trading partners as well as domestic regulations on contacts with foreigners.
The coronavirus pandemic has thus undoubtedly affected DPRK oil product supply and demand. Probably the effect has been significant, as it has in other nations, but since the DPRK provides no energy statistics, and what international energy statistics there are for trade with the DPRK are unlikely to be available for 2020 for some months (and will likely show little trade anyway, due to UNSC sanctions), determining the net impact of the pandemic is a matter for analysis and estimation. We have assumed that the national COVID-19 “lockdown” has and will continue to restrict fuel products demand in many sectors through 2020, although there may be some reduction in restrictions toward the end of the year, and will also results in restrictions on fuel imports, both on- and off-books, by limiting and slowing cross-border commercial traffic by land and sea. Nautilus Institute has thus used its DPRK Energy Analysis tools to prepare an estimate for DPRK energy supply and demand for all fuels for 2020[4]—and the results of those analyses for oil products are provided below.
Table 1: Estimated DPRK Refined Product Balance for 2010
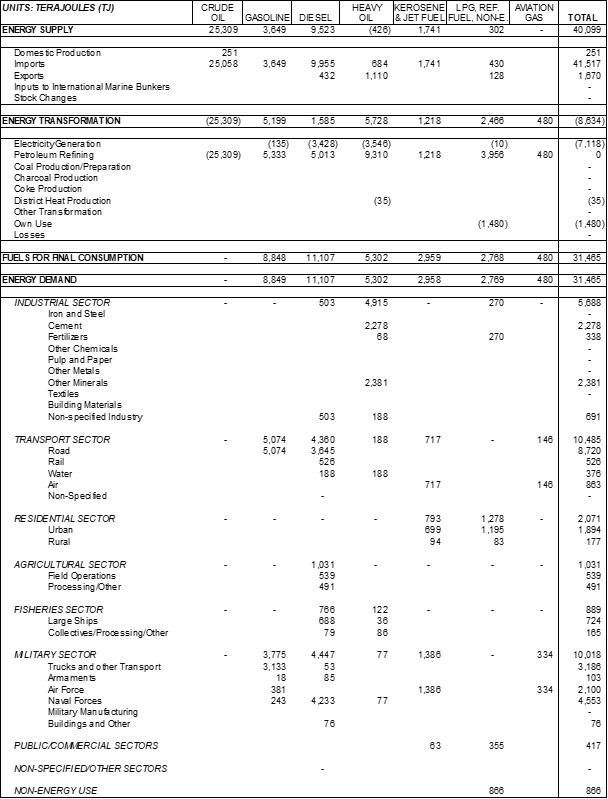
Table 2: Estimated DPRK Refined Product Balance for 2014
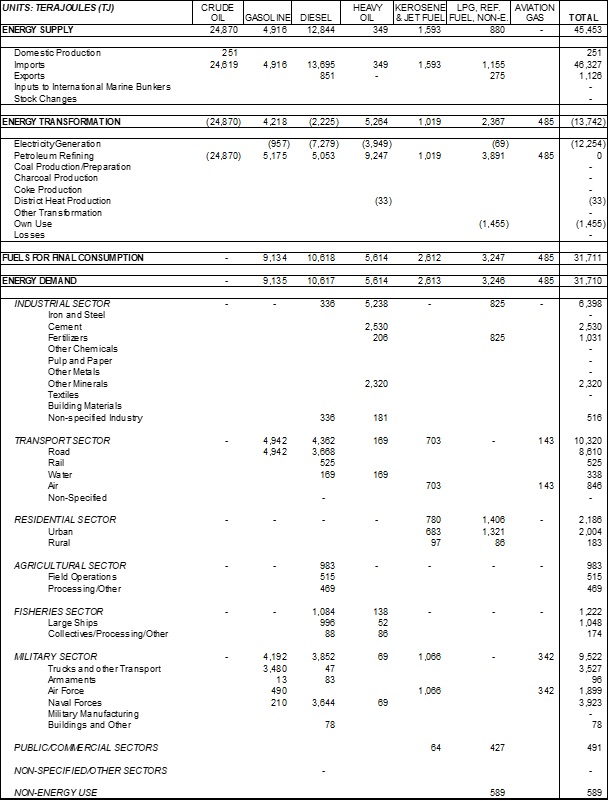
Table 3: Estimated DPRK Refined Product Balance for 2015
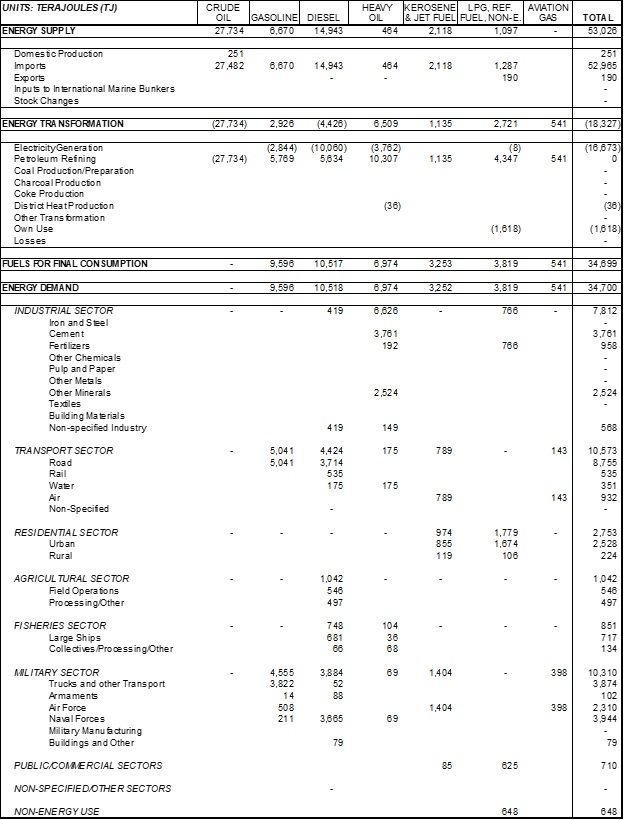
Table 4: Estimated DPRK Refined Product Balance for 2016
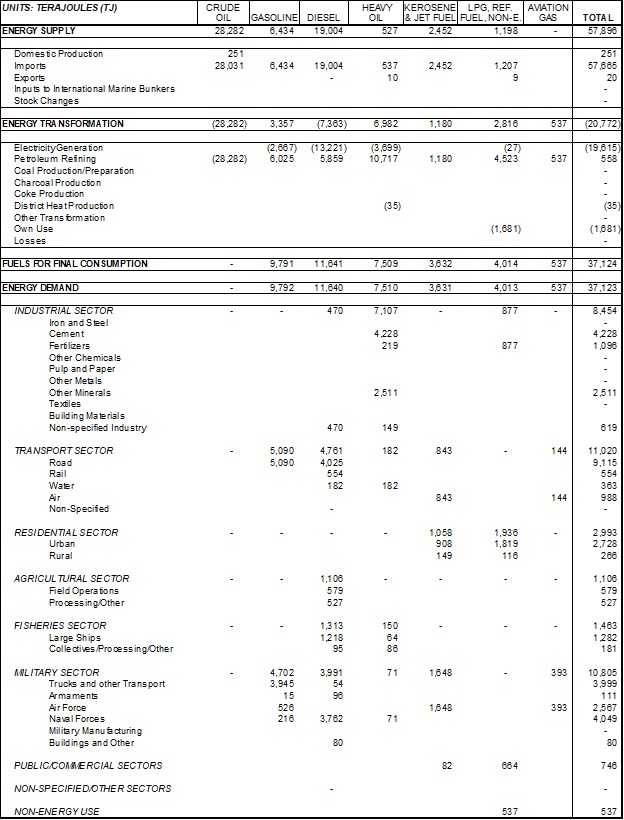
Table 5: Estimated DPRK Refined Product Balance for 2017
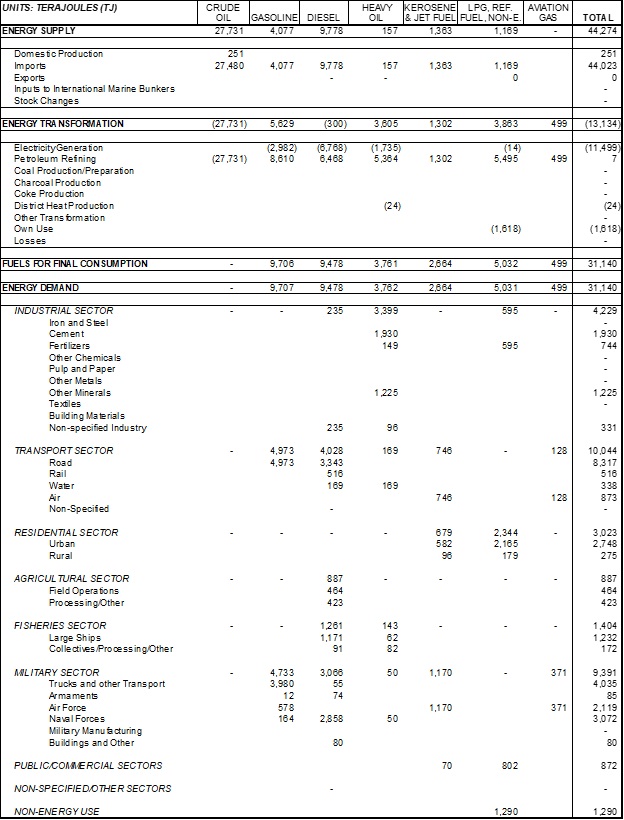
Table 6: Estimated DPRK Refined Product Balance for 2018
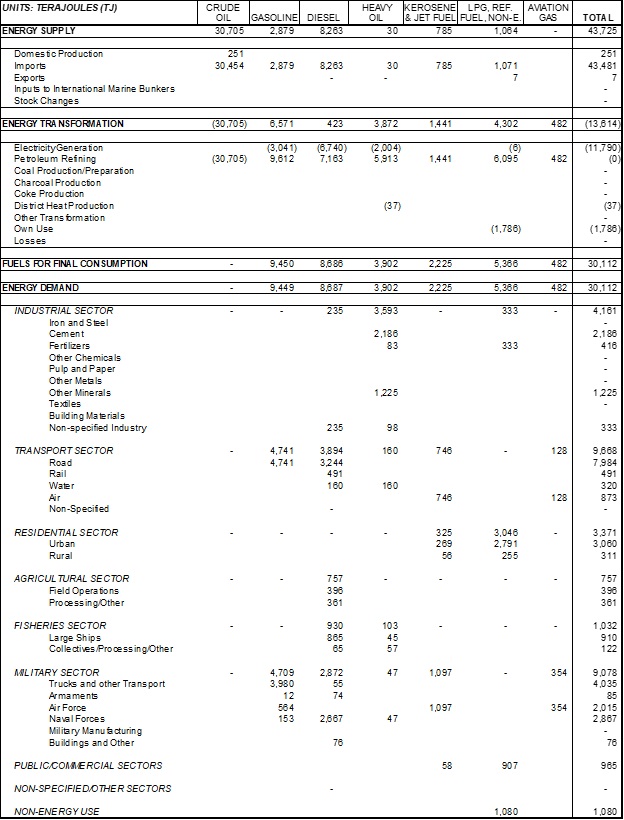
Table 7: Estimated DPRK Refined Product Balance for 2019
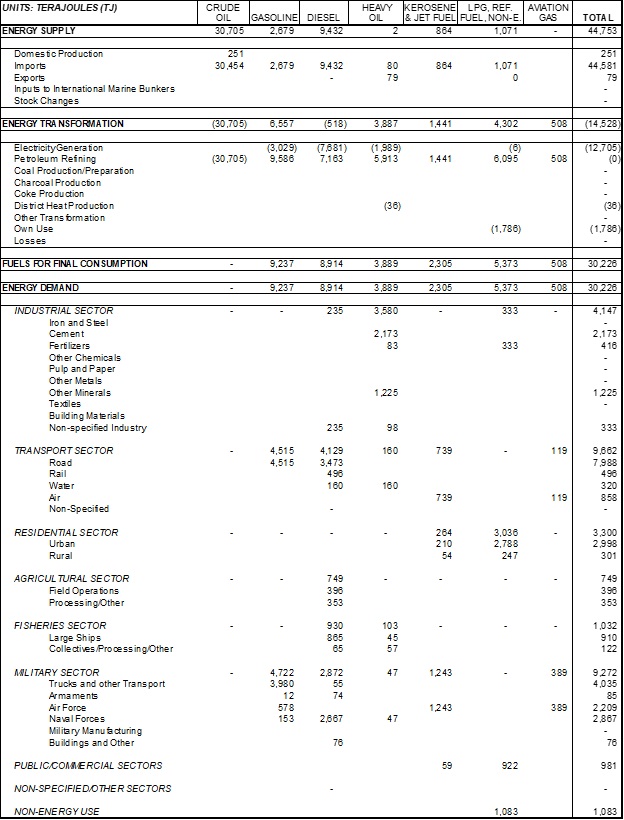
Table 8: Estimated DPRK Refined Product Balance for 2020
Refined Products Use by Sector and Fuel
Overall estimated DPRK petroleum products demand by end-use sector (that is, not including electricity generation) is shown in Figure 1. The three major oil products end-use sectors in 2019 (the years 2010 through 2018 show similar patterns) were military, transport, and industry. Most industrial use was of heavy fuel oil, while the military and transport sectors used mostly diesel fuel and gasoline. Agriculture, fisheries (both mostly diesel), residential, and public/commercial (both using liquefied petroleum gas and kerosene) demand were each a small fraction of overall petroleum products use, as was non-energy petroleum use (consisting of feedstocks for industrial processes, asphalt, and other products).
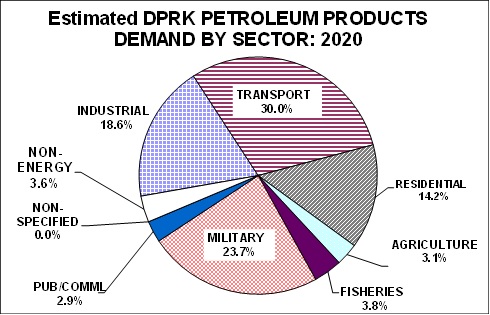
The pattern of overall petroleum products use by sector is estimated to be somewhat different in 2020 (see Figure 2 , with reductions in the fraction of oil products used by the transport sector and particularly the military, due to the national lockdown, while the fraction of industrial oil use rises (mostly as a result of using surplus heavy oil in the cement subsector), as does oil use in the residential sector (due to more availability because other sectors have been shut down, as well as more time spent at home by DPRK citizens, mirroring the experience elsewhere in the world).
Figure 1:
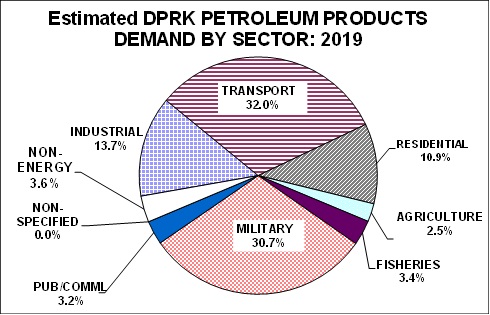
Figure 2:
Use of most refined products (heavy fuel oil being the exception) increased from 2010 through 2016 due to enhanced availability and a more vibrant DPRK economy. Figure 3 shows estimated diesel fuel use over time. Diesel fuel use in the transport sector and agricultural sectors increased generally between 2010 and 2016, with increases in transport activity in diesel trucks offset somewhat by decreases in energy intensity (increases in energy efficiency), as newer trucks imported (largely) from China were incorporated into the DPRK fleet. Diesel use in the military changed relatively little, based on our estimates, as there was not a marked change in military activity during the 2010-2016 period, or at least little change that would affect fuel use. The largest change in diesel use during 2010 through 2016 was in the use of diesel for electricity generation, as the combination of broader availability of diesel, increased imports of generators, and continued unreliable electricity supplies allowed consumers to generate more of their own power. We estimate this trend to have changed markedly in 2017 through 2019, when reduced fuel availability caused reductions of diesel use in virtually all sectors, but particularly for electricity generation.
Diesel use in 2020 is estimated to be lower in virtually all sectors than in previous years, particularly for the transport and military sectors, as a results of restrictions on activity and movement due to the DPRK’s response to the COVID-19 pandemic.
Figure 3:
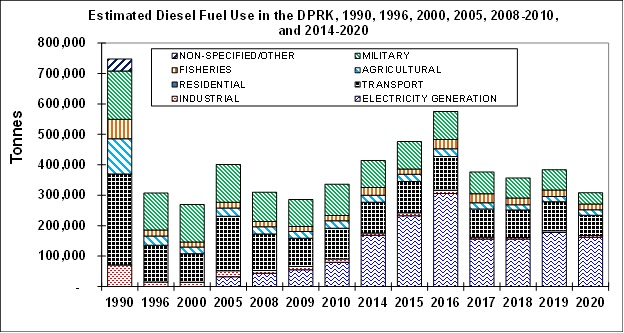
Figure 4 shows estimated trends in gasoline use by year. Here the marked increase from 2010 through 2015 stalls in 2016 as estimated supplies did not continue to expand in that year, and declines in 2017 and slightly further in 2018 due to reductions in gasoline availability due to USNC sanctions. The declines in availability of gasoline imports in 2017 through 2019, however, are estimated to have been substantially offset by additional gasoline available from the catalytic cracking unit installed at the Ponghwa Chemical Factory during 2016. To some extent, and mostly in rural areas, reduced motor fuel (in 2017 through 2019, mostly diesel) availability may have been compensated for by a rise in the use of trucks adapted to use “gasifiers” fueled with wood, crop waste, charcoal, and/or coal as a substitute for gasoline. Use of such trucks has been reported regularly during the last three decades in the DPRK, but may have risen in the last few years.[5] As with diesel fuel, the years since 2010 have seen a marked rise in the use of small imported personal/household generators (perhaps 500 to 2000 watts) fueled with gasoline, although we estimate that the rapid increase in use of such generators leveled off in 2016 and 2017 when fuel availability fell and DPRK market prices for fuel, at least in some areas, rose.[6] [7]
For 2020, the national lockdown is estimated to have substantially reduced military and transport (as well as overall) gasoline use, but part of the reduction of gasoline use in those sectors is estimated to have been offset by increased use of gasoline in the small personal generators that would be used in homes (and possibly informal markets) to provide power when grid power was not available.
Figure 4:
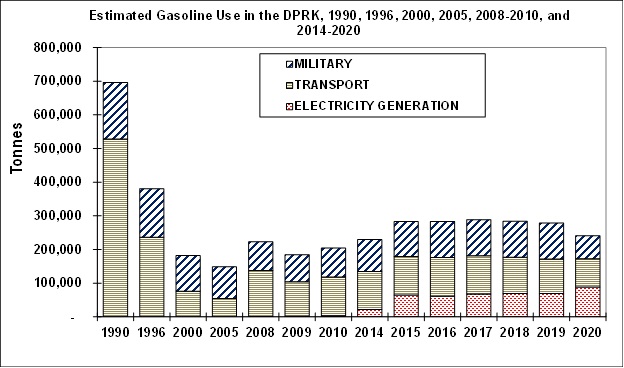
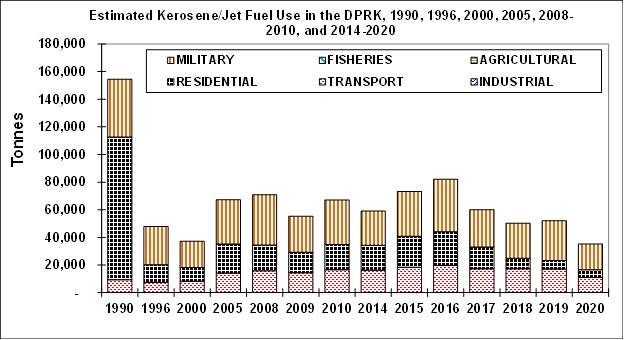
Figure 5 shows estimated kerosene and jet fuel use in the DPRK over the years, divided mostly between use in the transport sector (for jet transport), the military (for military aircraft) and in the residential sector (as a lighting and cooking fuel). We assume that all of these end-uses declined significantly between 2016 and 2017, with reduced use continuing through 2019 (and 2020). Unlike diesel and gasoline, we have heard little suggesting that off-books trade in kerosene and jet fuel has been significant in recent years, though such trades are of course possible. The reduction in transportation use of jet fuel between 2016 and 2017 (and 2018/2019) probably meant fewer domestic flights on jet-engine aircraft, as we assume that international flights (most relatively short, by the national carrier Air Koryo) probably fueled up mostly in their destination countries.[8] The decline in kerosene use in the residential sector could have been partially compensated for by the use of other cooking fuels (LPG, biomass and coal, for example), and/or the use of alternative lighting fuels, such as electricity from photovoltaic panels. In 2018, in particular, we assume that kerosene use declined in large part through substitution by LPG, which is a cleaner and more convenient fuel for many end-uses, and seemed to be in more abundant supply in 2018 and 2019. The reduction in military jet fuel use between 2016 and 2017/2018 probably stemmed from a reduction in training flights in fighter and other jets; such flights were already at what would be considered a low level for most other militaries. In 2020, we estimate significant reductions in kerosene/jet fuel use for military and civilian aircraft, but that the use of kerosene in the residential sector changed relatively little.
Figure 5:
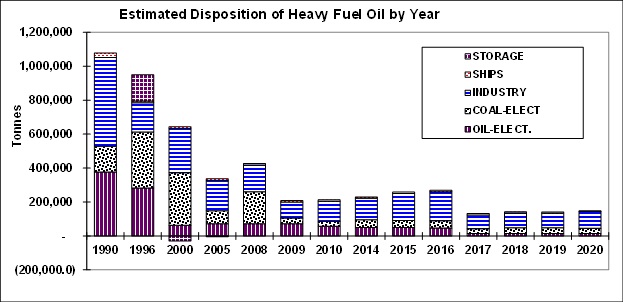
Heavy fuel oil (HFO, also sometimes called residual fuel oil) has limited uses in the DPRK. It is used in a very few freighters and ships of the DPRK navy, for some industrial processes (as a fuel, albeit not a major fuel, for cement making and for minerals processing), and as a fuel for electricity generation in two or three power plants designed to use heavy oil, plus as a starter fuel (typically only a percent or two of total fuel use) for coal-fired power stations and district heating boilers. The trend in disposition (use/storage) of heavy fuel oil by year is shown in Figure 6. We estimate that heavy fuel oil use rose somewhat between 2010 and 2016, with most of the increase being in the industrial sector, and declined substantially between 2016 and 2017/2018/2019 because of lower availability, as roughly half of the heavy fuel oil formerly produced by the DPRK’s one operating large refinery was converted to lighter products using the catalytic cracking unit installed in 2016. This decline in heavy oil use, however, was mainly in sectors and in end uses where coal is a ready substitute for heavy fuel oil. In 2020, we estimate that heavy oil use actually increased somewhat relative to 2019, with most of that increase in the industrial sector, and largely related to increased use (per unit of total fuel use) of HFO for making cement, although the overall volumes of cement manufactured (and used) are estimated to have fallen due to the impact of COVID-19 restrictions on the construction sector. HFO supplies are estimated to have increased in 2020 relative to 2020 because of greater assumed refinery input in 2020 (see below).
Figure 6:
DPRK Domestic Oil Products Production
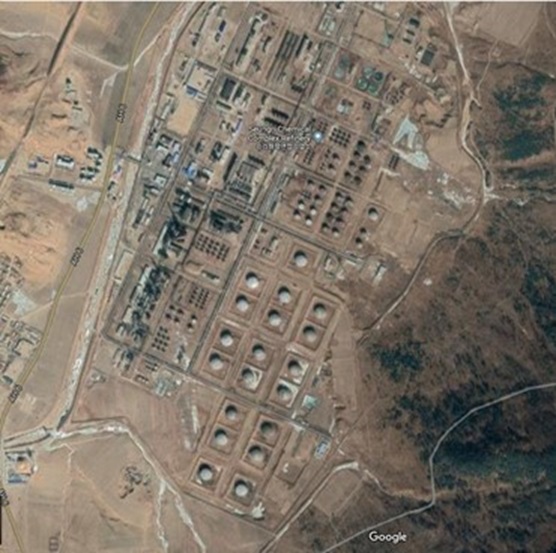
The DPRK has two major larger oil refineries, located near the border with China at Sinuiju and near the border with Russia at Sonbong. The refinery at Sinuiju, the Ponghwa Chemical Factory (see Figure 7) is supplied via a crude oil pipeline from China and appears to have operated more or less continuously for three or more decades. A refinery of somewhat larger capacity, the Seungri Chemical Complex refinery, in the DPRK’s northeast near Sonbong, was fueled with Russian, and then Middle Eastern, crude oil in the 1980s and early 1990s, but has reportedly operated only sporadically since, and perhaps hardly at all in the last decade (see Figure 8). A third refinery, of relatively small capacity and using fairly basic technology, was reportedly in use in the Nampo area, possibly operated by the DPRK military.
Figure 7: Refinery at Sinujiu, Northwest DPRK[9]
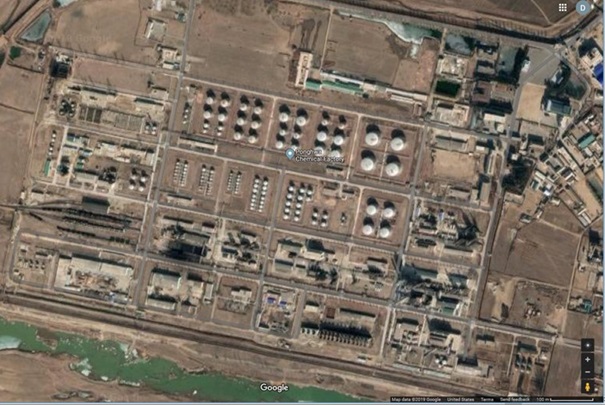
Figure 8: Refinery at Sonbong, Northeast DPRK[10]
There have been reports of crude oil production in the DPRK dating to the 1990s and possibly earlier, including an onshore well and possibly some offshore production. These reports have been difficult to corroborate, and though experts contacted by the authors believe there is probably (or at least has been) some domestic DPRK oil production, the quantity produced appears to be (or have been) small. We assume production of just under 6 thousand tonnes annually, about 1 percent of what the DPRK imports from China, but that must be seen as a rough estimate.
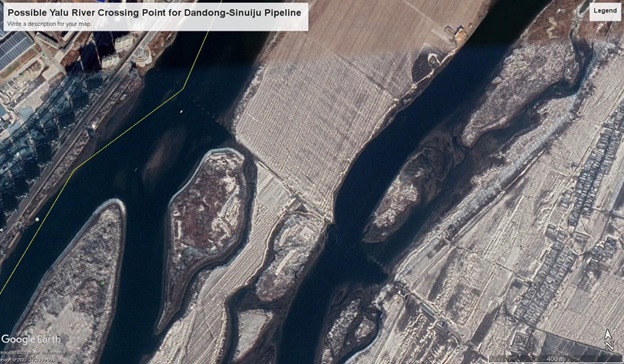
Although crude oil imports, likely mostly by sea, to its refinery in Sonbong have dwindled over the years, the DPRK continues to import oil by pipeline to its Sinuiju refinery. The pipeline from Dandong, on the Chinese side of the Yalu River, to the Ponghwa Chemical Factory outside Sinuiju is fed with oil transported from the Daqing oil fields by train to Dandong, where it is loaded into the pipeline.
Figure 9: Possible Yalu River Crossing Point for Dandong-Sinuiju Crude Oil Pipeline[11]
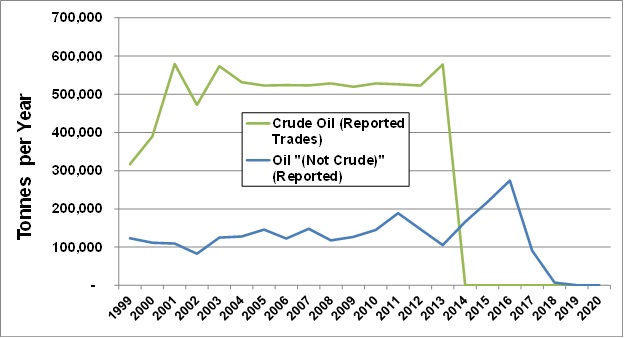
These crude oil flows were reported in China’s customs statistics through 2013, when reporting stopped, although the flows of oil apparently have not. A recent article confirmed that China continues to send crude oil across the border to the DPRK, in part because the waxy nature of the oil means that if flows are allowed to stop, particularly during cold weather, it would be very difficult to return the pipeline to operation. We have assumed that 2014 crude oil exports from China to the DPRK via pipeline were 578,000 tonnes, the same as was reported in customs statistics in 2013, were 645,000 tonnes from 2015 through 2017, and increased, possibly temporarily, to 715,000 tonnes in 2018.[12] We assume that inputs of crude oil by pipeline from China were the same in 2019 as assumed for 2018. For 2020 we assume—and this is largely conjecture on our part—that in China’s desire to help the DPRK manage the coronavirus pandemic[13], it provides somewhat more oil by pipeline to the DPRK. The opportunity cost of China in doing so would be quite low, considering reduced demand for oil in China and low international oil prices during the pandemic. We thus assume that the flow through the pipeline in 2020 will total 750,000 tonnes. Figure 10 summarizes crude oil and refined oil product exports to the DPRK from China since 1999, as reported in Chinese customs statistics. China reported just under 7000 tonnes of non-crude oil products exports to the DPRK in 2018, far less than in previous years. Although some oil export statistics have been published for 2019 in the UN Comtrade database, no information on oil exports from China have been published there for 2019 or 2020 as of this wrting. China did, however, report to the “Panel of Experts” of the UNSC oil product exports to the DPRK during the first 10 months of 2019 totalling just under 23,000 tonnes, with the Russian Federation reporting about 31,000 tonnes of exports to the DPRK over the same period.[14]
Figure 10: Reported Crude Oil and Oil Products Exports to the DPRK from China, 1999 – 2020[15]
As noted above, a key change—and one of the few reported in recent years—in the DPRK’s oil refining capacity has been the addition of a catalytic cracking unit at the Sinuiju refinery (the Ponghwa Chemical Factory). Although the details of this addition, estimated from satellite images to have been installed in approximately 2016, are not available, basic oil refining equipment tends to be similar the world over.
In late July 2019, we were made aware[16] that the DPRK’s refinery at Sinuiju had installed a new unit in 2016, most likely a fluid catalytic cracker unit (see Figure 11).[17] Based on expert advice,[18] it is likely that this unit is being used to convert some of the heavy fuel oil produced by the refinery into lighter products.
It is most likely that this cracking unit was supplied by a Chinese vendor, and that this size of unit would be available from Chinese manufacturers. Our review of trade statistics suggests that the DPRK did import significant quantities of catalyst materials (over $1 million worth) from China in each of the years 2015 – 2017[19] but there is no way to know if these catalysts were used for this particular cracking unit. We have thus far been unable to identify with any certainty a customs statistics category in which the import of this unit by the DPRK is identified, as there are several possible categories under which the trade could have been listed, if the trade was in fact recorded.
Such units, however, are typically provided in a small number of discrete sizes. We therefore assume that the unit is sized to use approximately 50 percent of the HFO produced by the refinery into lighter products. This would imply a capacity of about 250,000 tonnes per year for the cracker unit–a common size for such units–albeit at the smaller end of the size range of cracking units typically sold internationally.
The product slate for the throughput of the cracker is estimated to be as shown in Table 9. Applying the cracking unit to half of the refinery’s output of heavy fuel oil results in the outputs, expressed as a fraction of crude oil input, shown in Table 10.
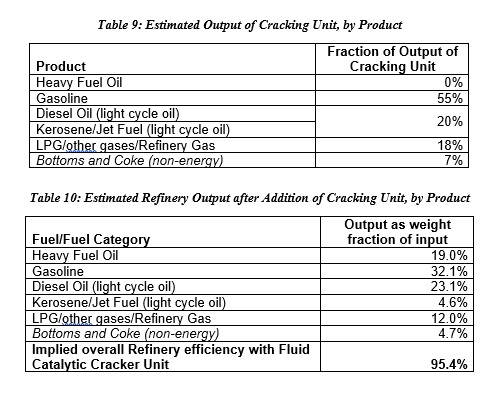
Figure 11: Likely Catalytic Cracking Unit Installed at Ponghwa Chemical Factory
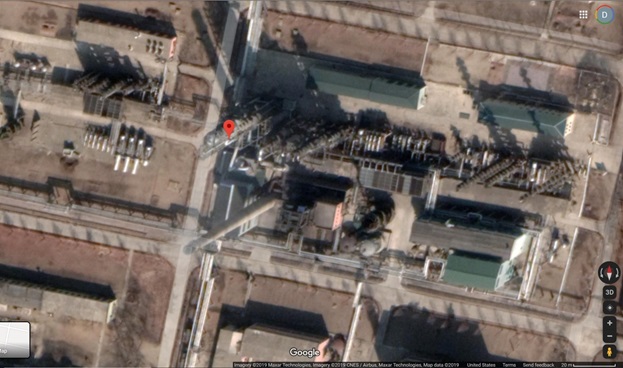
Figure 12 shows the site at the Ponghwa Chemical factory where the cracking unit is currently located as of May 2015, before the unit was installed. The red circle in this image, as well as in Figure 11 and Figure 13, indicate the location of the unit. Little work on the site is in which the catalytic cracking unit was later installed is evident in this image, but the installation appears complete as of an image from February 16. 2017 (Figure 13), suggesting to us that the unit was not operational during 2015 and probably most of 2016, but was operational for most or all of 2017 and thereafter. This timing, of course could be made more definitive by review of additional images taken between the time points shown in the figures, but additional images were not immediately available to the authors.
Figure 12: Site of Future Catalytic Cracking Unit as of May 26, 2015[20]
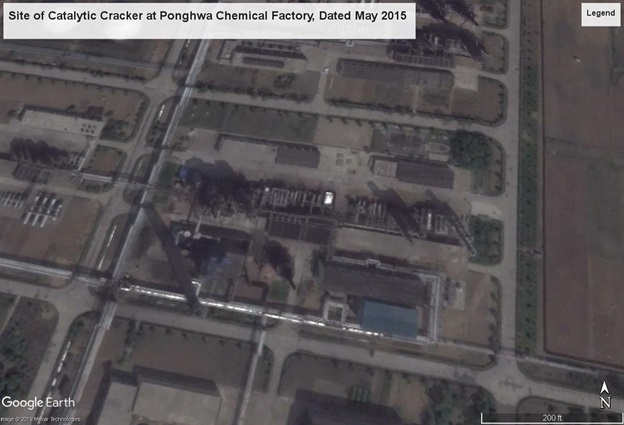
Figure 13: Probable Catalytic Cracking Unit at Ponghwa Chemical Factory as of February 16, 2017[21]
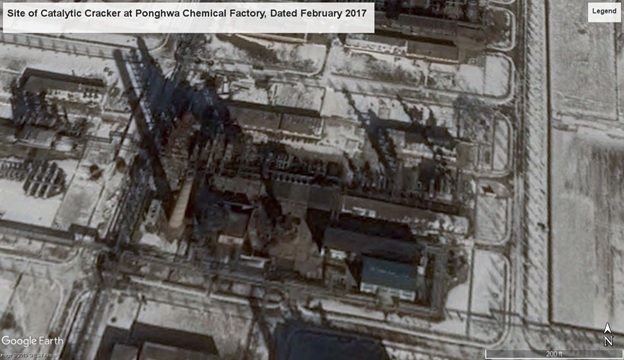
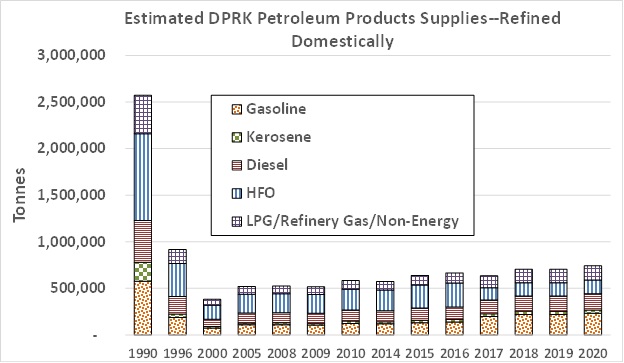
Figure 14 presents our estimates of refined products outputs by the DPRK’s refineries through the years. Most evident here is the drop-off in output between 1990 and 1996 and later years. As 1990 was arguably the last “normal” year for the DPRK economy—the impacts on the DPRK of the collapse of the Soviet Union were just starting to be felt then—the difference between 1990 and subsequent refined products output is an indicator of the DPRK’s “energy insecurity”, that is, the restrictions in the availability of fuel that has been in significant part driving DPRK policies. By our estimates, refined product output, constrained largely by the availability of crude oil imports, mostly from China, changed relatively little between 2010 and 2020, with the exception of the reduction in heavy fuel oil output, and increase in (mostly) gasoline output, starting in 2017, with the installation of the catalytic cracking unit described above. We also estimate about a 10% increase in output in 2018 relative to 2017, and another small increase in output in 2020, based on our estimates of somewhat higher crude oil supplies to the Ponghwa Chemical Factory refinery via pipeline from China, as described above.
Figure 14:
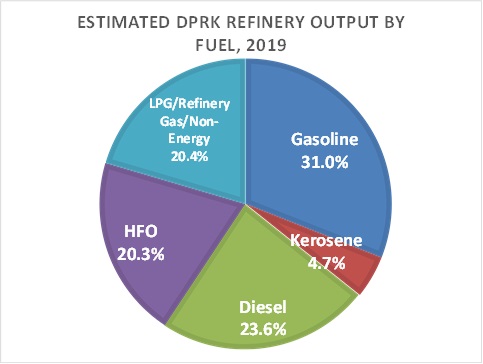
Our estimates of the fractional outputs of refined products by fuel type in the DPRK in 2019 are presented in Figure 15. Results for other years from 2017 to 2020 are similar. In general, the ability of a given refinery to change the fractions of the different products it produces is limited by the refinery’s infrastructure and by the type of crude oil it uses. As a consequence, for example, although the DPRK’s needs for gasoline and diesel are greater than its needs for heavy fuel oil (HFO), it was constrained by the type of reactors available at its refinery and the composition of the crude oil that it (mostly) gets from China to produce more HFO than either of the more valuable motor fuels. This situation changed with the installation of the new cracking unit in approximately 2016, which allowed the DPRK to produce more of the products needed by the economy. Further changes in the aggregate product “slate” of the DPRK’s refineries could come through use of different types of crude oil,[22] if and when such imports (or, likely further into the future, significant crude oil supplies from domestic resources) are available, as well as through expansion or reactivation of existing refineries.[23]
Figure 15:
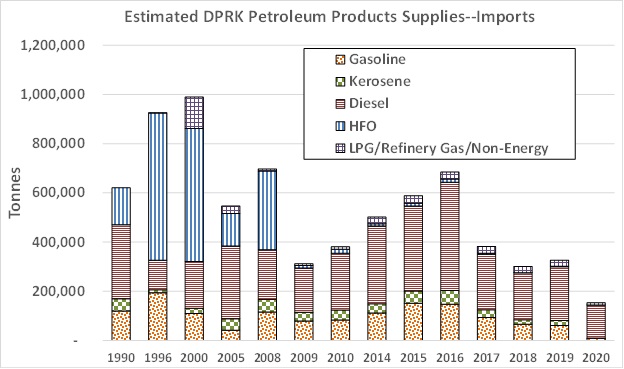
DPRK petroleum products imports, by our estimates, increased sharply between 2010 and 2016, providing fuel for the economic growth in the DPRK witnessed by many visitors (see Figure 16). We estimate that refined product imports declined in 2017 through 2019 due to the enforcement of UNSC sanctions by the international community, but that a significant volume of refined products still must have reached the DPRK through “off-books” channels, with those trades assumed to continue through 2020. In 2020, however, oil product trades are assumed to be reduced by transport/import restrictions, including reductions in truck, rail, and ship traffic, and slowdowns at border facilities, caused by the DPRK’s quarantine procedures related to the COVID-19 pandemic.
Figure 16:
Oil products imports have reached and reach the DPRK in a variety of ways:
- Official (that is, reported in customs statistics) oil product exports from China. Up until about 2010-2015, this was the largest source of oil products imports to the DPRK in most years, and included many different categories of fuels and non-fuel oil products. In recent years, official oil product trade from China to the DPRK have fallen dramatically as a result of USNC sanctions. We assume that this oil has entered the DPRK mostly by sea-borne tanker, but some doubtless also arrives across the DPRK’s northern border in rail tanker cars and trucks.
- Official (on-books) trade of oil products—largely, it appears, diesel fuel—from Russia to the DPRK. This reported trade has tended to vary significantly from year to year, with some years showing trades of hundreds of thousands of tonnes (2005 to 2007, for example), and others showing trades of only a few thousand tonnes (2009, 2012, 2016, and 2017, for example), with a total of about 25,000 tonnes of exports from Russia to the DPRK in 2018. These shipments are also by ship, rail, and truck.
- Official (reported in customs statistics) shipments from other countries to the DPRK, including spot market purchases from oil trading centers such as Singapore. In most recent years, these imports have been in the thousands to tens of thousands of tonnes, and come from a variety of countries around the world. In some cases, however, we have assumed that trades must have been reported in error. For example, we find it unlikely that India sold 800,000 tonnes of gasoline to the DPRK in 2008 for three-quarters of a billion dollars. It seems more likely that this trade was mis-reported, and actually involved the Republic of Korea (that is, was mistakenly recorded as exports to North Korea rather than South Korea) or another country.
- Unofficial (not reported in customs statistics) trades involving Chinese companies, including, for example at-sea ship to ship transfers of oil.[24]
- Unofficial or semi-official (not reported in customs statistics, but in some case acknowledged by Russian authorities) shipments of oil from Russia to the DPRK.[25] [26]
- Smuggling of oil from unknown sources.[27]
The first three of these import modalities are (to the extent that customs statistics are accurate) straightforward to quantify. The last three are quite difficult to quantify, and probably, absent the most advanced and assiduously applied intelligence tools (which are certainly not available to the authors of this paper), impossible to quantify accurately.
In order to estimate “off-books” imports of oil products to the DPRK in recent year, we have adopted and adapted estimates from several sources (including those above), then estimated what a reasonable reduction in DPRK oil products use might be to meet the level of estimated supply, taking into account the apparently modest economic impacts of oil supply reductions on the DPRK economy that have been observed by visitors in recent years.
In the report The Rise of Phantom Traders: Russian Oil Exports to North Korea, dated July 2018, The Asan Institute for Policy Studies estimates, based on tracking customs transactions between the Russian firm Independent Petroleum Company (IPC) and three North Korean business entities, that refined oil product sales to the DPRK in the years 2015 through 2017 were as follows:[28]
These figures are reasonably consistent with the estimates offered in both the references cited above (Reuters article quoting President Putin, and quote from DPRK émigré) We therefore assume that the Asan Institute estimates apply as the total amount of oil exported “off books” from Russia to the DPRK in 2015 through 2017, and further estimate that 90 percent of the oil products in these shipments were diesel fuel, with the other 10 percent being gasoline, based roughly on the pattern of on-books trades in the two products from 2005 through 2017 (based on customs statistics). We further assume that this pattern of trade was established prior to 2014, but that in 2014 imports from Russia by this mode were a bit lower, at 180,000 total tonnes, with diesel and gasoline (or similar products) sold in approximately the same proportions as assumed for 2015 through 2017.
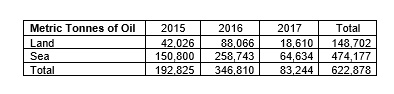
A more recent range of potential ship-to-ship transfers of oil products during part of the year 2018 is included the March 5, 2019 Report of the Panel of Experts established pursuant to resolution 1874 (2009), which includes an analysis of potential ship-to-ship oil transfers allegedly used by the DPRK to circumvent UNSC sanctions restricting imports of refined products. The Panel of Experts analysis remotely tracked the berthing of relatively small-capacity (approximately 900 to 5000 deadweight tonnes) tankers at DPRK ports, most notably Nampo, but also including Chongjin, Najin, Wonsan, and others. The Panel of Experts analysis calculated the volume of oil that would have been delivered by those vessels over the period from January 1 through August 18 of 2018 under assumptions that the vessels were 33 percent, 50 percent, and 90 percent full when they docked (and delivered that quantity of fuel). Under these three assumptions, the total fuel delivered would have been about 108,000, 164,000, and 295,000 tonnes of oil products, respectively.[29] Official reviewers of this analysis from the Russian Federation did not find the analysis acceptable, for reasons not fully specified. It seems possible to us that in counting all of the vessels docking at these ports, the analysis may have included some transfers of oil products purchased under the allowed UNSC 500,000 barrel (bbl) limit, and/or some transfers of refined product from DPRK refineries (most notably the refinery at Sinuiju, the Ponghwa Chemical Factory) to one or more of these ports. And/or some of these shipments might have represented transfers from port to port, and thus have been effectively double-counting oil shipments. Still, we take the Panel of Expert’s point is that even if these vessels were a third full, they would represent oil transfers greater than the 500,000 bbl limit, and thus is it improbable that all of the transfers viewed by these ships were of oil obtained through transactions that allowed under sanctions. Further, the volumes calculated by the Panel of Experts did not cover all of 2018. Starting with the Panel of Experts estimate of the amount of oil that would have been delivered by the observed tankers if they were on average half full, and assuming that the deliveries continued at about the same pace through the rest of 2018, the tankers would have delivered about 260,000 tonnes of oil products. We consider this as an upper limit on off-books oil product imports to the DPRK for 2018.
For 2019, in addition to the officially-reported volumes of exports from China and Russia to the DPRK described above, the March 2020 “Panel of Experts” UNSC document previously cited[30] includes descriptions, provided by a Member State (the US), of 64 deliveries of oil products (or, at least, visits to oil terminals) by foreign-flagged tankers to the DPRK (paragraph 10, page 9), and another “at least” 157 suspected deliveries (paragraph 33, page 20) from DPRK-flagged tankers. Some or many of the oil products that made up these deliveries were apparently obtained through ship-to-ship transfers at sea, either from foreign-flagged to DPRK-flagged vessels, or from foreign-flagged to other foreign-flagged vessels. The US report to the UNSC Panel of Experts estimated the total deliveries of petroleum products over the first 10 months of 2019 under three scenarios, as follows: with tankers providing deliveries averaging of 1/3rd full 1,436,412 bbl, if averaging 50% full, 2,164,113 bbl, and if averaging 90% laden 3,894,426 bbl. The tankers used in these shipments appear to vary in capacity from about 8000 to 44,000 tonnes of oil products.[31] It is not clear whether these recorded deliveries include those “on-books” transfers recorded in the (roughly) 409,000 bbl from Russia and China, and it seems possible to us that some of these port visits could have been intra-DPRK transfers from its Sinuiju refinery (via transfer from train cars or tanker trucks, or from an oil product pipeline connected to the Ponghwa Chemical factory, if such a pipeline exists). Assuming that the deliveries described above continued through 2019 and were at the 50 percent level on average, and an average of 8.0 bbl of oil products per tonne, the total deliveries reported by the US in the UNSC report would be 324,617 tonnes. If the “on-books” deliveries are included in this total (we cannot tell whether they are or are not), the total additional “off-books” imports, at least via ship (which is highly likely to be most, perhaps nearly all, of total off-books imports) would be 260,266 tonnes in 2019. The figure before subtracting on-books trade (if it is included) is somewhat higher than the corresponding figure for 2018 (see above). To what extent that reflects a real increase in off-books imports by the DPRK or is simply the result of better methods of/more complete detection of deliveries is not possible for us to determine.
For 2020, we estimate and project that oil product imports to the DPRK, both on-books and off-books, will be significantly reduced due to restrictions in cross-border transport and quarantine arrangements related to the DPRK’s response to the COVID-19 pandemic. As a result, we assume that 2020 on-books exports of diesel and gasoline to the DPRK from China and Russia will total 35 percent of 2019 levels, and that off-books exports from Russia sum to 30 percent of the 2017 values estimated as above.[32]
Comparing the total petroleum product supplies based on the on-books and off-books estimates above, together with our estimates of supplies from domestic DPRK oil refining, with our estimates of trends in demand, for 2014 through 2020 we assume that ion each year there were at least some oil product imports to the DPRK that are not captured in any of the statistics or estimates of “off-books” trade above for those years. These imports may come from Russia, China, or other international vendors, and may be coming in by land or sea. They may be barter trades or products imported via the black market. Our assumptions as to imports by product, from 2014 on, are as follows:
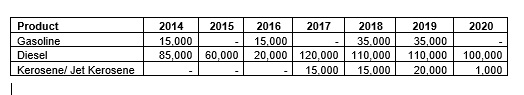
For 2017, when UN Security Council restrictions on oil imports were in full force, our assumption is that even after the addition of the catalytic cracker unit to the Sinuiju refinery, without a significant amount of fuel–likely diesel and some kerosene/jet fuel, beyond the imports described in customs statistics and off-books imports from Russia above, signs of fuel shortages, particularly for diesel fuel would have been more evident in the DPRK than visitors describe. We therefore assume that there were reductions in fuel use across the board, but also the amounts of fuels shown above made their way into the country. For example, the 120,000 additional tonnes of diesel fuel that we assume were imported “off-books” is more or less consistent with the (sanctions-evading) shipments recorded as received or planned through a Taiwanese company, as reported by the UNSC “Panel of Experts”.[33]
The installation and start of operations of the catalytic cracking unit at Ponghwa, depending on how and when its operations were phased in, may have resulted in a change in the market for gasoline in the DPRK. Manifestations of this change in the short term, until the market adjusted to increased supply through, for example, more use of gasoline vehicles relative to diesel vehicles, could have included reductions in off-books imports of gasoline, some additional storage of gasoline (augmenting stocks temporarily or for the longer term), and/or reduced gasoline prices at DPRK filling stations.
For 2018, we assume that the total off-books trade in oil products with the DPRK was on the order of 160,000 tonnes, which would be at the low end of the set of sensitivity values provided in the Panel of Experts analysis, if those figures were extrapolated to 12 months of deliveries. Our estimate for 2019 is much the same, but includes slightly more imports of kerosene/jet fuel. For 2020, we estimate that in addition to our (projected) on-books and off-books estimates of imports above, another 100,000 tonnes of diesel (plus 1000 tonnes of kerosene/jet fuel) would be needed to meet fuel demand at the levels we estimate, even factoring in a substantial demand reduction due to COVID-19. This would represent about one-third of the medium scenario (tankers averaging half-full) 2019 estimate of deliveries of oil products to the DPRK provided in the March 2020 Panel of Experts Report. We feel that this level of imports is consistent with the general reported reductions in DPRK/China cross-border traffic and trade into and out of the DPRK in general in 2020 as described by many observers.
Considerations in Analysis of Recent DPRK Oil Product Supply and Demand
Key caveats to the analysis presented above include:
- Although we have done our best to estimate energy demand by sector, based on what is known about physical sectoral outputs, and what can be guessed at based on reports by visitors and other analysts, there is little solid information about energy demand in the DPRK. As such, although we provide trends that seem consistent with availble information, true figures, if indeed they are ever ascertained, may be different.
- For the years 2014 through 2020 we have estimated volumes of oil products imported “off-books”, that is, not captured in customs statistics, that exceed, at least for 2017 (though not necessarily for 2018 and 2019) the volumes of such imports estimated by others, because we feel that it A) likely that some off-books imports have inevitably gone undetected, and B) assuming that our energy demand results for earlier years are reasonable, it seems improbable that DPRK oil products demand could decrease enough to account for the decrease in reported (on- and off-books) fuels imports without severe and visible economic dislocation, which visitors have not reported.
- We have also estimated that China shipped to the DPRK by pipeline in 2018 and 2019 was somewhat more oil than it reported to the Panel of Experts—though crude oil exports from China to the DPRK have not appeared in customs statistics for several years. This estimate is based on an estimate, which we find persuasive, of crude oil flows that factor in the technical characteristics of the pipeline into the Ponghwa Chemical Factory refinery, and results in higher 2018 and 2019 domestic production of refined products in the DPRK than would otherwise be the case. For 2020, we assume that these exports, which cost China relatively little, will ultimately be about 5 percent higher than in 2019 and 2018. It is, however, very difficult for an outsider to know how much oil China is shipping to the DPRK in a given year, and it is probable that even the most careful remote analysis of how much crude oil goes into the Dandong/Sinuiju pipeline will have margine of errors of greater than 5 or 10 percent.[34]
- It is possible that off-books imports were either greater than we have estimated, in which case served demand for oil products would be higher (particularly in 2017 through 2019) than we show in the tables and figures above, and/or that some of the oil product demand in 2017 through 2019 was served by drawing down stocks of oil products. If we had to guess, we would probably say that off-books imports were greater than we have estimated, rather than less.
Potential Energy Impact of Humanitarian Engagement Strategies Relative to DPRK Oil Imports
In a Nautilus Institute Special Report published in 2018, David von Hippel and Peter Hayes described a rapid-deployment (6 months) $100 million “Program” of humanitarian energy assistance and engagement that the international community might provide for the DPRK (see https://nautilus.org/napsnet/napsnet-policy-forum/rapid-relief-of-humanitarian-stress-from-energy-sanctions-building-energy-efficiency-and-solar-pv-measures-for-rapid-installation-in-pyongyang/). The Program centers on the use of A) building energy efficiency measures in apartments in the DPRK, likely in Pyongyang, to provide heating services to residents, and B) installation of solar photovoltaic mini-grids in schools and clinics to provide to reliable power for those facilities. Both sets of measures provide opportunities for on-the-ground and highly visible engagement between the international community and the DPRK.
The 50,000-apartment building energy retrofit (insulation, improved windows and doors, weatherstripping, heating controls, and other measures) we propose would reduce coal use (assumed to be central heating) by about 900 TJ (terajoules, a unit of energy equivalent to about 24 tonnes of oil products) annually, or 22,000 TJ over the lifetime of the measures. An alternative to providing heat with coal-fired central heating (or boilers) in the DPRK might be to use diesel-fueled generators (which have been imported in large numbers in recent years, see https://nautilus.org/napsnet/napsnet-special-reports/dprk-imports-of-generators-in-recent-years-an-indication-of-growing-consumer-choice-and-influence-on-energy-supply-decisions/) to produce electricity, then for apartments to use electrical resistance heat. If heating is provided via diesel generating sets, the savings in fuel from the building energy efficiency measures is about 2400 TJ/year, or about 60,000 TJ over the lifetime of the measures.
The photovoltaic (PV) installations (about 14 MW total) for schools and/or clinic would save 300 TJ per year in displaced coal for electricity generation or about 7,000 TJ over the life of the systems.
By way of comparison with refined products volumes, the 1200 (900 + 300) TJ of displaced coal per year would be about 3% of the approximately 35,800 TJ of diesel, gasoline, kerosene/jet fuel, and LPG that we estimate was used in the DPRK (including for electricity generation) in 2017, and a slightly higher percentage of the about 34,900 we estimate was used in 2018. The 35,800 used TJ in 2017 excludes heavy fuel oil, but includes all sources of refined products, both reported and “off-books”. Using the “genset-and-resistance-heating” comparison, the total rises to 2700 TJ/year, or about 8 percent of refined products use (again excluding heavy oil). The analog to the 35,800 TJ figure for 2017 in 2016 is about 44,000 TJ , meaning that our estimate is that use of these fuels (including for electricity generation) fell by about 8.5 PJ (petajoules, or thousand TJ) between 2016 and 2017 as a result of accommodations to the lower availability of oil product supplies in the DPRK (including reduced fuel use and, in some sectors, fuel substitution) due to UNSC sanctions.
If our six-month program is ramped up to approximately four times its size in a 2-year engagement strategy, the expanded program would save coal use on the order of 13 percent of DPRK 2017 petroleum products supplies, which would be more than half (in TJ) of what we are estimating the DPRK reduction in oil use between 2016 and 2017 might have been. If one assumes that some or all of the program savings are displacing electricity generation by diesels generator sets to generate heat for apartments, the relative savings is greater.
This type of engagement serves to relieve some of the humanitarian impacts of sanctions, with a particular focus on addressing impacts on ordinary DPRK citizens, but leaves the sanctions regime largely intact pending progress in talks to address the DPRK’s nuclear weapons program. It thus represents an important option for engagement and confidence-building while talks continue, with few “downsides” in terms of potential diversion of significant benefits to the DPRK military or to elites.
We estimate the overall supplies of oil products in the DPRK as shown in Figure 17.
Figure 17:
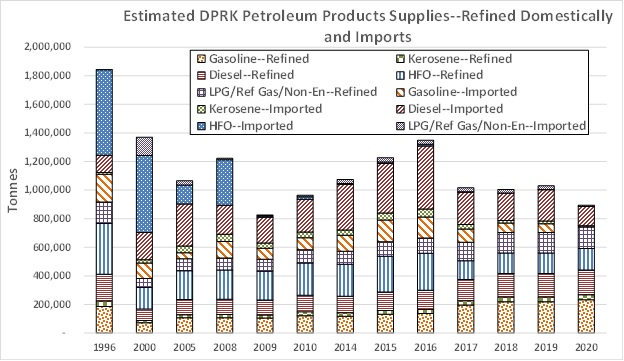
Refined products produced (almost entirely) from crude oil imported by pipeline from China serve as a consistent, if minimal, source of fuel supply for the DPRK economy, but it has been imports, which increased markedly from 2010 to 2015, that have allowed the DPRK economy to grow. Some of these imports were from on-books (customs-reported) trades, but many most likely were not, particularly after the advent of UNSC sanctions. We estimate that 2017 through 2019 oil supply (and thus use) was less than in 2016, based on at least transient price spikes for diesel and gasoline as reported by visitors to the DPRK, but do not see the type of reductions in oil product availability that the authors of the UNSC sanctions on oil product imports probably hoped to see. For gasoline, in particular, supplies in the DPRK were likely improved in 2017 by the addition, in 2016, of a catalytic cracker unit at the DPRK’s Ponghwa Chemical Factory, its oil refinery near the Northwestern city of Sinuiju. This unit allowed some of the heavy fuel oil formerly produced by the refinery to be converted into lighter products, most notably gasoline. 2018 and 2019 supplies from domestic refining may have been slightly higher than in 2017, if our assumptions about crude oil flows to the Sinuiju refinery being higher than reported are correct. It is also possible that 2017 through 2019 oil supplies to the DPRK were in fact greater than we have estimated, but we do not think it is likely that supplies would have been much less. For 2020, we estimate that the result of the DPRK government’s measures to prevent the COVID-19 pandemic from severely affecting the DPRK have and will have resulted in reduced oil product use in 2020, particularly in the transportation and military sectors, and likely also limited imported refined oil product imports.
As time goes on, it is likely that the DPRK will get more adept, rather than less, in obtaining off-books the oil (oil products in particular) imports that it needs, and the enthusiasm of some countries for preventing such imports may wane. We therefore suggest that an even stronger emphasis on engagement with the DPRK by the international community is called for on issues vital to the DPRK’s energy security (and addressing its energy insecurity), such as the building energy efficiency/renewable energy engagement strategy described above.
III. ENDNOTES
[1] See David von Hippel and Peter Hayes (2018), DPRK Motor Vehicle Imports from China, 2000-2017: Implications For DPRK Energy Economy, NAPSNet Special Reports, August 23, 2018, available as https://nautilus.org/napsnet/napsnet-special-reports/dprk-motor-vehicle-imports-from-china-2000-2017-implications-for-dprk-energy-economy/, and David von Hippel and Peter Hayes, DPRK Imports of Generators in Recent Years: An Indication of Growing Consumer Choice and Influence on Energy Supply Decisions?, NAPSNet Special Reports, November 02, 2018, available as https://nautilus.org/napsnet/napsnet-special-reports/dprk-imports-of-generators-in-recent-years-an-indication-of-growing-consumer-choice-and-influence-on-energy-supply-decisions/. Note that DPRK imports of vehicles and generators as reported in United Nations Comtrade trade statistics (https://comtrade.un.org/data/), most of which are from China, have dropped off steeply between 2017 and 2018. It is certainly possible that some of this decline is due to UNSC sanctions enforcement, but the decline is such that it is difficult to believe that trade channels and relationships between vendors and buyers would have shriveled so quickly, so we suspect that some off-books trades in vehicles and generators continued through 2018.
[2] See, for example, the IEA compendium available for sale at http://data.iea.org/payment/products/117-world-energy-balances-2019-edition-.aspx, or the energy balances published by the Korea Energy Economics Institute for the Republic of Korea (ROK) as a part of (for example) Energy Info Korea 2017, available as http://www.keei.re.kr/keei/download/EnergyInfo2017.pdf.
[3] Previous versions of our DPRK energy analysis work for all fuels are David von Hippel and Peter Hayes (2012), Foundations of Energy Security for the DPRK: 1990 – 2009 Energy Balances, Engagement Options, and Future Paths for Energy and Economic Development, dated September 13, 2012, and available as
https://nautilus.org/wp-content/uploads/2012/12/1990-2009-DPRK-ENERGY-BALANCES-ENGAGEMENT-OPTIONS-UPDATED-2012_changes_accepted_dvh_typos_fixed.pdf; and David von Hippel and Peter Hayes (2014), An Updated Summary of Energy Supply and Demand in the Democratic People’s Republic of Korea (DPRK), NAPSNet Special Reports, April 15, 2014, available as https://nautilus.org/napsnet/napsnet-special-reports/an-updated-summary-of-energy-supply-and-demand-in-the-democratic-peoples-republic-of-korea-dprk/
[4] A forthcoming Nautilus report will provide additional details and results of our analysis of DPRK demand for all fuels through 2020.
[5] A Radio Free Asia article entitled “Charcoal-powered Vehicles Stage a Comeback in North Korea”, dated 2016-12-09, reported by Jieun Kim, translated by Soo Min Jo, written in English by Roseanne Gerin, and available as https://www.rfa.org/english/news/korea/charcoal-powered-vehicles-make-a-comeback-in-north-korea-12092016160533.html, describes the resurgent use of “charcoal” fueled trucks in particularly rural parts of the DPRK, and in the Northeast city of Chongjin, for transport services of all kinds, including transport for hire. The article notes the use of these gasifier trucks (which we assume are actually using charcoal, wood, crop waste, coal, and/or waste oil fuels, as available locally, in on-truck gasifiers), has increased in recent years in some locales due to fuel restrictions, possibly due to sanctions. 1, 2.5, and 15, and 20-tonne truck models have been seen using the technology, but it appears that the 2.5-tonne, DPRK-made Seung-ri 58 (Victory 58) model is most frequently seen fueled by gasifiers. The article also notes that around 70 percent of gasifier-driven trucks (presumably in the specific area described) are from rural military units.
[6] As an example of fluctuating DPRK fuel prices, albeit from 2018, a July 24, 2018 Reuters article entitled “Exclusive: North Korean fuel prices drop, suggesting U.N. sanctions being undermined”, by Hyonhee Shin, and available as https://www.reuters.com/article/us-northkorea-economy-exclusive/north-korean-fuel-prices-drop-suggesting-u-n-sanctions-being-undermined-idUSKBN1KE15F,
includes the following passage: “China said on Tuesday it strictly abided by U.N. sanctions, but indicated it may have resumed some fuel shipments to North Korea in the second quarter of this year. Gasoline was sold by private dealers in the North Korean capital Pyongyang at about $1.24 per kg as of Tuesday, down 33 percent from $1.86 per kg on June 5 and 44 percent from this year’s peak of $2.22 per kg on March 27, according to Reuters analysis of data compiled by the Daily NK website. Diesel prices are at $0.85 per kg, down about 17 percent from March. The website [that collects price data] is run by North Korean defectors who collect prices via phone calls with multiple traders in the North after cross-checks to corroborate their information, offering a rare glimpse into the livelihoods of ordinary North Koreans.”
[7] In addition, the rapid growth in imports of generators to the DPRK through 2015, or at least imports as reported in customs statistics available through the UN Comtrade system, ceased in 2016, with reported 2016 imports of generators to the DPRK from China markedly lower than in 2015, 2017 imports lower still, and 2018 imports only a few percent, if that, of 2015 imports. Some of this decline was doubtless due to the impact of UNSC sanctions on DPRK fuel supplies and availability of DPRK funds to pay for equipment, but it is possible that the decline in actual trade was not as steep as is shown in official statistics, because there was some off-books trade in generators. We have no direct evidence of off-books trade in generators, but it would be unusual to see such active trades in a set of products fall quite so rapidly.
[8] A number of reports have indicated that on a number of instances, at least in 2019, and contrary to expectation, Air China jet aircraft have been seen apparently fueling at the international airport in Pyongyang from an Air Koryo fuel truck. This has raised speculation that Air China is actually defueling in the DPRK and thus providing jet fuel in violation of sanctions, although doing so may be technically difficult. Other explanations for this observed activity. including simply that China was able to get a good price for DPRK-refined jet fuel, are possible, or has brought in its own fuel by truck but is using Air Koryo fueling infrastructure. See, for example, Oliver Hotham (2019), “NK Pro investigation sheds light on Air China’s N. Korea fueling arrangements”, NK News, dated December 16, 2019, and available as https://www.nknews.org/2019/12/nk-pro-investigation-sheds-light-on-air-chinas-n-korea-fueling-arrangements/.
[9] From Google Maps, accessed May 23, 2019, https://www.google.com/maps/place/Sinuiju,+North+Pyongan,+North+Korea/@40.0735202,124.5453298,964m/data=!3m1!1e3!4m5!3m4!1s0x5e2afe38ccd630eb:0xd9765aa741246bf5!8m2!3d40.0823213!4d124.4489192.
[10] From Google Maps, accessed May 23, 2019, https://www.google.com/maps/search/sonbong+refinery/@42.3113238,130.348157,2387m/data=!3m1!1e3.
[11] We are not entirely sure where the pipeline crosses the Yalu River from China to the DPRK, but the Google Earth Pro image below, located at approximately coordinates 40.154, 124.44, shows what could be the pipeline crossing the Yalu diagonally from upper left to lower right. Image date 2.19-2020.
[12] A 2018 article in NK Economy Watch, “Chinese oil exports to N Korea increased after KJU’s third visit to China”, dated July 19th, 2018, by Benjamin Katzeff Silberstein includes the following passage: “China also dramatically increased oil shipments to the North. A source in Beijing said it nearly doubled crude oil supplies to the North through pipelines from Dandong since Kim’s recent visits. ‘Some 30,000 to 40,000 tons of oil is enough in the summer to maintain the lowest possible flow of oil in the pipelines to ensure that they don’t clog, and about 80,000 tons in winter,” the source added. “Though it’s summer now China has recently increased flow to the winter level.” (Units are assumed to be metric tonnes.) Original source, “China Doubles Oil Shipments to N. Korea After Kim’s Visit”, Lee Kil-seong and Kim Myong-song, Chosun Ilbo, 2018-07-19. Assuming that this physical reason for China to maintain minimum flows through the pipeline is correct (and we have heard this explanation elsewhere), one can estimate a minimum flow through the pipeline in a “normal” year by assuming 35,000 metric tonnes per month over a 7-month (April-October) “summer” season of warmer months, with a corresponding average of 80,000 tonnes per month over the remainder of the year, which would yield an average of 645,000 tonnes of crude oil annually. We assume crude imports via pipeline at this rate from 2015 through 2017, with 2018 imports likely, based on the above, to have been at least somewhat higher. Note that the report of the UN Panel of Experts (March 5, 2019 Report of the Panel of Experts established pursuant to resolution 1874 (2009), available as available at https://www.undocs.org/S/2019/171) includes (on page 153) a note on China’s exports of crude oil to the DPRK:
“….and China reported that the amount of the supply of crude oil by China to the Democratic People’s Republic of Korea was 150,500 tons from December 2017 to February 2018; 147,900 tons from March to May 2018; 108,500 tons from June to August 2018; and 118,100 tons from September to November 2018.” These figures total 525,000 tonnes, which is the maximum allowed under the UNSC sanctions regime. Although these periods in total do not quite match up to the 2018 calendar year, we assume that they are approximately the same as a calendar year total. We feel that the higher estimate of crude oil provision based on the physical limitations of the China-DPRK pipeline operation as described above may be a better figure than the reported total here, thus we use the higher total crude oil imports for 2018 and 2019 estimated as described.
[13] See, for example, BBC News (2020), “Coronavirus: China offers to help North Korea fight pandemic”, dated 9 May 2020, and available as https://www.bbc.com/news/world-asia-52597749.
[14] The UNSC “Panel of Experts” in UNSC (2020), Note by the President of the Security Council, number S/2020/151, dated 2 March 2020, and including “Annex: Letter dated 26 February 2020 from the Panel of Experts established pursuant to resolution 1874 (2009) addressed to the President of the Security Council”, available as https://undocs.org/S/2020/151, includes information on both recorded petroleum product exports by member states (China and the Russian Federation) to the DPRK that are allowed under sanctions, and a range of estimates of suspected volumes of ship-to-ship transfers of oil products ultimately delivered to the DPRK that would have been in evasion of sanctions.
[15] Data from United Nations Comtrade Statistics, https://comtrade.un.org/. No data for oil trades from China to the DPRK for 2019 had been entered in Comtrade as of mid-2020, and no 2020 data were yet available.
[16] Leo Byrne, then of NK News, personal communication, 7/29/2019.
[17] Figure from Google Maps, 2019. Location of cracking unit (latitude and longitude) is approximately 40.071680, 124.551321.
[18] The remainder of this paragraph and the next paragraph drew on input from Dr. David Fridley, formerly of Caltex, for which we are grateful (personal communications, July 30, 2019). The authors remain solely responsible for any errors of fact or interpretation therein.
[19] From review of annual trade statistics at: https://comtrade.un.org/data. Catalyst trades from HS category 3815.
[20] Image from Google Earth.
[21] Source: Google Earth.
[22] Comtrade statistics for 2017 show exports of a very small amount of crude oil, 165 tonnes, from the Russian Federation to the DPRK. This quantity of oil would not have materially changed the DPRK’s overall product slate.
[23] Thinking further into the future, however, the advance of non-fossil energy technologies may ultimately mean that in a time when the DPRK has resolved its differences with the international community it may choose to base production of fuels and chemicals on, for example, processes that use hydrogen produced with renewable electricity together with carbon dioxide from the atmosphere or other sources, rather than simply upgrading its existing venerable refineries. See, for example, Stephen Leahy (2018), “This Gasoline Is Made of Carbon Sucked From the Air”, National Geographic, published June 7, 2018, and available as https://www.nationalgeographic.com/news/2018/06/carbon-engineering-liquid-fuel-carbon-capture-neutral-science/.
[24] See, for example, Yosuke Onuchi (2019), “North Korea’s oil smuggling blows past import cap: UN report:
Ship-to-ship transfers become increasingly sophisticated”, Nikkei Asian Review, dated February 26, 2019, and available as https://asia.nikkei.com/Politics/Trump-Kim-Summit/North-Korea-s-oil-smuggling-blows-past-import-cap-UN-report.
[25] For example, a Reuters article in 2017 (“Russia says its oil supplies to North Korea are negligible”, by Denis Pinchuk, dated September 5, 2017, and available as https://www.reuters.com/article/us-russia-northkorea/russia-says-its-oil-supplies-to-north-korea-are-negligible-idUSKCN1BG13N), quotes Russian President Vladimir Putin as saying “We have supplies of 40,000 tonnes of oil and oil products to North Korea a quarter”, which would imply about 160,000 tonnes per year. This is close to the lower end of the range of oil exports from Russia to the DPRK, as estimated by other analysts.
[26] A North Korean émigré has been quoted in various publications as estimating that Russia exported 200,000 to 300,000 tonnes of oil products annually in recent years to the DPRK via dealers based in Singapore (“…Ri Jong Ho, a former official in North Korea’s Office 39, supplied in a recent interview with Kyodo News..”). See, for example, Benjamin Katzeff Silberstein (2017), “North Korea’s ICBM-test, Byungjin and the economic logic”, dated, July 4th, 2017, and available as http://www.nkeconwatch.com/category/energy/oil/.
[27] Courtney Kube and Dan De Luce (2018), “Top secret report: North Korea keeps busting sanctions, evading U.S.-led sea patrols”, NBC News, dated December 14, 2018, and available as https://www.nbcnews.com/news/north-korea/top-secret-report-north-korea-keeps-busting-sanctions-evading-u-n947926.
[28] The Asan Institute report is available as document http://en.asaninst.org/wp-content/themes/twentythirteen/action/dl.php?id=45032; data shown from table on page 27 of that report.
[29] Figures above from Panel of Experts report (2019), Table 1 of Annex 2, starting on page 74 of the referenced document, available at https://www.undocs.org/S/2019/171.
[30] UNSC Panel of Experts (2020), ibid.
[31] From the first Table in Annex 1 of UNSC 2020 report, totals on page 86.
[32] This value is reasonably close to the actual year-on-year 2020 versus 2019 January through June reported shipments of oil products from China and Russia to the DPRK. Quoting a UNSC document of 7/22/20 that was not immediately available to us, Yonghap News Agency, in “Chinese, Russian oil shipments to N. Korea plunge amid coronavirus pandemic”, dated 7/22/20 and available as https://en.yna.co.kr/view/AEN20200722008000325, lists total deliveries from China and Russia to the DPRK of 14,302 tonnes of refined products, compared with an approximate reported 29,602 tonnes in the first half of 2019 (a rough estimate, as we do not have at hand monthly figures for Russian exports during 2019), which would be about 48% of 2019 deliveries. This represents, however, only the “on books” trades reported in the first half of 2020, and the impact of COVID-19 on total on- plus off-books trades is likely to have been different.
[33] From paragraphs 71 and 72 of UNSC (2018), Note by the President of the Security Council, number S/2018/171, Annex: Letter dated 1 March 2018 from the Panel of Experts established pursuant to resolution 1874 (2009) addressed to the President of the Security Council, available as http://www.un.org/ga/search/view_doc.asp?symbol=S/2018/171&referer=/english/&Lang=E.
[34] Such an analysis would be possible using high-resolution and regular satellite images to count the number of oil cars/trains discharging cargo at the oil storage and pumping terminal at Dandong. We do not have access to a complete annual set of such images, as our work is limited to the use of publicly available images such as those in Google Earth or images that other authors have published. Even with a very complete set of images, it would be difficult to know for certain that one has accounted for all of the trains discharging their cargo, due to unloading missed due to the timing of satellite images or prevailing cloud cover. And even with a complete count of every train car that has been unloaded at Dandong, one would still not know with certainty how full the train cars were, on average.
IV. NAUTILUS INVITES YOUR RESPONSE
The Nautilus Asia Peace and Security Network invites your responses to this report. Please send responses to: nautilus@nautilus.org. Responses will be considered for redistribution to the network only if they include the author’s name, affiliation, and explicit consent