DAVID VON HIPPEL AND PETER HAYES
AUGUST 23 2018
I. INTRODUCTION
In this Special Report, the authors find that DPRK-China trade statistics show that the DPRK transportation sector “is becoming more modern, mechanized, and, significantly, more dependent on motor fuels than in previous decades.”
David von Hippel is Nautilus Institute Senior Associate. Peter Hayes is Director of the Nautilus Institute and Honorary Professor at the Centre for International Security Studies at the University of Sydney.
The views expressed in this report do not necessarily reflect the official policy or position of the Nautilus Institute. Readers should note that Nautilus seeks a diversity of views and opinions on significant topics in order to identify common ground.
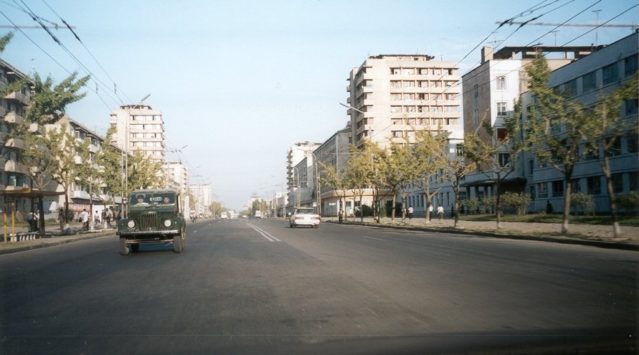
Banner image: Vehicles in Nampo City, Nautilus Institute photograph.
II. NAPSNET SPECIAL REPORT BY DAVID VON HIPPEL AND PETER HAYES
DPRK MOTOR VEHICLE IMPORTS FROM CHINA, 2000-2017: IMPLICATIONS FOR DPRK ENERGY
AUGUST 23 2018
This Special Report reviews recent imports of Chinese vehicles to the DPRK, and examines the fuel usage implications of these imports. We first review cross border trade statistics for these imports in general. Next, we examine trucks, followed by passenger cars, then motorcycles and bicycles. We conclude by examining the implications of the modernization and re-motorization of the DPRK transport sector evidenced by these imports, and the related fuel usage by this sector in the DPRK.
Imports of Motor Vehicles (four wheels or more) to the DPRK
Based on trade statistics available through the United Nations “Comtrade” data system,[1] the value of the DPRK’s motor vehicle imports (trades include in HS category 87) have increased markedly in recent years, from $28 million (from China) in 2005 to nearly $200 million in 2015 over $250 million in 2016, and $200 million again in 2017.[2] By value, 98 and 99 percent of these imports came from China in 2015 and both 2016 and 2017.
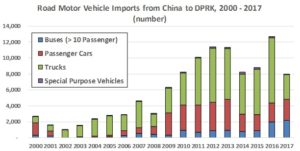
Figure 1 shows the imports of motor vehicles, in number of units, by type of vehicle, from 2000 through 2017. Notable here is the significant growth in the imports of passenger cars and, particularly, trucks since the late 2000s. Over the entire period since 2000, these data mean that on the order of 107,000 road vehicles (not including tractors, motorcycles, or bicycles) were added to the DPRK economy since 2000. Although some of these probably replaced older vehicles that were retired, our guess is that most of these additions reflect higher use of motorized transport, both for passengers (implied by the addition of nearly 12,000 buses and mini-buses) and goods (63,000 truck purchases).
Figure 1:
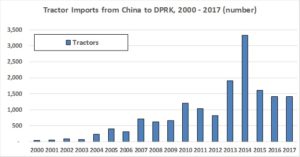
Another telling aspect of the motor vehicle import data is that, as shown in Figure 2, the DPRK has been importing tractors (HS category 8701) from China, in volumes totaling nearly 16,000 units since 2000, and the vast bulk of those brought in during the last decade. This implies that the DPRK is in the process of re-mechanizing its agricultural sector.
Figure 2:
Imports of Trucks
Among road vehicles, arguably the most important to the DPRK economy are trucks, and they (along with trains) enable the movement of goods around the country. Overall imports of trucks to the DPRK, as noted above, grew by a factor of 10 from 2000 through 2016, from under 800 in 2000 to over 8,000 in 2016 (albeit with considerable annual variation). Figure 3 shows the disposition of truck imports by type over time. Here a notable trend has been in the relative increase in the imports of larger diesel trucks, over 20 tonnes gross vehicle weight. Although smaller trucks constituted almost all of the truck purchases in 2004, by 2016 large trucks made up nearly 40 percent of truck purchases by number, and 70 percent of truck purchase costs by value, though the total number, value, and fraction of total expenditures on trucks accounted for by large trucks declined in 2017 (possibly as a direct or indirect result of changes in economic activity in the DPRK due to United Nations Security Council (UNSC) sanctions on the DPRK imposed during that year).[3] This overall trend, at least pre-2017, points to a DPRK transport sector that is modernizing and trying to become more efficient, but putting more goods on each truck, as well as, probably, shifting freight from other modes to trucks. In addition, the dominance of diesel trucks suggests that diesel fuel is has become an even more important source of energy for the DPRK in recent years.
Figure 3:
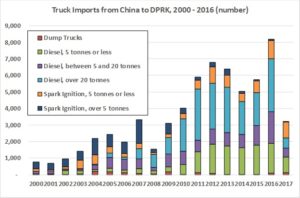
The imports of dump trucks show a somewhat different pattern than those of trucks in general, peaking, for the most part, in the late 2000s. Our guess is that these dump trucks were imported to support the rapid expansion, at that time, of the mining industries in the DPRK, particularly coal, and particularly those supported by Chinese investments.
Imports of Passenger Cars
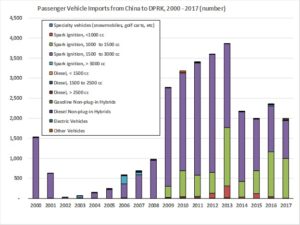
As shown in Figure 4, imports of passenger cars to the DPRK from China increased dramatically starting in 2009, and continuing through 2013, though imports since then have been lower. The majority of vehicles have been spark ignition (gasoline-fueled) cars with engine displacement between 1500 and 3000 cubic centimeters (ccs), probably representing vehicles purchased by social elites and for use as taxis, although in recent years (2016 and 2017) smaller vehicles (engine displacement 1000 to 1500 cc) have become a larger part of import volumes. Hidden within the statistics for passenger car imports in 2017 are a small handful of hybrid vehicles and perhaps a few dozen all-electric cars (the volume is our estimate, based on the total value of shipments), indicating at least an interest, among some North Koreans, in starting to adopt electric vehicles. 2017 is the first year that electric passenger vehicles appear explicitly in the statistics, although a few units may have appeared under “other” in previous years. Overall, these data indicate the addition (probably with some retirements of older vehicles) of nearly 30,000 vehicles to the small DPRK passenger vehicle fleet since 2000, with the vast bulk—over 25,000—of those vehicles added from 2009 through 2017.
Figure 4:
Imports of Motorcycles and Bicycles
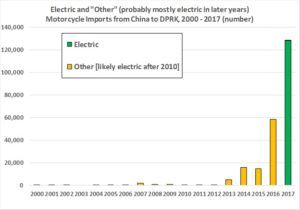
Not shown in Figure 1 is the imports of motorcycles to the DPRK from China. Motorcycle imports were in the range of 600 to 3000 from 2005 through 2012, but have increased markedly since then, to nearly 17,000 in 2014, over 19,000 in 2015, over 60,000 in 2016, and a further doubling to over 130,000 in 2017. Imports of motorcycles are shown in Figure 5, for gasoline-powered vehicles, and in Figure 6 for electric and “other” (probably mostly electric in recent years) motorcycles. Please note the difference in scale in these figures.
Looking more closely at motorcycle sales, most sales have historically been of motorcycles with small internal combustion engines (50 to 250 cc), with a few dozen to a few hundred larger cycles (500 to 800 cc displacement) each year probably destined for sale to DPRK elites (or in some cases, possibly the military, as some large purchases in 2000 and 2005 might indicate). In recent years, however, sales in the category HS 871190, with the less-than-fully-illuminating title “Motorcycles (including mopeds) and cycles n.e.s. in heading 8711, fitted with auxiliary motor, with or without sidecars, sidecars, have risen steeply”. Given that the average cost of the motorcycles in this category has been on the order of $300, we assume that they are electric scooters, as suggested by reporting in 2017, for the first time, of a large number of units (over 128,000) in the category HS 871160, “with electric motor for propulsion”. Over 58,000 of these vehicles were imported to the DPRK from China in 2016 alone, with volume more than doubling the next year. This points toward A) an improving availability of electricity in the DPRK, B) some availability of significant disposable income even among non-elites, and C) a desire for personal mobility on the part of DPRK citizens (and/or a lack of adequate public transport).
Figure 5:
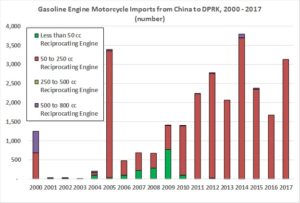
Figure 6:
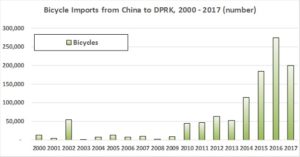
Representing a second category of personal road vehicles, the imports of bicycles ran about 10,000 per year through most of the 2000s, but began to rise significantly starting in 2010, as shown in Figure 7), reaching over 274,000 in 2016 (a new bike for every 90 or so DPRK citizens in that year alone), and over 200,000 in 2017. This too appears to be an indicator of increasing disposable income on the part of ordinary North Koreans, at least in some areas, and the desire for increased personal mobility. The average (wholesale) cost of bicycles imported to the DPRK has been in the range of $50 to $60 each.
Figure 7:
Conclusions
Although 2017 customs data for many HS categories show different (somewhat declining) patterns of vehicle imports to the DPRK relative to 2015 and 2016, probably due at least in part to changes in DPRK imports due to UN Security Council sanctions on the DPRK, in general the imports of road vehicles to the DPRK has increased greatly in the past decade. Together, the changes in imports of road vehicles, powered or not, can be interpreted as signs of:
- An improved and more vibrant DPRK economy;
- The existence of additional disposable income for ordinary DPRK citizens, as well as for elites, enabling expanded and enhanced personal transport, at least in some areas; including the rapid start in deployment, over the last few years, of electric scooters,[4] and the vast increase in imports of bicycles;
- The modernization and re-motorization of the DPRK transport sector;
- At least the start of the re-mechanization of the DPRK agricultural sector, as evidenced by increased tractor imports;
- An increase in the importance of diesel fuel among energy forms, as evidenced by the expanding fleet of large diesel trucks; and
- An increased general dependence on petroleum product imports to a level significantly beyond what the DPRK used in the 2000s, though where those imports are coming from, and how significant the increase in petroleum product use has been has yet to be determined.[5]
III. ENDNOTES
[1] Available as https://comtrade.un.org/data.
[2] The UN Comtrade system also reports exports from the DPRK to other nations in category HS 87 of about $25 million annually in 2015 and 2016, and $12 million in 2017. These trades, mostly totaling tens or hundreds of thousands of dollars annually per nation, but occasionally reaching a few million dollars per year, and mostly trades with smaller nations, may be for goods actually exported from the DPRK, but some may have been errors in reporting trades that were actually, for example, with the Republic of Korea. For example, the reported import from the DPRK of 145 passenger vehicles by Saudi Arabia in 2015, at a cost of about $2.8 million (a little under $20,000 each), seems much more likely to be a mis-reporting of a shipload of South Korean vehicles, or possibly a resale of Chinese vehicles from the DPRK, than actual imports of DPRK-made vehicles, although the latter is not impossible.
[3] Note that China’s trade data with the DPRK for 2017 have just (as of mid-August 2018) become available on the UN Comtrade system. For reasons unclear, some vehicle volume (number of units traded) were not available for 2017, and in those cases we estimated volume based on the value of the imports by category and the average value per unit traded as reported in 2016. These estimated volumes are included in the 2017 values shown in some of the figures provided in this Special Report.
[4] It is possible, though we have not yet done the analysis, that electric scooters could in part be charged by the solar photovoltaic panels that DPRK citizens have been purchasing in large numbers in recent years. The combination of electric scooters and PVs would, if possible, provide an interesting combination of mobility powered by “free” energy.
[5] Nautilus Institute is updating its comprehensive analysis of the DPRK’s energy sector and underlying database (see note1). The results will be published by end 2019.
IV. NAUTILUS INVITES YOUR RESPONSE
The Nautilus Asia Peace and Security Network invites your responses to this report. Please send responses to: nautilus@nautilus.org. Responses will be considered for redistribution to the network only if they include the author’s name, affiliation, and explicit consent


