
DAVID VON HIPPEL AND PETER HAYES
NOVEMBER 23, 2017
I. INTRODUCTION
In this report, David von Hippel and Peter Hayes explore several scenarios for radiological releases, in order to estimate the potential impacts of an accident or attack, and thus the potential benefits in measures taken to avoid those impacts. The modelling shows that a significant radiological release might send a plume over heavily populated areas. The estimate provided in this analysis is therefore only a first order estimate of worst-, intermediate-, and best-case vulnerability of local populations to radiological releases caused by an accident at or attack on the Hamaoka nuclear plants. As an attack on a spent fuel may be timed to coincide when a reactor is under maintenance and many short term contractors are on site, it may be effective to time such maintenance to seasons when winds on average are blowing offshore. This measure needs careful and quantitative analysis for each reactor site.
David von Hippel is Nautilus Institute Senior Associate. Peter Hayes is Director of the Nautilus Institute and Honorary Professor at the Centre for International Security Studies at the University of Sydney.
The full report including the full technical analysis and workbooks is available as a PDF file [3.9MB] here.
Paper prepared for Workshop Reducing Risk of Nuclear Terrorism and Spent Fuel Vulnerability in East Asia co-sponsored by Nautilus Institute and Research Center for the Abolition of Nuclear Weapons, Nagasaki University, Nagasaki, January 20-22, 2017
The views expressed in this report do not necessarily reflect the official policy or position of the Nautilus Institute. Readers should note that Nautilus seeks a diversity of views and opinions on significant topics in order to identify common ground.
Banner image: windrose for Hamoaka region by season from here.
II. NAPSNET SPECIAL REPORT BY DAVID VON HIPPEL AND PETER HAYES
RADIOLOGICAL ESTIMATE FOR ACCIDENT AT OR ATTACK ON JAPAN’S HAMAOKA NUCLEAR POWER PLANT
NOVEMBER 23, 2017
1. Introduction
Below we explore the potential radiological releases associated with an accident at or attack on a nuclear power plant in Japan, with the Hamaoka plant, southwest of the Tokyo area, taken as an example. We explore several scenarios for radiological releases, in order to estimate the potential impacts of an accident or attack, and thus the potential benefits in measures taken to avoid those impacts, including measures reflected in the three Restart paths presented later in this Report. We do not, however, focus on determining how such a particular accident or terrorist attack might proceed and result in damage to reactors and/or spent fuel pools, as that is the subject of other presentations and papers prepared for the “Vulnerability to Terrorism in Nuclear Spent Fuel Management” Project and in a subsequent “scenarios” workshop held in September of 2015.[1]
1.1 Reactor and Spent Fuel Pool Description and Operational Parameters
Nautilus staff prepared a radiological risk assessment for the Hamaoka nuclear power plant, a complex of older and one newer BWR-type units located south and east of the Tokyo area. The Hamaoka site hosts five reactors, Units 1 and 2, at 540 and 840 gross megawatts of electric power (MWe), respectively, went into service in 1980 and 1982, and were taken out of service in early 2009. Units 1 and 2 are now being decommissioned.[2] Units 3 and 4 have gross capacities of 1100 and 1137 MWe, respectively, and were commissioned in 1991 and 1997. Unit 5, an advanced BWR (ABWR) unit with a gross generation capacity of 1380 MWe, was commissioned in early 2005. Figure 2‑1 provides a diagram of the Hamaoka power plant, and Figure 2‑2 shows an aerial photo of the facility. Until they were taken off line for safety assessments following the Fukushima accident, Hamaoka units 3 and 4 had operated at average capacity factors of about 78 percent over their lifetimes, and unit 5 had operated at a capacity factor of 43 percent.[3] The Hamaoka complex is located near the town of Omaezaki in Shizuoka Prefecture, about 170 km from Yokohama and 200 km from Tokyo.
Our analysis of radiological releases from the Hamaoka plant focuses on the older operable (but as of this writing, still not restarted) units #3 and #4. Units 3 and 4 use uranium enriched to 3.0% U-235,[4] use about 140 tonnes of heavy metal (tHM) each in their reactor cores, and are assumed to be refueled every 12 months, with 20 percent of the core replaced, and an average capacity factor of 70 percent,[5] implying an average burn-up of about 30 GWth-d/tHM (gigawatt thermal days per tonne of heavy metal), 2524 GWth-days of burnup in the reactor core at the time of refueling and an annual spent fuel discharge of just under 28 tHM per year per reactor. The website http://hamaoka.chuden.jp/english/about/management.html lists the end-of-fiscal-year (FY) 2013 spent fuel pool inventory at Hamaoka Unit 3 as 2,060 assemblies, or 376.98 tHM, and the end-FY-2013 spent fuel pool inventory at Hamaoka Unit 4 as 1,977 assemblies, or 361.79 tHM. This suggests that each of the Unit 3 and Unit 4 spent fuel pools had room for about 7 fuel replacement cycles as of the end of 2013, and were thus effectively nearly full, given that typical operation leaves room in the pool for a full reactor core (in this case, the equivalent of five replacement cycles) and the fuel from one replacement cycle.
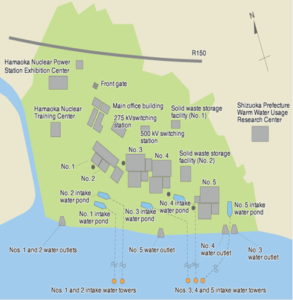
Figure 2‑1: Diagram of Hamaoka Nuclear Power Plant[6]
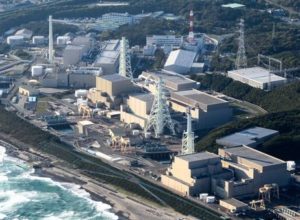
Figure 2‑2: Aerial Photo of the Hamaoka Nuclear Power Plant[7]
We assume that no transport casks are on site at the Hamaoka complex, as fuel is not being transported off-site (but this assumption should be confirmed). The article “Chubu Electric applies with NRA to build dry storage facility at Hamaoka nuclear plant”,[8] suggests that the utility owner of the Hamaoka plants has applied to build a dry-cask storage facility with a capacity of 400 tonnes of spent fuel (assumed to be tHM), which would start operating as of fiscal 2018. An older reference[9] suggests an earlier start date (2016) and a larger size (700 tonnes of uranium, or tU) for this facility—apparently the design was downsized to meet stricter earthquake resistance standards. Either size facility will be full in less than 10 years if all three Hamaoka units operate as above and the spent fuel pools are operated at a relatively steady state of fuel placement and removal, even if the pools remain dense-packed (and will be full even more quickly if they are not), so we assume that the dry-cask storage facilities, when and if they are built, will be able to expand to accommodate additional casks as needed.
The combination of the assumptions regarding reactor loading/unloading and spent fuel management listed above yields the Cs-137 inventories shown in Figure 2‑3. Here, radioactivity in the reactor core builds up after refueling until the next refueling cycle (the area shown in red), while the radioactivity in the spent fuel pool, as well as in the combined reactor and spent fuel pool for each reactor, remains at close to the same level over time as the pool is essentially full (assuming dense packing) at an inventory of about 1200 PBq (petabecquerel, or 1015 becquerels, a measure of radioactivity) even after restart, rising very slightly over time as fresher spent fuel replaces older spent fuel. We assume that cooled fuel begins to be removed for dry storage either at or near the nuclear power plant complex as soon as the first refueling following reactor restart, given the need to provide space in the pool for subsequent spent fuel off-loadings. We assume that on average, spent fuel is kept in pools for 15 years after discharge before transfer to dry casks (or other storage), which is somewhat longer than the “at least 10” years described in a recent document.[10]
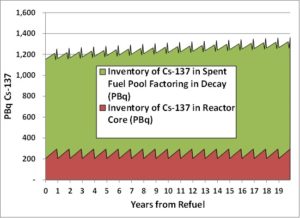
Figure 2‑3: Cs-137 Inventory in One Hamaoka Reactor Core and Spent Fuel Pool as Modeled (Unit #3 shown, Unit #4 would be similar)
1.2 Incident Modeling Assumptions
We consider three main scenarios for incidents involving the Hamaoka reactors and spent fuel pools. For the first scenario, which we call “Worst-case Reactor Incident” (or “S1”), one of the reactors (unit #3 or 4) is assumed to suffer a core breach and subsequent loss of coolant due to an extreme seismic event or attack. In this case, the spent fuel pool or pools may or may not suffer a loss of coolant, either through being breached by the same event or by losing cooling capacity when utilities (power and/or water) are lost as a result of the incident, but because cooling is assumed to be restored to the pool(s), the spent fuel in the pool(s) is able to be cooled sufficiently that a zirconium cladding fire does NOT ensue. We assume, in S1, that even though Hamaoka units #3 and 4 are not significantly physically separated, even if the second reactor core also suffers damage, emergency cooling can be maintained for the second reactor due to the installation of post-Fukushima redundant safety measures. This scenario therefore does not include common mode failures–such as the interruption of pumping and water utilities affecting both units, coupled with radiation or other conditions that prevent emergency cooling measures from being undertaken.
For the second scenario, which we call “Worst-case Spent Fuel Pool Incident” (or “S2”),we assume that as a result of a seismic event, catastrophic operational accident (such as dropping a transport cask into the pool), or terrorist attack, the pool in Unit #3 suffers a coolant loss and cooling cannot be restored before cooling water mostly or completely evaporates. Further, those regions of the stored spent fuel that have most recently (within the past few months) been off-loaded from the two reactors are assumed to reach temperatures high enough for cladding failure and ignition, resulting in a zirconium fire that engulfs an amount of spent fuel equal to the most recent off-loading.
For the third scenario, which we call “Worst Case Reactor and Spent Fuel Pool Incident” (or “S3”), we assume that one of the spent fuel pools and one of the reactors (probably for the same unit) are compromised to the extent that the reactor suffers a meltdown as in S1 and the spent fuel pool suffers a pool fire as in S2. This combination of circumstances could come as a result of an accident or attack that breaches reactor containment and the spent fuel pool at the same time, or damages to a unit’s reactor or pool, causing common-mode failures in cooling utilities (electricity for pumps and/or water supplies), that cannot be rectified in time to prevent the failure of the unit’s pool and reactor.
The “Participation Fraction” (“PART FRAC”) of the material in the spent fuel pool, which describes how much of the material in the spent fuel pool is affected by an incident, is assumed to be a function of the density of racking in the pool. We assume that the racking continues to be high-density in all scenarios. In S1 we assume that even if the incident focused on the reactor does cause a loss of coolant in the spent fuel pool, restored or emergency cooling happens rapidly enough that the cladding does not reach ignition temperature, and thus the Participation Fraction for the spent fuel pool in S1 is 0, and the release fraction is similarly 0.
In S2 and S3, however, we assume that the full complement of fuel in the pool, which at the time of an incident for reactor #3 occurring 3 years after restart (for example) is 376.98 tHM, and for reactor #4 is a similar 361.79 tHM, does participate in a pool fire. The Participation Fraction for the spent fuel pool in scenarios 2 and 3 for reactor #3 or #4 would therefore be 1.00. In these scenarios involving cladding failure and significant Cs-137 emissions (S2 and S3), a release fraction of 0.3 is assumed. Spent fuel in the other spent fuel pools is assumed to suffer no damage in the incident under any scenarios, and thus its participation and release fractions are both assumed to be zero.
For one of the reactors, for S1, we assume that it experiences a core melt, and thus its participation fraction is 1.00, though the participation fraction for the second reactor is assumed to be zero, and the release fraction is similarly zero.
Based on consideration of Table II.3-7 in the Radiological Risk Analysis Handbook prepared by Gordon Thompson,[11] as well as estimates of fraction of the Cs-137 inventory in the Fukushima reactor cores that were released to the atmosphere[12], we assume a release fraction of 0.05 for one of the reactors for S1 and S3, which assumes an incident that would both breach containment and the reactor vessel, and severely damage the reactor and the fuel within.
For both of the reactors, for S2, we assume that the incident involving one of the spent fuel pools does not affect the reactors enough to cause a core melt (or emergency procedures are sufficient to prevent a core melt if the reactors is damaged), and thus the participation fraction for both reactors is by definition zero. The release fraction (“REL FRAC”) for S2 for the reactors is similarly assumed to be zero, since neither reactor is assumed to undergo a core melt.
In all three scenarios, though dry casks or transport casks may be present at the time of the incident (and dry casks, at least, may well be), we assume that the casks will be sufficiently distant from the reactor and spent fuel pool and/or sufficiently robust that their participation and release fractions are all zero. As with the Chinese reactors considered in other Nautilus analyses,[13] a possible exceptional case might be if the incident (accident or attack) occurs during the period when dry casks are being loaded, in which case, depending on where they are physically located near the spent fuel pool and how much fuel is in them at the time of the incident, there could be additional complications.
The spent fuel placed in transport casks, however, has been cooled for several years, and is thus likely to be passively cooled if coolant is lost. The spent fuel in a not-yet-closed transport cask might be vulnerable to terrorist attack with an incendiary device that would ignite the cladding in the spent fuel in the cask, but this eventuality is not explicitly considered in our scenarios.
We assume an average wind speed of 10 miles per hour, or 4.5 meters/second, based very roughly on considerations of recent annual windspeed values for the summer, when prevailing winds are mostly from the Southwest (or SSW) to Northeast (or ENE) at Omaezaki, which is along the coast and within a few miles of the Hamaoka Plant. Tokyo and nearby cities are North and East of Hamaoka.[14] Except for the months of September and October, dominant winds in the area are generally West to East. We use a deposition velocity (“DEP VEL”) of 1 cm/second, or 0.01 meter/second, which is a typical value used with the wedge model.
1.3 Nearby Populations
The Hamaoka nuclear station is located on a promontory on the southern coastline of relatively lightly-populated Shizoka Province. We assume a prevailing wind at the time of the incident from the southwest, which is common in the area during the summer, though a wind from west to east is more common over the entire year. A plume headed northeast from Hamaoka would pass over Suruga Bay and the northern part of the fairly lightly-populated Izu Peninsula before encountering the major population centers—Fujisawa and multi-million-resident Yokohama and Tokyo—starting at about 150 km from the plants.
An annual average “wind rose” for the Omaezaki area is shown in Figure 2‑4, along with the direction of the prevailing winds in each month in the area. Note that the wind rose indicates the average fraction of the time that the wind is blowing from a particular direction, while the arrows in the table at the top of Figure 2‑4 point in the direction that prevailing winds most typically blow. Winds in the vicinity of Hamaoka blow from the southwest and west-southwest—that is, in the direction of Tokyo and nearby cities—about 20 percent of the time over an entire year. In particular months the frequency of winds toward Tokyo deviate substantially from the annual average. In July and August, for example, winds blow from the southwest and west-southwest on the order of 40 percent of the time, whereas in December and January prevailing winds have only few percent probability of blowing in that direction.

Figure 2‑4: Monthly and Annual Wind Direction Data for Omaezaki (Hamaoka area; from Windfinder.com)
Figure 2‑5 shows a map of the area overlaid with trajectories for emissions clouds traveling in the wind direction modeled, assuming a wedge angle of about 0.25 radians.[15] It should be emphasized that the wind direction used in this modeling effort, though not improbable, particularly in the summer, based on wind data for the area, represents a worst case for impacts on human populations. A plume that takes a more southerly track, consistent with the wind directions dominant in the late fall, winter, and spring, or a plume heading west-southwest, consistent with dominant winds in September and October, would miss most heavily inhabited areas, with Cs-137 deposited mostly into the sea. Perhaps 50 percent of the time in a given year, a plume originating at Hamaoka would be directed by prevailing winds largely over the ocean, and another 30 percent of the time, a plume would be directed over land areas that are generally less inhabited but by no means exclusively so; about 10 percent of the time, winds from Hamaoka are blowing to the west or west-northwest, in the directions of Nagoya, which is closer to Hamaoka than Yokohama, and of Osaka and Kyoto, which are only slightly further from the Hamaoka area than is Tokyo, Another complicating factor is that winds may shift in the middle of an incident, as they did during the Fukushima accident, potentially rendering deposition and exposure patterns much more complex. These second order meteorological effects are not simulated here.
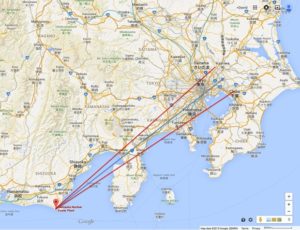
Figure 2‑5: Google Earth Image of the Hamaoka-to-Tokyo Area with Assumed Directions of Emissions Plume
It is important, however, to consider the worst outcomes in a plausible manner. In the case of Fukushima, then Prime Minister Kan Naoto requested a briefing on the worst-case from the Japan Atomic Energy Commission. This was presented to him on March 23, 2015, twelve days after the catastrophe. According to Kan, he was told that he might have to order the eventual evacuation of up to 50 million people in a radius of 250 km from the reactor and spent fuel ponds.[16] The plan was prepared by Shunsuke Kondo, chairman of the Japan Atomic Energy Commission.[17]
Ironically, at almost the same time as the internal Japanese analysis was under preparation, a US expert team at Lawrence Livermore on began shortly after the Fukushima accident to discuss and prepare an analysis of a worst-case release from Fukushima combined with worst-case historical data for winds blowing towards Tokyo from the reactor location for long periods. Over distances of hundreds of miles, modeling of atmospheric dispersion and plume “wander” led to the conclusion that large-scale evacuation (including of US military forces and their families located in the area) would not have been warranted. However, the US expert analysis was not completed until the end of March, at which time the results were sent to the US military by US presidential science advisor, John Holdren. He reportedly wrote on April 1, 2011: “Only with big releases from the spent-fuel pools, combined with even more perverse weather than [the scientists deemed realistic], could the [guidelines] be crossed in Tokyo, and even then, according to the modeling to date, not by much,” so “even in these extreme circumstances, sheltering in place might be all you’d want to do.”[18]
In the following analysis, we do not attempt to conduct a plausibility test of a straight line plume threat from the three release scenarios as posed in Figure 2‑5, above.
1.4 Modeling Results
Table 2‑1summarizes the atmospheric releases of Cs-137 in each of the three scenarios evaluated for incidents occurring at various time intervals after Hamaoka reactor restarts, which is used as the start time for modeling of an incident involving a reactor and/or spent-fuel pool. Because the inventory of radioactivity in the reactor cores varies significantly over the refueling cycle, the total release in Scenario 1, which affects the reactor core, can change depending on when the incident occurs. This variation, however, is not explicitly shown in Table 2‑1 because the reactor is assumed to be refueled annually. The spent fuel pool inventories of Cs-137 for the Hamaoka reactors, as noted above, rises only slowly over time, as the pools start essentially full and are already dense-packed, with dense-packed operations assumed to continue through the modeling period, As cooled fuel is removed whenever new spent fuel is added to the pool, the variation of emissions of Cs-137 over time depends relatively little on when the release occurs for Scenarios 2 and 3.
Table 2‑1: Summary of Cs-137 Emissions Results from All Three Hamaoka Scenarios Based on Timing of Incident
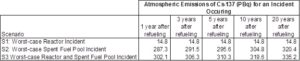
Figure 2‑6, Figure 2‑7, and Figure 2‑8, respectively, show the estimated ground contamination from a radiological release incident at Hamaoka unit #3 or #4 Scenario 1 (reactor incident), Scenario 2 (spent fuel pool incident), and Scenario 3 (reactor and spent fuel pool incident). Because so much of the inventory of the dense-racked spent fuel pools are assumed to be involved in a pool factor, and thus released, in Scenarios 2 and 3, the resulting ground contamination for those scenarios is on the order of 30 times as high as that estimated for Scenario 1. None of the scenarios show significant variation of ground contamination for incidents that happen later in time, as the spent fuel pools are essentially full at the start of the modeling period.
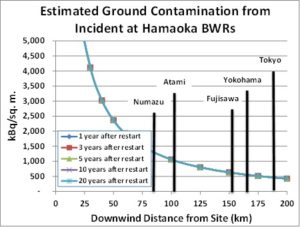
Figure 2‑6: Estimated Ground Contamination from a Radiological Release Incident at Hamaoka Unit #3 or #4 Involving the Reactor Core (Scenario 1)[19]
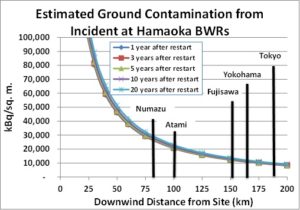
Figure 2‑7: Estimated Ground Contamination from a Radiological Release Incident at Hamaoka Unit #3 or #4 Involving the Spent Fuel Pool (Scenario 2)
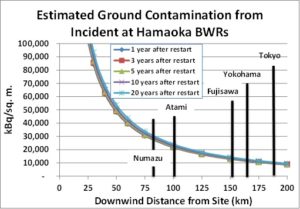
Figure 2‑8: Estimated Ground Contamination from a Radiological Release Incident at Hamaoka Unit #3 or #4 Involving the Reactor and Spent Fuel Pool (Scenario 3)
Figure 2‑9, Figure 2‑9, and Figure 2‑11 show the estimated first-year dose of radiation for a person at various distances from the Hamaoka reactors for incidents involving releases of Cs-137 from a reactor core and a spent fuel pool, respectively. Because a radiological release carried by winds toward the northeast away from Hamaoka would be carried over the ocean for 60 km or more before reaching significant populations, the first-year dose estimated based on scenario 1 for one of the reactors falls well below the USEPA recommended first-year threshold dose of 20 mSv (millisieverts, a measure of radioactive dose received) in both the small and major cities in the area. For Scenario 2 and 3, the involvement of a spent fuel pool in Cs-137 releases means that the modeled area with a first year dose of over 20 mSv is very large, with first-year dose ranging from about 50 to 60 mSv even at a distance of 200 km from the reactors. At that distance, for a prevailing wind blowing toward the northeast, the plume would intersect population sectors including Yokohama, Tokyo, and beyond.
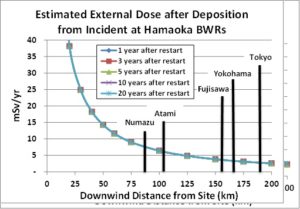
Figure 2‑9: First-year Estimated External Dose from a Radiological Release Incident at Hamaoka Unit #3 or #4 Involving the Reactor Core (Scenario 1)
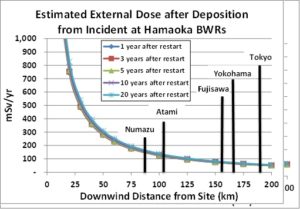
Figure 2‑10: First-year Estimated External Dose from a Radiological Release Incident at Hamaoka Unit #3 or #4 Involving the Spent Fuel Pool (Scenario 2)
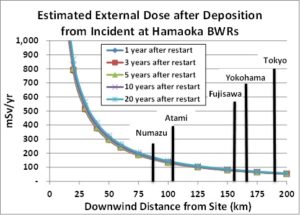
Figure 2‑11: First-year Estimated External Dose from a Radiological Release Incident at Hamaoka Unit #3 or #4 Involving the Reactor and Spent Fuel Pool (Scenario 3)

Figure 2‑12, Figure 2‑13, and Figure 2‑14 show the cumulative dose over time for exposures resulting from radiological release incidents involving one of the Hamaoka reactors (again, Unit #3 or Unit #4), one of the spent fuel pools, and a reactor and a spent fuel pool, respectively. For Scenario 1, exposure at the smaller population centers of Numazu and Atami exceed the USEPA’s cumulative 50 mSv 50-year dose guideline for an exposed individual, but exposure at the larger population centers of Fujisawa, Yokohama, and Tokyo would not. Cumulative doses under Scenarios 2 and 3, however, would exceed USEPA guidelines by a factor of 10 over a radius of 200 km, that is, past Tokyo. In all cases, releases were modeled as occurring 3 years after the restart of the reactors. For an incident occurring later (when spent fuel pools have slightly higher Cs-137 inventories), cumulative doses under Scenarios 2 and 3 are marginally higher than those shown below.
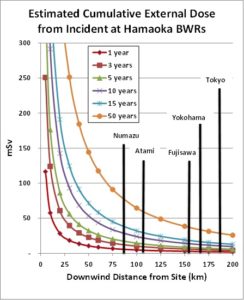
Figure 2‑12: Cumulative Estimated External Dose from a Radiological Release Incident at Hamaoka Unit #3 or #4 Involving the Reactor Core (Scenario 1)
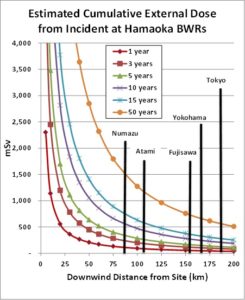
Figure 2‑13: Cumulative Estimated External Dose from a Radiological Release Incident at Hamaoka Unit #3 or #4 Involving the Spent Fuel Pool (Scenario 2)
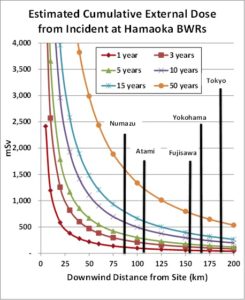
Figure 2‑14: Cumulative Estimated External Dose from a Radiological Release Incident at Hamaoka Unit #3 or #4 Involving the Reactor and Spent Fuel Pool (Scenario 3)
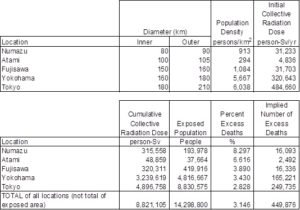
Table 2‑2 and Table 2‑3 present estimates of the number of premature deaths from cancers resulting from 50-year exposures associated with reactor and reactor/spent fuel pool incidents at Hamaoka reactors Units #3 or #4 (Scenarios 1 and 3). The assumed exposure time is 50 years. (Results for Scenario 2, an incident involving a spent fuel pool only, are not shown, but are just slightly lower than those shown for Scenario 3, since the release of radioactivity from the spent fuel pool dominates the Scenario). In Scenario 1, about 20,000 premature deaths in the communities included in this assessment result at rates ranging from about 0.4% in the community closest to the nuclear plants, to under 0.2% in the nearby big urban areas, including Yokohama and Tokyo. For the scenario postulating an incident involving a spent fuel pool and a reactor, the impacts are much greater, with about 450,000 premature deaths in the included communities, and rates of premature death of about 8% in the closest community and on the order of 3 to 4 percent in the big nearby cities.
Table 2‑2: Calculation of Collective Dose at Selected Locations along a Northeast Deposition Path from Hamaoka for a Release 3 Years after Reactor Restart Modeled for Scenario 1, Reactor Incident
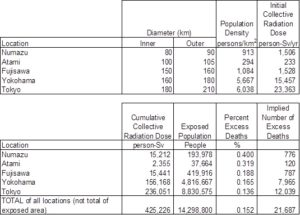
Table 2‑3: Calculation of Collective Dose at Selected Locations along Deposition Paths from Hamaoka Nuclear Power Plants for Release 3 Years after First Refueling Modeled for Scenario 3, Reactor and Spent Fuel Pool Incident
As with the other radiological exposure results presented in this report, we prepared rough estimates of damages related to premature human deaths based on two estimates of the “value of a statistical life” compiled in a review of a number of studies, and bracketing a range from $1.1 million to $10 million per person in 2012 dollars. Applying these estimates yields values in the range of $20 to $300 billion for an incident involving a Hamaoka reactor only, rising to perhaps $500 billion to $6 trillion for an incident involving a reactor and a spent fuel pool. Again, the vast bulk of the radiation release is from the spent fuel pool, and as in the Daya Bay and Ling’Ao plant estimates prepared by Nautilus, these totals do not factor in population areas that the plume of material released will encounter that are not included in the Tables above. Once more, the reader is urged to bear in mind uncertainties in this calculation caused by the combination of high-low dose response assumptions with high-low estimated values of excess deaths. In addition, if prevailing winds at the time of an incident resulting in radiological release are not blowing in the northeastern direction posited here, population exposures and damages would be different, and likely much lower, than indicated in the tables and figures above, essentially, all the way down to zero or near zero.
As noted above, if the prevailing wind direction at the time of a radiological release is to the east or to the west-southwest, which are also consistent with dominant winds near Hamaoka at different times of the year, the exposure versus distance data shown in Figure 2‑6 through Figure 2‑13 would still hold, but the exposed populations, collective dose, and excess deaths results shown in Table 2‑2 and Table 2‑3 would be much lower–on the order of a fraction of a percent to a few percent of that of a plume headed toward the Tokyo area. Moreover, conducting a more realistic analysis of wind patterns and “plume wander” over the full distance from Hamaoka to the Tokyo or other populations beyond a 30 or 40 km radius likely would also substantially reduce the immediate impacts from the releases envisioned in the three scenarios, although not necessarily the impact from long-run cumulative exposures.
A plume that headed toward the Nagoya or Osaka/Kyoto areas, which is consistent with wind directions during about 10 percent of the year, would cause somewhat lower aggregate exposures—perhaps a quarter to a half—of the exposures we estimate for a plume headed toward Tokyo. If the plume heads only over the ocean, with is consistent with winds that prevail about half of the time over the year, aggregate exposure could possibly be zero (except for the few people unfortunate enough to be on vessels in the path of the plume).[20] This range—from the results shown for a plume heading toward Tokyo to one that heads out to sea—represent the true uncertainty and unpredictability of such extreme events, the probability of which cannot be determined except to say that it is finite.
Although we have not performed the calculation explicitly, it is likely that the weighted averages of total exposures and excess deaths over the annual average of all wind directions in a year, taking into account all possible wind directions, probabilities, and exposed populations, would be on the order of 25 to 35 percent of the totals shown in Table 2‑2 and Table 2‑3.
The wind patterns in the Hamaoka area in this case provide a period of “natural protection” during which a non-state actor attack would be defeated, even in the worst release scenario, by wind directions, limiting the period for a successful attack that is likely to cause damaging exposure to significant populations to a relatively narrow period each year (mostly summer).
As noted above, this analysis is a first-order estimate only, taking into account only one wind direction at a time. As such, it does not, for example, include explicit modeling of a return of the plume from offshore when winds shift, directing radioactive aerosols back over Japan or over other landmasses or islands to potentially irradiate populations. The estimate provided in this analysis is therefore only a first order estimate of worst-, intermediate-, and best-case vulnerability of local populations to radiological releases caused by an accident at or attack on the Hamaoka nuclear plants.
III. ENDNOTES
[1] Papers and presentations forthcoming at https://nautilus.org/projects/by-name/vulnerability-to-terrorism-in-nuclear-spent-fuel-management/.
[2] Data from IAEA reactor database, available as http://www.iaea.org/PRIS/CountryStatistics/CountryDetails.aspx?current=JP, and from http://hamaoka.chuden.jp/english/about/facilities.html.
[3] Data from IAEA reactor database, ibid. Unit 5 was offline for much of 2009 and all of 2010.
[4] Data from Hiromi Yamazaki and Makoto Takahashi (2003), “Design and Construction of Hamaoka Unit 5, 1380MWe ABWR”, GENES4/ANP2003, September 15-19, 2003, available as https://www.ipen.br/biblioteca/cd/genes4/2003/papers/1007-final.pdf, and similar sources. Some sources suggest that enrichment of more recent fuel loadings in Hamaoka-3 and -4 have been higher than 3.0 percent.
[5] This is an analytical assumption on our part, but is very close to the historical weighted average capacity factor for all Japanese nuclear power plants from 1970 through 2010 (that is, pre-Fukushima), which was about 69 percent.
[6] Diagram of plant layout from http://hamaoka.chuden.jp/english/about/layout.html.
[7] Photo from Asahi Shimbun (2011) “Chubu Electric to halt reactors in line with Kan request”, dated May 7, 2011. A similar photo is includes in Asahi Shimbun (2017), “Governor states firm opposition to Hamaoka plant restart”, dated June 29, 2017, and available as http://www.asahi.com/ajw/articles/AJ201706290045.html
[8] Originally published by Mainichi, dated January 27, 2015, and available on Finance Greenwatch as http://financegreenwatch.org/?p=13835
[9] Presentation on Hamaoka Spent Fuel Storage facility included in proceedings of the January Institute of Nuclear Materials Management’s 28th Spent Fuel Management Seminar, held in Arlington, Virginia, from January 31 to February 2. Proceedings available with paid membership from http://www.inmm.org.
[10] From a 2014 reference document in Japanese, the title of which, loosely translated, is “For the Spent Fuel Dry Storage Facility”, available as http://www.chuden.co.jp/corporate/publicity/pub_release/press/__icsFiles/afieldfile/2014/07/31/140731.pdf.
[11] The radiological risk methodology and related tools were prepared for Nautilus by Dr. Gordon D. Thompson, and is available as Handbook to Support Assessment of Radiological Risk Arising From Management of Spent Nuclear Fuel, Nautilus Institute Special Report dated May 14, 2013, https://nautilus.org/napsnet/napsnet-special-reports/handbook-to-support-assessment-of-radiological-risk-arising-from-management-of-spent-nuclear-fuel/.
[12] See, for example, A. Stohl, P. Seibert, G. Wotawa, D. Arnold, J. F. Burkhart, S. Eckhardt, C. Tapia, A. Vargas, and T. J. Yasunari (2012), Xenon-133 and caesium-137 releases into the atmosphere from the Fukushima Dai-ichi nuclear power plant: determination of the source term, atmospheric dispersion, and deposition”, Atmospheric Chemistry and Physics, 12, 2313–2343, available as http://citeseerx.ist.psu.edu/viewdoc/download?doi=10.1.1.479.1143&rep=rep1&type=pdf; and and Yang-Hyun Koo, Yong-SikYang, and Kun-Woo Song (2014). “Radioactivity release from the Fukushima accident and its consequences: A review”, Progress in Nuclear Energy, Volume 74, July 2014, Pages 61-70 (abstract available at http://www.sciencedirect.com/science/article/pii/S0149197014000444).
[13] D. von Hippel et al (2016), in “Chapter 2, Radiological Risk from Accident/Attack on Nuclear Energy Facilities in East Asia” of the forthcoming Nautilus Institute Special Report After Fukushima: Radiological Risk from Non-State Diversion of or Attack on Spent Fuel presents (in section 2.3) analyses of the potential consequences of accident or attack at the Daya Bay and nearby Ling’Ao reactors in south China.
[14] From Windfinder.com (2015), “Wind Statistics: Omaezaki”, available as http://www.windfinder.com/windstatistics/omaezaki?fspot=honshu_omaezaki. Data shown in Figure 2‑4 are from observations taken between 5/2006 and 4/2015.
[15] Map adapted from Google Maps.
[16] “Ex-Japanese PM on How Fukushima Meltdown was Worse Than Chernobyl & Why He Now Opposes Nuclear Power,” Interview, Democracy Now, March 11, 2014, available at: http://www.democracynow.org/2014/3/11/ex_japanese_pm_on_how_fukushima.
[17] See, for example, “Government envisioned Tokyo evacuation in worst-case scenario,” The Asahi Shimbun, January 7, 2012; and Yoichi Funabashi (2012), “The End of Japanese Illusions”, New York Times, dated March 11, 2012, and available as http://www.nytimes.com/2012/03/12/opinion/the-end-of-japanese-illusions.html?mcubz=0.
[18] P. Blustein (2013), “Fukushima’s Worst-Case Scenarios, Much of what you’ve heard about the nuclear accident is wrong,” Slate, September 26, 2013, available at: http://www.slate.com/articles/health_and_science/science/2013/09/fukushima_disaster_new_information_about_worst_case_scenarios.html.
[19] Note that in this and subsequent figures of the same type, the vertical black lines are used simply to label the distance from the release incident to cities along the path of the plume. The relative heights of the vertical black lines has no significance in these figures—only the colored curves and data points indicate ground contamination.
[20] Even a plume directed only over the ocean does not rule out secondary sources of exposure and other impacts of the deposition of radioactivity resulting from an accident or attack, as there would almost certainly be impacts on fisheries and exposure related to humans and animals consuming marine products from the affected area. Such would be the case even for a plume that headed toward the Tokyo area, which would cross bays in several areas.
IV. NAUTILUS INVITES YOUR RESPONSE
The Nautilus Asia Peace and Security Network invites your responses to this report. Please send responses to: nautilus@nautilus.org. Responses will be considered for redistribution to the network only if they include the author’s name, affiliation, and explicit consent