
JAY GIRI
SEPTEMBER 29, 2020
I. INTRODUCTION
In this Special Report, Jay Giri describes the technical aspects of integrating electrical grids across utility and national boundaries, including the data exchanges required between the utilities and transmission companies that operate the elements of the integrated grids. Some of the potential short- and longer-term impacts of the COVID-19 pandemic on grid organization, operation, and integration are also noted.
A summary of this report follows. A downloadable PDF file of the full report is here.
Jay Giri is an Independent Consultant with GGM Consulting – a sole proprietorship.
This report was produced for the Regional Energy Security (RES) Project funded by the John D. and Catherine T. MacArthur Foundation and presented at the RES Working Group Meeting, Tuushin Best Western Premier Hotel, Ulaanbaatar, Mongolia, December 9-11, 2019.
The views expressed in this report do not necessarily reflect the official policy or position of the Nautilus Institute. Readers should note that Nautilus seeks a diversity of views and opinions on significant topics in order to identify common ground.
This report is published under a 4.0 International Creative Commons License the terms of which are found here.
Banner image: Potential organization of national EMS and WAMS-R in an interconnected Northeast Asian grid. Source: GGM Consulting.
II. NAPSNET SPECIAL REPORT BY JAY GIRI
DATA AND MODELING EXCHANGE REQUIREMENTS FOR DESIGN AND OPERATION OF ELECTRICITY GRID INTERCONNECTION
JAY GIRI
SEPTEMBER 29, 2020
Summary
The primary focus of this document is power grid data exchange between utilities and countries.
Large electric grid interconnections consist of many individual electric utilities. Each utility’s primary responsibility is to manage its portion of the grid. A utility is typically connected to many other utilities in the interconnection.
Actions taken within one’s own utility influence neighbors. Hence it is vitally important to coordinate grid management actions and share data with neighbors, since they could be inadvertently affected.
The types of data exchanged include planning models of their grid that describe the current and future grid topology – the transmission network model. This exchange is typically annually, or on demand as necessary. They also include real-time data exchange of current transmission system conditions, such as voltages and power flows at major locations across their grid.
Utilities have a centralized command control center (control center) for real time grid management. The mission of the control center is to manage the utility’s portion of the grid, around the clock, to ensure demand is met and equipment is operating within safe limits. These control centers continually monitor real-time grid conditions to assess status, potential threats and vulnerabilities. Control enter operators take actions as needed to preserve the stability and integrity of the grid. The goal is to ensure that the lights always stay on, for all customers, around the clock.
Control centers primarily consist of a hardware and software platform called an Energy Management System (EMS). These vary in complexity, capability and functionality, based on the size of the utility and other operating requirements. These centers typically share real-time data with neighboring control centers.
Today, uncertainties in the grid are rapidly increasing due to the growth of less predictable renewable generation resources, demand response programs (active customer participation), distributed generation, microgrids, potential cyber-security issues, and unexpected failures in the aging grid infrastructure and its protection systems. These uncertainties pose additional grid management challenges; and problems in one part of the grid can cascade and affect the rest of the grid.
It is therefore of much greater importance today to have utilities cooperate with each other by sharing real-time information to work jointly as a single team toward the common goal of preserving the integrity of the entire electrical interconnection.
This paper describes the electricity supply chain, grid stability and operating characteristics, real-time grid management, control center EMS functions and inter-utility data exchanges. It describes the benefits and challenges of multi-utility and multi-country grid management and provides practical examples of utilities and countries working together. It specifically addresses modeling and data exchange for international inter-utility operation.
Finally, it suggests an innovative solution for more effective inter-utility/country grid operations that holistically improves real-time management of the entire interconnection.
1 Overview
The primary purpose of this document is to describe the exchange of power grid data between neighboring electric utilities and countries, with a specific focus on the countries of the Far East Asia region. The different types of grid data exchanges are described, along with the challenges and steps to accomplish the exchange and the potential accrued benefits.
1.1 Background
In 1881, Thomas Edison created the first electric power company in New York City to generate power and supply it to customers. Power then was transmitted as direct current (DC) via what we today term a “micro-grid”: a small, self-contained system of generation, transmission, and consumption. By the 1930s, power transmission had evolved to alternating current (AC) systems. Over time, these power companies started connecting with their neighbors for support during emergencies and to benefit from cheaper power from nearby areas. This eventually led to the large electrical interconnections of today, which consist of many individual power companies.
Today, the modern power grid is typically a large electrical interconnection. It is one of the most complex real-time engineering machines in existence. Millions of components comprise the electricity supply chain, from generation to the end consumer. All components must work reliably, 24-hours-a-day, seven-days-a-week.
Grid conditions are continually changing. Changes in electricity demand necessitate instantaneous changes in electricity production, since electricity cannot be stored easily. Consequently, voltages, currents, and power flows in lines, transformers and generators are constantly changing, second-by-second, around the clock. The challenge is to ensure that these changing power system operating conditions always stay within safe limits.
In 2000, the U.S. National Academy of Engineers (NAE) selected Electrification as the “most significant engineering achievement of the last century.”
1.2 Summary of Topics
This paper focuses primarily on the high voltage transmission grid. It addresses the following topics:
- The Electricity Supply Chain
- Maintaining Grid Stability
- Real-time Transmission Grid Management
- Control Center EMS functions
- Real-time Grid Management Software products
- EMS Data Modeling
- Multi-Utility Real-time Data Exchanges
- A Practical Example of Multi-Utility Grid Coordination
- A Practical Example of Multi-Country Grid Coordination
- Proposed Innovative Solution for Far East Asia, Multi-Country Grid Management
Appendices to this paper provide:
- An introduction to the use of synchrophasors for innovative grid managements;
- Examples of additional multi-country grid interconnections;
- Types of data exchange between control centers; and
- Communication protocols for data exchanges.
2 The Electricity Supply Chain
The electricity supply chain consists of:
- Generation
- Transmission
- Distribution
- Customer Loads
Figure 1: The Electricity Supply Chain
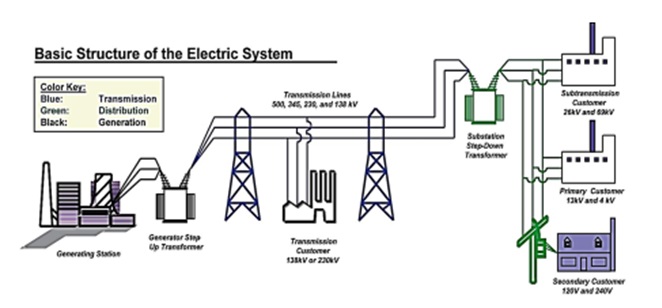
Source: US Federal Energy Regulatory Commission, US Department of Energy, Office of Electricity Delivery and Energy Reliability.
Figure 1 is a simple illustration of the electricity supply chain.
The generation system produces alternating current (AC) power at a relatively low voltage and high current. This voltage is increased (and current decreased) using transformers in order to efficiently transfer power over long distances (as transmission losses are proportional to current squared). The high voltage system is called the transmission system or transmission grid. The transmission voltages are reduced, again using transformers, at or near customer locations, and the low voltage distribution grid supplies power to the end-user or customer loads at safe voltage levels—typically hundreds of volts for residential and smaller commercial consumers, up to thousands of volts for large commercial and industrial consumers.
Facilities that generate electricity are typically, but not always, in remote locations. The supply chain normally covers a vast geographical area and can consist of millions of pieces of equipment working together to provide customers with electricity 24/7/365, around the clock. It is one of the most complex real-time engineering machines in existence today!
2.1 Benefits of Electric Interconnections
Large electrical grid interconnections have evolved over time by physically and electrically connecting power grids with their neighbors.
The primary objectives of interconnecting with neighbors are:
- Reduce customer costs:
- Share economical generation with each other
- Reduce the need for maintaining additional reserve capacity online
- Improve grid reliability:
- Provide backup support to each other during system emergencies
3 Maintaining grid stability
Maintaining grid stability means: “Operating the interconnected grid at close to normal frequency, with all equipment within limits, and without unexpected disconnections of load or generation” – it means ensuring grid reliability. This is called ‘normal synchronous operation’.
Systems conditions are continually changing across the grid, since generation is constantly following demand to ensure system frequency stays normal. In addition to second-by-second changes in customer demand, events such as lightning strikes, short circuits, equipment failure, and accidents also disrupt flow in the electricity supply chain. Unfortunately, electricity cannot be intentionally routed along a preferred transmission path; it follows the path of least electrical resistance, as dictated by the laws of physics.
Figure 2: Grid Operating States
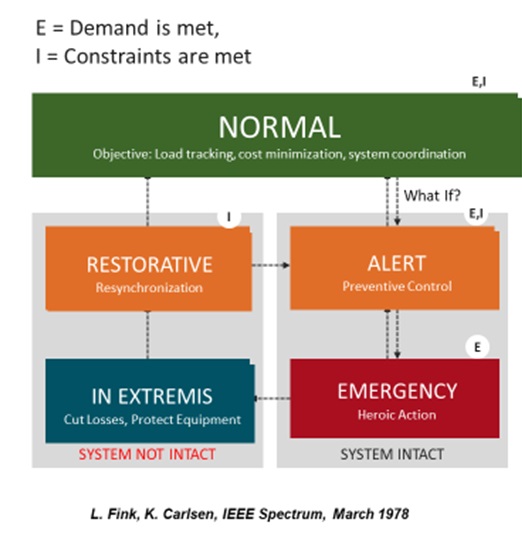
Figure 2 shows the various operating states of the grid. Here ‘E’ means demand is being met. ‘I’ means all equipment in the supply chain are being operated within safe limits.
The goal is to ensure the grid is always in the Normal state, where E and I are met. During this state there will continue to be small oscillations caused by load and generator changes. These oscillations are typically not a problem since they automatically damp out. The grid typically operates in this state for over 99% of the time.
The Alert state is when a potential ‘what if?’ contingency will create overloads or other problems. Emergency is when demand is met but some equipment is overloaded. In Extremis is when load has been shed (demand is not met in one or more areas) and equipment is overloaded. Restorative is when demand is not being met but equipment is back within limits.
When the grid is not in the Normal state, the goal of the grid operator is to bring it back to Normal as soon as possible.
Grid stability constraints include:
- Steady State Stability limits
- Overload on equipment such as lines and transformers
- Voltage Stability limits
- Off-normal voltages which may cause local grid collapse
- Transient Stability limits
- Loss of generator synchronism due to faults
- Small Signal Stability limits
- Undamped grid oscillations that may trip equipment
The objectives of maintaining grid stability include tolerating disturbances, returning equipment to safe limits following a disturbance, and most importantly avoiding wide-spread cascading failures. The different types of disturbances are described below.
3.1 Loss of Generation or Load
Loss of a major generator or load results in an immediate generation-load imbalance that affects system frequency.
3.1.1 Loss of Generation
Figure 3: Frequency Behavior after Generation Loss
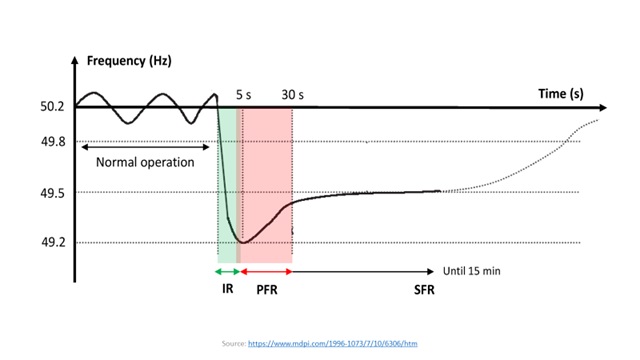
Figure 3 shows the grid system frequency behavior following the loss of a major generator. The time frames of the dynamic frequency response after the sudden loss of a generator are:
- Instantaneous to few seconds (IR):
- There is an immediate ‘inertial response’ IR that causes frequency to drop at a certain rate of decline – called ROCOF or rate of change of frequency. This rate depends on characteristics of generation online and grid topology.
- Few seconds to tens of seconds (PR):
- Primary frequency response (PFR) arrests the frequency drop and stabilizes it to a nadir.
- This is generator governor action designed to automatically change output based on frequency deviation – also called the ‘governor droop’.
- The magnitude of the nadir is a function of total system inertia – or the sum of the rotational inertias of all online generating resources.
- If the nadir deviation is large, equipment will trip since they are designed to operate close to normal frequency.
- Primary frequency response (PFR) arrests the frequency drop and stabilizes it to a nadir.
- Tens of seconds to minutes (SR):
- After the primary frequency response, ‘secondary response’ SR gradually increases generation to bring frequency back to normal.
- This is done manually by the operator or by software such as automatic generation control (AGC).
3.1.2 Loss of Load
Loss of load results in exactly the opposite frequency behavior compared to loss of generation – frequency goes up instead of down. Frequency goes up at certain ROCOF due to IR, stabilizes at a zenith due to PFR, and SR brings frequency back to normal.
3.2 Loss of a Transmission Line
Loss of a major transmission line does not affect system frequency since it does not create a generation-load imbalance. It may cause a frequency oscillation that typically subsides. However, it does change the topology of the grid, and electricity needs to be re-routed within milliseconds along alternate electrical paths. This re-routing could overload other lines or power system equipment, which may cause further equipment trips.
3.3 Grid Operating Challenges Today
It is becoming more and more difficult to operate the power system in a stable and reliable manner. Some of the issues include:
- Unexpected adverse weather conditions – some caused by climate change – including severe storms, extreme hot, cold, or windy weather, and wildfires.
- Uncertainties in the lower voltage distribution systems
- Customer load management systems (demand response programs)
- Distributed generation resources
- Growth of intermittent renewable generation resources that cannot be easily predicted or controlled
- Predominantly in the lower voltage distribution system, and less in the high voltage transmission system.
- Electricity market systems in some grids
- Market participants utilize grid capacity, often without oversight of the grid operator.
- Unilateral decisions by generation companies that operate independently, without oversight of the grid operator.
- Faulty operator decisions caused by uncertainties in the network model, erroneous load forecasts, and uncoordinated neighbors’ actions.
To handle these issues new technologies and techniques are being used to detect problems earlier, provide improved situational awareness, and to take prompt preventive and corrective actions.
3.4 Growth of Renewable Generation
Utilities today are deploying higher levels of renewables, primarily to provide more economical electricity and to help to mitigate climate change. The renewables are mostly wind and photo-voltaic (PV) solar, with some batteries now increasingly deployed to add storage capacity. They are DC systems connected to the AC grid by power electronic devices called inverters – they are also called Inverter Based Resources (IBRs). They are typically connected to the low voltage distribution grid.
As the proportions of renewables grow in the mix, they present additional challenges to maintaining grid reliability because of the following characteristics:
- Unpredictable
- Wind production is at the whim of changing weather patterns
- Solar is only available during the day and is affected by cloud cover.
- Uncontrollable
- Unlike traditional resources, the grid operator cannot control the renewables.
- Possess minimal rotational inertia
- Does not help arrest and stabilize the disturbance frequency nadir. Hence the nadir is larger and may trip equipment on low frequency protection.
- Produce low fault currents for short circuits at their terminals
- Existing protection systems may not be triggered by these low fault currents, which may result in further cascading equipment damage.
- May cause reverse power flows, from the low voltage distribution grid to the high voltage transmission grid.
Figure 4: Frequency response with a greater mix of renewables
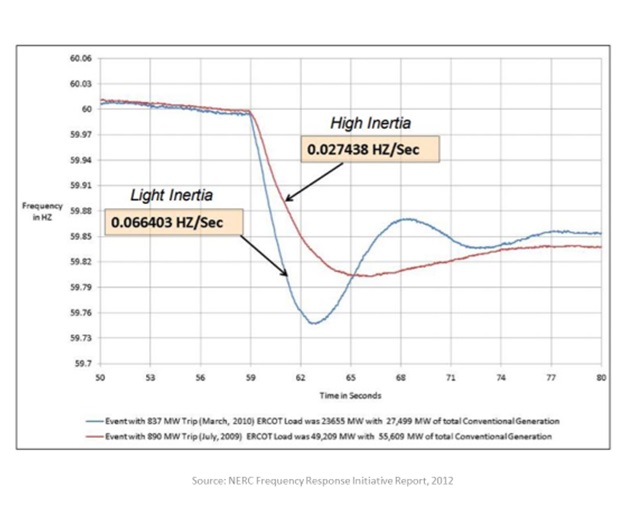
Figure 4 is an illustration of the impact of renewables on the frequency nadir. This is from the NERC report for actual events in the ERCOT Texas interconnection. What it shows is that when an event triggers a loss of frequency, a system with high inertia—that is, for example, with a lot of spinning hydroelectric, gas, or steam turbines—will show a gradual loss of frequency and a quick return to stable frequency, whereas a system with light inertia—for example, one with more wind and solar PV generation, will show a more rapid frequency decline, a larger frequency deviation and less damped return to a stable frequency.
Grid stability and reliability were originally designed in an era in which synchronous generators—coal, gas, hydro, and nuclear. They had large spinning masses and rotational inertia. Hence, they could arrest frequency better.
With more low-inertia renewables in the mix, frequency declines faster, and the nadir is larger; also, the subsequent dynamic response is more oscillatory and could cause unnecessary damage to equipment.
Existing grid protection schemes will need to be re-designed to recognize that renewables have low inertia, may cause reverse power flows and do not provide significant short circuit fault currents.
3.5 Challenges of High Penetration of Renewables
As the mix of renewables grows in the generation portfolio, real-time grid operation becomes more challenging. This is because of their operational characteristics: unpredictable production of electricity, low inertia, uncontrollable, no support during emergencies, problems to existing relay protection.
Renewables cannot be used for load following to fulfill the minute-by-minute requirement to adjust generation in response to load. They are not controlled by the grid operator and cannot always be relied on.
This problem is exacerbated if nuclear generation is also in the mix. Typically, nuclear plants are base loaded, and their output is held steady at a target level. Hence nuclear also cannot be used for load following.
Therefore, it is essential that the generation mix includes traditional fossil and hydro plants, and/or significant dispatchable electricity storage, since these are capable of minute-by-minute load following. If these are not sufficiently represented in the generation mix, load following will be compromised, and neighbors will be inadvertently forced to provide this support. This will cause problems with neighbors. This situation is occasionally happening in Germany where there has been an explosion of renewables deployment since Germany adopted a policy to pursue a phased decommissioning of all of their nuclear plants following the Fukushima accident in Japan.[1] As a result, Germany at many times ‘leans on its tie-lines’ with neighbors in order to satisfy their own native demand.
4 Real-time Grid Management
The objective of real-time grid management is to ensure safe, reliable, and optimal operation of the interconnected grid. It requires a vast infrastructure of hardware, protection and control equipment and advanced software tools. Control centers with Energy Management Systems (EMS) are one such solution.
Energy management is the process of monitoring, coordinating, and controlling generation and transmission systems to ensure reliable supply to customers. Generating plants produce and feed energy to the high-voltage transmission network. This network includes substations that perform switching, voltage transformation, measurement, and control. Substations at load centers lower voltage to distribution levels. These lower voltage distribution lines typically operate radially, that is, with no normally closed paths between substations. Underground cable networks in large cities are an exception. The goal is to maximize safety, minimize damage, and continue to supply load with the least inconvenience to customers.
Energy management is performed at control centers typically called system control centers, by computer systems called energy management systems (EMS).
The EMS control center is essentially the “nervous system of the power grid”. It constantly measures the pulse of the grid, adjusts its conditions, orchestrates its movements and provides defense against unexpected external events.
4.1 Control Center – Energy Management Systems
The first centralized control centers were established in the 1950s based on analog hard-wired technology.
Today, these control centers consist of a software and hardware system called an Energy Management System (EMS). Based on a centralized “command and control” paradigm, EMS have evolved over the past six decades into much larger and more complex systems. Nevertheless, they have the same simple mission as before: “Keep the lights on for all customers around the clock.”
The modern Energy Management System (EMS) based on digital computers was developed in the 1960s. Over the past five decades, EMS capabilities have continued to evolve. Today, most utilities have some type of EMS capability.
The EMS receives measurements from various substations in the grid every 2-4 seconds. These measurements include voltages of busbars, line and transformer flows (MW, MVAR) and frequency. These measurements do not have time tags and have unknown, variable latencies; they are also noisy and not always accurate.
The EMS applications were originally designed to handle these not-perfect measurement characteristics. The applications use these measurements to monitor and analyze the system conditions of the grid and display them to the grid operator.
Today’s grid management paradigm is basically reactive – the operator monitors and reacts to measurements of current conditions, in order to make decisions for the immediate future. It is like driving an automobile and making steering decisions by only looking at the dashboard. The driver is the grid operator who makes decisions to ensure the grid is secure, so that customers’ lights stay on. ‘Driving by dashboard’ becomes particularly challenging when the road ahead is not necessarily straight and flat. Today, the road is changing and becoming more challenging with the impact of increasing deployment of renewables, distributed generation and demand response programs.
The grid operator’s focus on situation awareness (SA) and implementing actions to ensure reliable and secure grid operation. SA is more comprehensively defined as “the perception of the elements in the environment within a volume of time and space, the comprehension of their meaning, and the projection of their status in the near future.” For grid operators, action means implementing changes to their own grid equipment, and working with neighbors to implement system-wide actions.
The specific EMS grid operator functions are:
- Monitor real-time conditions
- A continual round the clock activity
- Develop actionable information
- Identify disturbances and analyze alternative mitigation strategies
- Take corrective actions
- Implement a strategy to fix a problem
Figure 5: EMS Control Center Applications Overview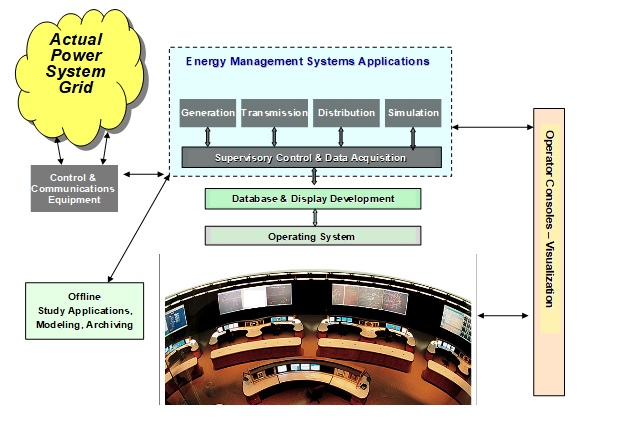
Source: GE Grid Solutions
Figure 5 shows the suite of real-time and off-line functions that comprise a modern control center.
4.2 EMS Subsystems
Figure 6 shows the major software sub-systems of an EMS.
Figure 6: Main EMS software subsystems
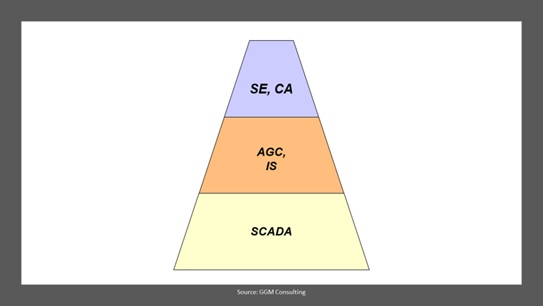
Source: GE Grid Solutions
These subsystem functions are complementary and related as follows:
- The SCADA system is the ‘eyes of the EMS’.
- SCADA is Supervisory Control and Data Acquisition.
- Runs typically, every 2-4 seconds
- Without SCADA, the EMS has no visibility of the grid.
- Provides an asynchronous, uncorrelated view of the grid
- Uses real-time measurements from remote terminal units (RTU) from locations across just your portion of the grid – generators, substations, loads
- AGC is the energy balance view and monitors generation-load imbalance.
- AGC is Automatic Generation Control.
- Runs typically, every 2-10 seconds.
- Automatically changes generation to maintain system frequency
- Ensures contracted tie-line flows are maintained
- IS allows neighbors to buy and sell power from each other.
- IS stands for Interchange Scheduling.
- Typically performed on demand, as and when needed.
- Contractually stipulate the magnitude of power and its duration
- AGC ensures that these contracts are followed in real-time
- SE uses SCADA data to provide a mathematically-correlated view of grid conditions.
- SE is State Estimator.
- Runs typically, every 30 seconds.
- SE provides a comprehensive assessment of conditions (voltages, line flows) at all substations, within your utility and portions of your neighboring grid.
- SE uses a mathematical model of the grid to estimate voltages and flows at all substations.
- Uses a ‘best fit estimate’ algorithm calculate conditions at all substations
- Fills in the blanks for substations that do not have SCADA measurements.
- CA performs ‘what if’ studies to determine potential vulnerabilities.
- CA is Contingency Analysis.
- Usually runs after every SE run,
- Uses SE as a starting point to perform a series of “what-if” studies.
- Processes a list of predefined contingencies to assess potential overloads or problems that might result.
- Contingencies are unplanned loss of key grid components; such as a transmission line, transformer, generator, load, or an entire substation.
- Grid operators consider CA a very important function.
- Operators usually have a screen dedicated to displaying these results,
- Sees what might be lurking in the immediate future
- Operators typically make decisions based on current conditions, and more importantly, what is on the immediate time horizon.
4.3 Offline Study Functions at the Control Center
In addition to the real-time functions at the EMS, offline non-real-time functions are used to study future hypothetical scenarios as well as to recreate past events. These studies include anticipated future peak load and low load conditions, to ensure that they can be successfully managed. They recreate a past disturbance to study alternatives that could have possibly been taken to prevent or mitigate the impact – and to develop better best practice procedures for the future.
The main study functions are:
- Study Power Flow (PF)
- Simulation of grid steady state behavior
- Operator Training Simulator (OTS)
- Simulation of grid steady state and dynamic behavior
4.3.1 Study Power Flow (SPF)
This software application calculates flows and voltages at all substations for a specific user-defined grid topology and generation and load pattern.
In 1968, the work of Glenn Stagg and Ahmed El-Abiad (described in their landmark book “Computer Methods in Power System Analysis”) became the standard reference for many in the power industry to develop software applications on the digital computer. Prior to this, engineers solved problems the brute force way on paper using matrix methods, or by using the Network Analyzer, an analog test bed that simulated a small-scale grid. With these approaches, it was very difficult to scale up to solve large scale grids, quickly study model and topology changes, or manipulate data, to study a variety of system scenarios. The digital computer solved this problem.
Computer simulation programs were developed to calculate flows on the electrical network for different generation and load patterns. These were called “load flow” or “power flow” programs. They are still used extensively in utility planning departments as well as control centers.
4.3.1.1 Planning studies with SPF
In the planning department (where the time horizon is a few years into the future) the typical study entails:
- Specify a day/year for the study
- For that study day:
- Specify the network model to represent known changes to the grid, such as new lines generators and other equipment.
- Specify the forecasted generation and load pattern
- Run an SPF solution to determine voltages and flows across the grid
- Identify problems, overloads and other adverse conditions
The studies are re-run numerous times for a variety of operating scenarios for different network topologies, generation mixes and load patterns.
This study could also be run for a past date, to recreate events, study alternative preventive and mitigation strategies, to learn from them and develop better future best practices.
4.3.1.2 Control Center Studies with SPF
Here the objective is to use current real-time conditions as a starting point to study alternative operating scenarios. The typical study involves:
- Initialize SPF with the current real-time SE solution
- Make modifications as needed:
- Change grid topology to simulate:
- Inclusion or removal of lines, generators, other equipment
- Such as for simulating incoming weather/storms that might render equipment unusable
- Change generation schedules to simulate:
- A sudden increase or decrease in output
- Such as when renewable generation starts or stops
- An unexpected loss of a generator
- A sudden increase or decrease in output
- Change load schedules to simulate
- A sudden change of load
- Such as customer demand response
- Shifting of load patterns
- Due to weather impacts or active customer engagement programs.
- Run an SPF to study impacts
- Identify problems, overloads and other adverse conditions
- Identify mitigation strategies
- A sudden change of load
- Inclusion or removal of lines, generators, other equipment
- Change grid topology to simulate:
4.3.2 Operator Training Simulator (OTS)
The OTS is a time simulation of grid conditions over a specific duration. It simulates the steady state (voltages and flows) and dynamic (frequency) behavior at specific time points (typically every 1-4 seconds) for the study period (typically a few hours), at all substations.
Training simulators were originally created as generic offline EMS emulation systems for introducing operators to the dynamic behavior of a power grid.
Today, they model actual power systems with reasonable fidelity and are integrated with the EMS to provide a ‘close to real-time response’ environment for operators to practice normal, every-day operating tasks and procedures, as well as to experience emergency operating situations. Scenarios can be created, saved, and reused. The various training activities are safely and conveniently practiced in an offline environment, with the simulator responding in close to real-time, just like the actual power system.
The OTS is also used to recreate past scenarios and to formulate future system restoration procedures. The OTS can also be used to evaluate the functionality and performance of new real-time EMS functions and for tuning AGC.
Since the 1970s, traditional EMS operator training simulators (OTS) in North America have employed a uniform system frequency dynamic model, meaning that all generating units in the interconnection have the same frequency and inter-unit oscillations are ignored. This dynamic model has served the purpose well, since the EMS operator ‘saw’ grid behavior at the slow 2-4 second SCADA measurement scan rate and their computer monitors only updated at the same rate. The OTS monitors only the quasi-steady-state behavior of the grid and not the fast dynamics. The fast dynamics, such as inter-unit oscillations, occur in between SCADA scans and are essentially invisible to the operator. The operator only sees the consequences of the fast dynamics. For example, if the fast dynamics cause a relay trip, the operator sees only the result of the trip, such as the consequential loss of a line, transformer, generator or other equipment.
Figure 7: Subsystems of the Operator Training Simulator (OTS)
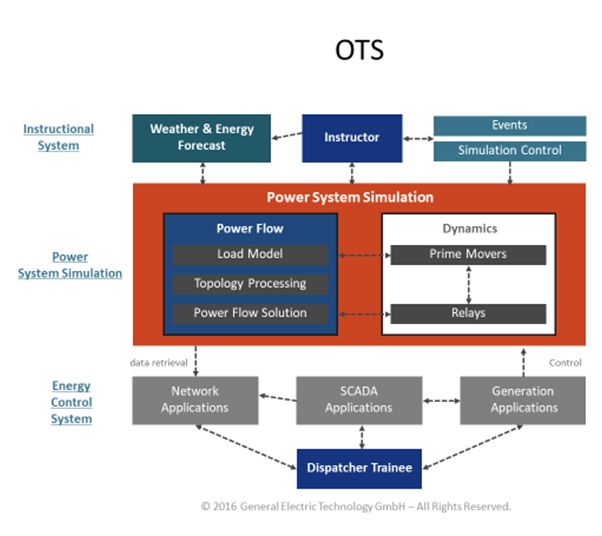
The OTS consists of three major subsystems as shown in Figure 7:
- Energy Control System
- Power System Simulation Applications
- Instructor Applications
A brief description of these subsystems follows.
4.3.2.1 Energy Control System (ECS)
The energy control system (ECS) emulates normal EMS functions. The trainee interacts only with the ECS. It consists of the EMS suite: SCADA, generation, network and other EMS functions.
4.3.2.2 Power System Simulation Applications
This subsystem simulates the behavior of the power system over time. Here frequency of all units is assumed to be the same, and faster inter-unit oscillations are not modeled. Prime-mover dynamics are represented by models of units, turbines, governors, boilers, and boiler auxiliaries. Network flows and states (bus voltages and angles, topology, transformer taps, etc.) are calculated at periodic intervals, typically every 4 seconds. Relays emulate the behavior of actual devices in the field.
4.3.2.3 Instructor Applications
This subsystem is used by the Instructor. It includes capabilities to start, stop, restart, and control the simulation. It also includes the ability to make save-cases, retrieve save-cases, reinitialize to a new time, and initialize to the current real-time situation.
It is also used to define events for the training scenario. Events can be in the power system simulation or the ECS. They may be deterministic (occur at a predefined time), conditional (based on a predefined set of power system conditions being met), or probabilistic (occur at random).
5 EMS Software vendors
The major vendors of comprehensive suite of EMS products are:
- ABB –
- GE –
- Siemens
- Open Systems International –
These EMS products consist of numerous real-time and offline real-time software applications, as well as the supporting hardware and communication infrastructure. They consist of millions of lines of code running in close to real-time, and a redundant hardware system that ensures 99.99% availability around the clock.
Typical EMS product prices range from a few hundred USD for SCADA systems for a small sized utility, to many millions of USD for a full suite of EMS functions for a large size Transmission System Organization. If customization of software is involved, the price increases. Some recent prices for very large customized systems have been in the 20-30 million USD range.
Other vendors provide sub-sets of EMS, and other specialized control center applications that are complementary and supplementary to traditional EMS capabilities. Some of them are:
- Schneider Electric
- Hitachi
- Toshiba
- ETAP
- OATI
- Incremental Systems
- WASP
- Powertech Labs
- Bigwood Systems
- Nexant
- EMS survey:
6 EMS grid Data modeling
The different types of grid equipment that are modeled in the EMS are:
- Transmission System:
Includes transmission lines, transformers, shunt capacitors and reactors, high-voltage dc (HVDC) transmission systems, etc. - Generating Units:
Includes the entire mix of supply resources – hydro, steam, gas, and nuclear, as well as wind and solar. - Loads:
Includes aggregated residential customer loads (which range from simple lightbulbs to appliance motors), to large factories and industrial infrastructures.
6.1 EMS Models – Network Topology and Equipment Parameters
The EMS model is a comprehensive representation of all the transmission grid equipment owned by the utility.
6.1.1 Network Topology
Figure 8: EMS node breaker model
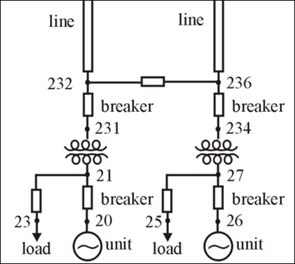
Source: M. Papic, Idaho Power
Figure 8 depicts how the network model is represented in the EMS. The model is a ‘node-breaker model’. Nodes are junctions of substation components. Breakers are circuit breakers which connect equipment, such as lines, transformers, generators and loads.
All substations are represented by node-breaker models to describe the complete interconnected topology of the grid.
In the Figure, the nodes are numbered 20, 21, 23, 232, etc. Circuit breakers are the symbols between nodes 231-232 and 20-21, etc. Circuit breakers are either open or closed. Transformers are the symbol between 21 and 231 (21 is at one voltage and 231 a different voltage). Generators and loads are symbols connected to node 21 and 23 respectively. Lines are connections between substations – such as connected to node 232 in this substation and another node at the other substation.
The EMS model topology is a collection of such node-breaker models for all of the substations.
6.1.2 Grid Equipment Model Parametric Data
Grid equipment are defined with specific models and specific model parameters – such as resistance, reactance and capacitance, etc.
Each piece of grid equipment is associated in the EMS with a steady-state model (frequency is close to normal) and a dynamic model (when frequency is off-normal).
6.1.2.1 Steady-state EMS Models
Grid equipment (transmission elements, generators, and loads) in the EMS are represented by steady-state models.
For transmission lines, transformers, and shunt capacitors/reactors, model development is accomplished by a calculation of the impedances, and documentation of name plate MVA capacity ratings. For generation, steady-state models represent real and reactive power (MW and MVAR) capability and remote voltage control buses. Loads are represented as constant real and reactive power; or constant current; or constant impedance; or some combination thereof.
These model parameters are calculated based on information from the original equipment manufacturers. The manufacturers also provide safe operating limits or ratings for each component – such as maximum allowable MVA capacity.
The individual component models are then combined into a complete system model for representing steady-state behavior of an entire interconnection. This model is known as the “power flow” model.
Power flow models of transmission systems represent only positive sequence quantities – which assumes a balanced 3-phase transmission grid.
6.2 Modeling Neighboring Utilities
Figure 9: Grid monitored regions
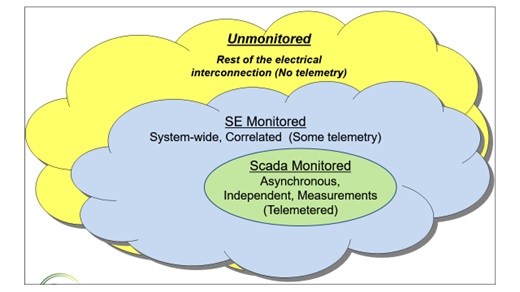
Source: GE Grid Solutions
Figure 9 illustrates the scope of SCADA and SE that provides the grid operator with a wide-area view of real-time conditions. SCADA monitors one’s own system. SE models one’s own transmission system as well some of the immediately neighboring systems (SCADA plus the neighboring SE Monitored region). This is because CA uses the SE results as its base case and its solutions are affected by the neighboring transmission system network. A contingency near the boundary results in re-routing of power through the neighbor’s system; this could potentially overload equipment in the EMS grid or the neighbor’s grid. These are EMS node-breaker models.
6.2.1 Reduced Network Equivalents
Figure 10: Modeling Neighbors’ Networks in the EMS
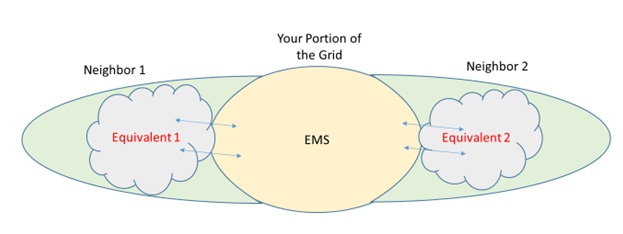
Source: GGM Consulting
Figure 10 provides an overview of how neighboring utility grids networks are modeled in one’s own EMS. The entire neighboring utility is not modeled, but just a reduced network equivalent which is immediately adjacent to the EMS utility. Remote parts of a large interconnection that are distant from the EMS are ignored. These equivalents include network topology and equipment parameter data.
Equivalents typically include substations with major loads and generation, major renewable resources plants.
Software tools are available to create a reduced network equivalent. A highly recommended product is:
Other network equivalencing websites include:
- https://pss-store.siemens.com/store/sipti/en_US/list/ThemeID.4816868000/categoryID.4844334200
- https://www.pterra.com/transmission-systems/network-equivalents-for-the-power-system-engineer/
- http://www.natf.net/docs/natf/documents/resources/planning-and-modeling/natf-ems-external-modeling-reference-document—open.pdf
6.3 Multi-Utility Data Exchanges
Electricity flow in an interconnected grid recognizes no utility or country borders. Hence it is very important to coordinate one’s own utility grid management operation with that of neighbors, since decisions one makes within their utility could inadvertently affect neighbors.
By increasing inter-utility cooperation and information exchange across the entire region, the holistic benefits to the overall interconnection are:
- Safer grid operation
- Improved reliability and security of supply
- Sharing of economic power, as and when needed
- Improved socio-economic welfare in the region
- Improved situational awareness across borders
6.3.1 Confidentiality of Data Exchanges
Utilities are typically hesitant to be totally transparent with their neighbors, in terms of data provision, since they might lose their competitive advantage. As a result of this hesitance, they typically share just a subset of their grid data based on mutual agreements, in order to help improve the neighbors’ real-time grid operations.
Typically, task forces are created, with all utilities involved, to discuss the kinds of data sharing that would be beneficial, and the rate (frequency) at which they should be shared. The objective is to help each other, so that one can manage their grids more effectively and securely – while being careful to protect confidential information.
A data sharing document is typically developed jointly, to articulate:
- Type of data to be shared,
- How often it should be shared?
- Why it is needed?
- Which applications will use the shared data?
- How applications’ results will be shared?
- A guarantee to preserve the confidentiality and intellectual property of the data
6.3.2 Barriers to Interconnections with Neighbors
Some utilities may not wish to connect with neighbors. The primary reason to avoid interconnections being to protect themselves from cascading failures that originate in the neighbor’s grid. On the other hand, without an interconnection they will not benefit from the neighbor’s support during their own emergencies.
Some of the barriers to building new connections with neighbors include:
- Financial
- It is very expensive to build high voltage transmission lines.
- Typical costs for a single circuit 138Kv line are about $1.5M per mile in the US.
- Will this cost be shared by neighbors?
- How do you justify the joint return on investment?
- What is the economic benefit to connect with neighbors?
- If a utility is ‘healthy and strong’ – meaning they always have enough generation and reserves to meet their own customer load – there is little incentive to connect with neighbors.
- How do you quantify the benefits of sharing economical generation with each other?
- How does one quantify the benefit of occasional ‘emergency support from neighbors’?
- Agreement on a process to negotiate the price of real-time energy exchange and more importantly the after the fact settlement process, especially if the contracted energy contract is not fulfilled.
- It is very expensive to build high voltage transmission lines.
- Political
- Utilities are hesitant to open the door to ‘visibility’ into their grid. A connection, however, does not automatically provide much insight into details of the neighbor’s real-time grid issues. The only insight provided is when the flow across the connection changes suddenly – this means generation or load in the neighbor’s system has suddenly changed.
- If a problem occurs in the interconnection how does one assign responsibility and accountability to the neighbor who caused it?
- Confidentiality
- Connecting with neighbors may be perceived as providing unnecessary transparency which could compromise their competitive edge.
6.3.2.1 How to address barriers to interconnection with neighbors
The way to address these barriers is a series of joint meetings of neighbors. Here financial, political and institutional concerns can be addressed. A mutually agreeable joint ‘grid code of operation’ needs to be developed, implemented and monitored for compliance.
Such an initiative will need to be championed at the very highest levels of government and utility leadership.
6.3.3 DC Links for Connecting Neighbors
One way to stay electrically connected and yet be ‘isolated’ from neighbors’ problems is to connect with a back to back DC link. This provides an AC to DC to AC connection.
The DC link is an asynchronous connection, has no DC line, and the entire link is contained within a single substation. It acts as a buffer between neighbors and AC grid problems are isolated to one’s own grid and not propagated to the neighbor. It is also used to connect AC systems that operate at different frequencies – such as 60Hz with 50Hz.
These have been in successful operation around the world for decades. The DC Link is, however, typically a very expensive solution, with costs in the hundreds of millions of dollars for gigawatt-sized systems.
6.4 Implementing Power Exchanges in Real-time
The primary purpose of interchanging power with a neighbor is to benefit from the availability of cheaper power. If one has less expensive generation (say, from renewables) they could offer to sell it to a neighbor to displace their more expensive generation.
6.4.1 Traditional EMS Interchange Scheduling
The process is initiated when a utility informs its neighbors that they wish to purchase or sell power. Neighbors then offer options on price and MW. Once two neighbors find a mutually beneficial exchange, they negotiate an agreement, and a contract is established that describes the power level (MW), price and duration of the exchange.
This bilateral contract is then implemented using the Interchange Scheduling or IS function in the EMSs of both neighbors. AGC in the EMS then automatically adjusts generation to ensure that this scheduled interchange is followed for the duration of the contract. In other words, at the start time of the contract, the selling neighbor’s AGC increases its own generation by the MW amount, and the buying neighbor decreases their generation by that same MW amount. At the end time, when the contract expires, AGC automatically reverts to normal operation.
6.4.2 Electricity Markets
In the past few decades, many interconnections have implemented wholesale electricity markets – also called Market Management Systems (MMS). MMS runs outside the traditional EMS. They have a software and hardware infrastructure like the EMS.
The process starts with market participants (generation owners) offering energy bids for the next day. The offers stipulate price, amount of MW and duration.
An MMS market clearing system receives bids from all market participants and uses a merit order system to sequentially select and add the least expensive blocks of power, to meet the next day’s forecasted load. The goal is to provide the lowest possible cost generation to customers.
The next day, the MMS automatically implements these participants’ bids into real-time management of the grid, by providing AGC with the bids as target MW outputs for each participant. AGC baseloads the participants’ generators to these targets.
Lowest costs are achieved when the market has many participants and spans a large portion of the interconnection. This means that out of all possible available resources, the most optimal, cost-effective generation is used to supply customers.
6.4.2.1 Customer-engaged loads – Demand Response
Today, market participants also include loads – called price responsive loads. These loads receive the real-time spot electricity price signal at their location. The spot price reflects the marginal cost of serving one additional unit of load at that location – also called locational marginal pricing or LMP. When the LMP is above a limit, the loads voluntarily automatically disconnect. This reduces the LMP. Once LMP drops below the limit, they reconnect again.
This is the basis of demand response programs or ‘customer engagement’ programs. They are typically large entities such as industrial plants, buildings, etc. Today. they also extend to homes and individual residential customers – or ‘behind the meter’ participants.
6.5 Microgrids – Decoupling from the Utility Grid
The past 125 years of electrification have resulted in larger and larger interconnections, with more and more utilities connecting with each other. Today, the trend today is reversing in a small way, since grid management is perceived as becoming less reliable, due to renewables and other uncertainties. Hence, there is a growth of microgrids whose owners wish to operate independently of the utility grid.
A microgrid is a regional grid, with a small geographical footprint, that has a load, generation (typically renewables) and some storage. They are typically at the lower distribution voltage level. Examples are universities, small cities, shipyards, etc.
The primary motivation is to be self-managed and independent of the utility grid. This results in more economical operating and customer delivery costs. More importantly, it protects them from cascading failures originating in the main grid – although they retain the option to connect to the grid when they need to during emergencies. Their goal is to operate independently, for most the time – except during their own emergencies.
Microgrids, however, come in a wide range of sizes and configurations, and the motivations for establishing a microgrid can also include lack of a stable electricity provider (or any at all) in a specific area or for a particular purpose. In some cases, microgrids will be linked up with a main grid as that grid grows (or may be connected to other microgrids through the main grid) to sell or buy power when price or other conditions render it desirable to do so. As such, the world of interactions between microgrids and main power grids is expanding in many places, adding another level of complexity to grid management.
7 EMS model and real-time data exchanges
The following types of data are exchanged between utilities:
- Network Topology Changes
- Annually: Planned or unplanned outages of major equipment in the next few months or years.
- As needed: When unplanned changes are made.
- Equivalent Network Model Data
- An equivalent representing a reduced subset of the network model. For example:
- Typically reported quite less frequently, such as when:
- Major grid changes are implemented
- Joint analytical studies are conducted
- Real-time Conditions at Major Substations
- Voltages and power flows on lines, transformers or generators.
- Typically exchanged on regular periodic basis – from every minute to hours to every day.
- Could be for just a few major substations whose status potentially affect neighbors’ networks.
8 Practical Example of multi-utility Data Exchanges – US PJM
The following is a description of PJM, a successful major multi-utility grid operation in the US. It serves 65 million people in 13 US states and the District of Columbia.
PJM (the Pennsylvania/New Jersey/Maryland grid in the Eastern United States) began in 1927 when three utilities, realizing the benefits and efficiencies possible by sharing their generating resources, formed the world’s first continuing power pool. These utilities connected to each other through high voltage transmission lines, creating an interconnection of resources. Interconnection is like a two-way street allowing those who are connected to the grid to share resources back and forth as needed.
Figure 11: PJM and its Member Utilities
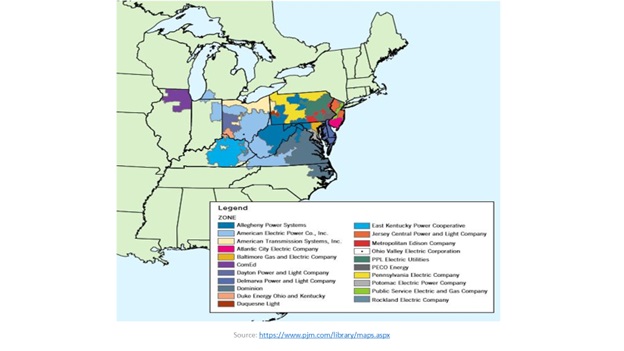
Figure 11 is an overview of the PJM geographical footprint. The Legend shows the list of PJM’s utility members.
Today PJM members share the benefits of power pooling and wholesale electricity markets, which allow them to sell each other power when they need it, because of the interconnected grid.
PJM models have multiple data attributes, including modeling the physical devices, appropriate limits, substation and network connectivity, telemetry to support State Estimation (SE) and other EMS functions.
The data and information to be submitted includes, but is not limited to, the following:
- Substation topology
- Equipment names or designations
- Facility physical characteristics including impedances, transformer taps, transformer tap range, transformer nominal voltages, etc.
- Facility limits and ratings
- Recommended contingencies to be studied
- Real-Time analog and equipment status telemetry for transmission and generation elements, including, but not limited to:
- Breaker, switch, or other equipment status required to determine connectivity
- MW, MVAR power flow for lines, transformers, loads, generators
Transmission Owners (TOs) and Generator Owners (GOs) are responsible for providing the information and data needed by PJM to accurately model their electrical system. These PJM parties have been successfully exchanging real-time and network model data for many decades.
9 Practical example of a multi-country data exchanges – European ENTSO-E
ENTSO-E the European Network of Transmission System Operators, represents 41 electricity transmission system operators (TSOs) from 34 countries across Europe, thus extending beyond EU borders.
ENTSO-E promotes closer cooperation across Europe’s TSOs to support the implementation of EU energy policy and achieve Europe’s energy & climate policy objectives, which are changing the very nature of the power system.
The main objectives of ENTSO-E center on the integration of renewable energy resources such as wind and solar power into the power system, and the completion of the internal energy market (IEM), which is central to meeting the European Union’s energy policy objectives of affordability, sustainability and security of supply. ENTSO-E aims to be the focal point for all technical, market and policy issues relating to TSOs and the European network, interfacing with power system users, EU institutions, regulators and national governments.”
The role of ENTSO-E is set to develop with the energy transition and the successes of European market integration. This calls for greater transparency among countries. The European Transmission System Operators (TSOs) are entities operating independently from the other electricity market players and are responsible for the bulk transmission of electric power on the main high voltage electric networks.
TSOs provide grid access to the electricity market players (that is, generating companies, traders, suppliers, distributors and directly connected customers) according to non-discriminatory and transparent rules. In order to ensure the security of supply, they also guarantee the safe operation and maintenance of the system. In many countries, TSOs are responsible for the future development of the grid infrastructure as well.
Figure 12: European Countries of the ENTSO-E
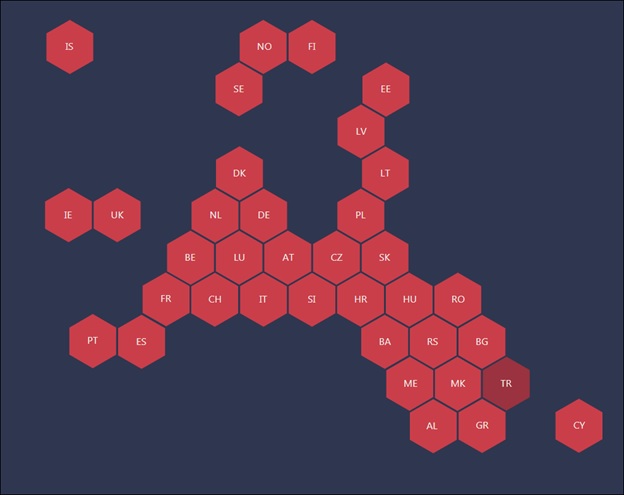
Source: ENTSO-E website, https://www.entsoe.eu/about/inside-entsoe/members/
Figure 12 shows the 43 TSOs from the 36 countries who are members of ENTSO-E (the European Network of Transmission System Operators for Electricity).
The integration of renewable energy sources (RES), which is a major target of the EU’s energy and climate policy objectives for 2020 and beyond, will affect existing electricity grid infrastructure, operations and the functioning of the electricity market itself. The integration of renewables into the power system requires that their intermittency to be balanced. This can be tackled by electricity grids operating smartly and cost-efficiently. To do this, a seamless and efficient information exchange is necessary at various stages, between an increasing number of companies – TSOs, DSOs, generators, and others.
In 2015, the members of ENTSO-E signed a multi-lateral agreement on the coordination of operational planning and derived services. They voluntarily agreed to outsource to regional security coordinators five services that had been so far performed on a national or control area basis. The first and core coordinated service is the common grid model. The common grid model is a multi-national mathematical model of the grid.
The TSOs need to share their individual grid models with the other TSOs and the regional security coordinators (RSC). RSCs are responsible for merging the different grid models of the TSOs and issuing common grid models. These are then shared with the TSOs to help to meet the operational needs of the TSOs.
9.1 European Regional Coordination Principles
A recent (2019) publication “Enhanced TSO Regional Coordination for Europe – Act locally, coordinate regionally, think European” states:
“ENTSO-E has identified seven key pillars, or key principles, for enhanced regional TSO coordination in the next decade.
Key Pillars for enhanced TSO regional coordination by 2030:
- TSOs act locally, coordinate regionally – within and across regions – and collectively think European. TSOs coordinate for the benefit of society at large.
- The evolution of regional TSO coordination should be pragmatic and follow an evolutionary approach, taking stock of lessons learned to resolve new challenges.
- Strengthening the link between system and market operation is essential for a secure, sustainable, and cost-effective electricity supply in Europe.
- The Regional Coordination Centres (RCC) should build upon the positive structures
and services of RSCs to TSOs. Under the Clean Energy Package (CEP – https://www.entsoe.eu/cep/), RCCs should address the capacity calculation regions (CCRs) and appropriately accommodate the future concept of System Operation Regions (SORs)
- Coordination services should grow in a flexible, modular, and organic manner, addressing the needs for running CCRs and SORs and going beyond legal requirements as needed.
- TSO regional coordination should have a suitable legislative and regulatory framework and sufficient time to deliver the legally mandated tasks. Regional Energy Forums should support the evolution of TSO coordination by providing policy alignment and perspective.
- TSO coordination should support a “European pathway” to maximise social welfare in partnership with DSOs and relying on close cooperation of all other relevant stakeholders.”
10 Prospects for International Data Exchange in Far East ASIA
Figure 13: International Control Centers of Far East Asia
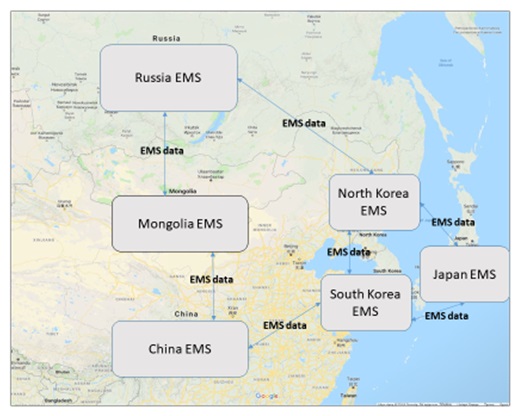
Source: GGM Consulting
Figure 13 pictorially depicts the national control centers of the Far East Asia region. Each EMS manages their own national grid. Each nation has interconnections with neighboring nations. Each nation has its own EMS vendor, with implementations of EMS software and hardware of different vintages, and differing complexities of real-time applications and capabilities. Some grid operators may just have a small subset of EMS applications; some may have a full set. Some may have a hierarchy of control centers with the national center at the top. Some countries may operate at a different grid frequency than their neighbors.
In order to exchange real-time data, the grid operators in the region will need to implement inter control center data exchange protocols. Sharing real-time information from neighboring countries’ major substations will help each country operate its grid in a more cost-effective and secure manner. This is especially beneficial with the growth of cheap renewable resources in the different countries. Generation from renewable power plants is constantly changing and cannot be easily predicted. With strong interconnections, economic power can be quickly shared with neighbors, and when it suddenly disappears replacement energy can be transferred from neighbors.
The growing diversity of power generation portfolios in the different countries, due to the rapid development of renewable energy sources, could result in greater interdependence across the Far East region. Renewables are connected to the grid with inverters. They typically do not provide support during emergencies since they have minimal inertia and inadequate voltage support. Today there are smart inverters that provide artificial inertia and voltage support during emergencies.
Transmission system design must look beyond national boundaries and move towards multi-national regional solutions. This could include DC transmission overlays on the AC system. If we need to connect systems with different operating frequencies (say 50 Hz and 60 Hz), AC/DC/AC back-to-back converters are a solution. HVDC lines could be used to economically transfer large amounts of power across a great distance.
Many of these solutions are likely already in operation and/or under development in many nations of the Far East grid.
National electricity system expansion plans have in the past been primarily focused on operation of their own national grids. These will need to be augmented, with overall international regional objectives in mind. Cooperation in joint planning and operations of the different nations is required to achieve more effective operations and to improve overall regional reliability, security and cost efficiency.
The basic types of data that could be exchanged in the Far East, include:
- Equivalent network models – say monthly or annually, or whenever make infrastructure changes are implemented
- Voltages and powers at major substations – say every 10 seconds
To start with, an in-depth review of existing control center functions of all countries will need to be carried out. Thereupon, data exchange details can be discussed based on existing capabilities. Next, future data exchanges can be discussed prioritized – and the required new infrastructure can be proposed.
The following are proposed steps to implement data exchange between countries and to study the impact and benefits of the growth of renewables on grid stability (steady state and dynamic) on neighboring countries.
10.1 Assessment of Existing Control Center Capabilities
The following constitute suggested first steps:
- Review and assess the control center capabilities of each country
- Some may have modern EMS functions and some just SCADA
- Assess the network models of each country and tie-lines with neighbors
- Assess communication capabilities with neighbors
- Develop a reduced network equivalent of each neighboring country
- Retain substations with significant generation and load
- Retain substations with large renewable resources
- Retain neighbor’s tie-lines
- Ignore remote, electrically distant parts of the grid
10.2 Country Control Center Coordination with Neighbors
Next, each country’s control center coordinates with its neighbors as follows:
- Exchange network equivalents with neighbors
- Each country implements the neighbors’ equivalents in their own control center
- Implement in the extended State Estimator model, if SE exists
- Implement in the Study Power Flow (SPF) model, if SE is not available
- Exchange updated equivalents every 6-12 months
- Typically, when major topological changes occur (new lines or generators)
- If SE exists:
- Exchange real-time data for key substations in the equivalent model, say every minute
- This include voltages and line flows
- This helps improve one’s own SE solution
- If SE is not implemented:
- Exchange offline SPF data for key substations in the equivalent model on a periodic basis, say monthly
- This include voltages and line flows
- This helps improve one’s own SPF solution
- Exchange offline SPF data for key substations in the equivalent model on a periodic basis, say monthly
- Exchange real-time data for key substations in the equivalent model, say every minute
The benefits of this coordination include more accurate SE and SPF solutions that illustrate the steady state impacts of the various countries’ renewables growth and future operating scenarios.
Figure 14: SE and SPF simulation at each country’s control center
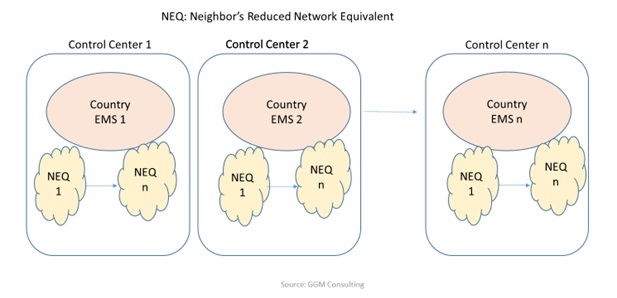
Source: GGM Consulting
Figure 14 shows how each country’s EMS control center uses its neighbors’ equivalents to run SE and SPF steady state grid simulations.
These models can also be used as a starting point to run dynamic simulations – for this additional dynamic data will need to be added.
10.3 Far East Regional Coordination Center
A new Far East Regional Coordination center could be established. The objective is to holistically study the regional interconnection for various grid operating scenarios.
The Regional Coordination center would use the network equivalent models from each country to synthesize a comprehensive multi-country network regional model.
Figure 15: Grid Simulation of the entire Far East Region
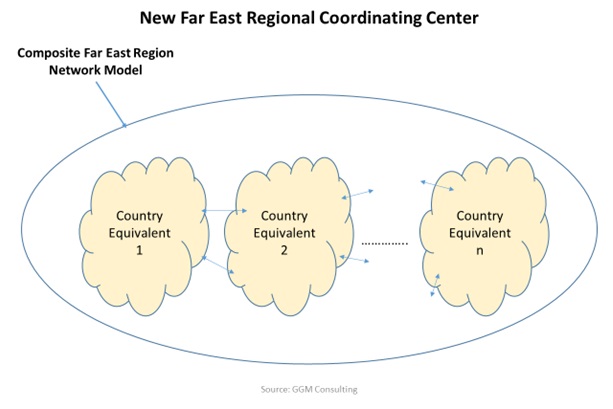
Source: GGM Consulting
Figure 15 shows how the entire Far East region can be simulated at a new higher level Far East Coordinating Center. The lines with double arrows indicate tie lines with neighbors. A composite Far East regional model is built by ‘stitching together’ the tie lines of the equivalent network models of each country – as indicated by the ellipse in the Figure.
With this composite model regional steady state and dynamic simulations can be performed for various hypothetical region-wide scenarios.
10.3.1 Region-wide Steady State Simulation
The Far East regional model would be used to perform power flow steady state simulations of various operating scenarios. These could include cases for annual peak and light load, periods of greater renewables penetration, etc.
10.3.2 Region-wide Dynamic Simulation
The Far East regional model could be used in the OTS for dynamic time simulation of future operating scenarios. The steps to do so include:
- Build the composite multi-country, multi-equivalent network model in the OTS
- Use the generic bootstrap capabilities of the OTS to build the rest of the power system dynamic simulation models, such as generator prime-movers, relays, etc.
- Build Instructor scenarios for various renewables penetration mixes and operating scenarios such as peak load and light load.
- Run multi-hour dynamic simulations of the OTS of various operating scenarios, to study the impacts of renewables on different countries, including;
- Frequency behavior, and the voltages, flows and overloads at all substations.
10.4 Benefits of Far East Region Coordination and Data Exchanges
Coordination and data exchanges between the Far East countries will result in the following benefits:
- Reduce customer costs:
- Share economical generation with each other
- Reduce the need for maintaining additional reserve capacity online
- Improve grid reliability:
- Provide backup support to each other during system emergencies
- Assist in addressing local, regional, and global pollution issues
- Share generation to allow generation in one or more countries to be displaced
The Far East countries are seeing a recent large growth in the deployment of economical renewables, and additional renewable resources for power generation remain to be tapped. Some of the nations of the region also have economical nuclear power. Renewables and nuclear would be the preferred mix of generation, although there is a large existing legacy of traditional fossil and hydro plants among the power plant fleets of the region.
Renewables and nuclear do not help real-time grid management, where minute to minute changes of electricity demand need to be followed in order to prevent frequency deviations. Therefore, some level of traditional fossil and hydro—possibly in combination with readily-dispatchable electricity storage—is always needed to meet load-following requirements and to ensure maintenance of normal system frequency.
10.4.1 Potential Studies for the Far East
The suggested types of studies of scenarios of grid interconnection for the Far East include:
- Impact of high or low production from renewables, in different countries, on their neighbors’ grid systems and on overall grid stability
- Sharing of cheaper power (hydro, nuclear, renewables) with neighboring countries. Study scenarios such as:
- One country has excessive cheap power (renewables or nuclear); how much could be safely shared with neighbors to reduce their own expensive production?
- If one country suddenly loses renewables’ production, how does it impact the grid stability of neighbors, since they must immediately provide the backup power?
- If one country has more nuclear production than required for their own demand, how could this be shared with neighbors who are generating more expensive power?
- How does future growth of renewables in different countries affect neighbors and overall grid stability? Simulate future renewables and transmission grid expansion plans.
- Different interchange scheduling scenarios and how they optimize customer costs.
- Peak load and Light load country scenarios with varying generation mixes, and their impact on neighbors
- Need for additional regional transmission lines to increase economic benefits; cost-benefit analysis of transmission line cost versus economic benefits it provides by increased sharing.
- Simulation of future energy storage deployment at the transmission grid level (when storage technologies become economically feasible). Where should they be located? How should they be managed and coordinated?
- Simulation of least-cost generation on a regional level, based on different assumptions about deployment of different types of power plants, and different future costs of generation infrastructure and fuels (for example, in the countries of the region.
- Simulation of the environmental benefits and costs of different electricity trading configurations for the region.
11 Concluding thoughts
The term “blackout” – or the lights being out – only partially describes the impact of loss of power to the customer. Industry and society at large are dependent on electricity, and a power outage of just a few hours can have a major economic impact and significant productivity loss –to the tune of millions of dollars.
Electrical interconnections typically consist of millions of grid components. These are monitored and managed in real-time by numerous electric utilities. These utilities are independently responsible for just subsets of the interconnection. Decisions made by one utility may affect neighbors due to the physics of how electricity flows. Hence it is important for utilities to work together, to address problems, and to jointly develop corrective plans.
The recent rapid growth of renewable energy resources such as wind and solar photovoltaic power, and of distributed energy resources, pose new challenges. These resources cannot be controlled by the grid operator and are not easily predictable. They also add minimal incremental rotational inertia and so do not help during emergencies. Hence, all else being equal, there is a greater risk of more frequent power outages for grids with high fractions of these types of resources.
Alternatives to conventional inertia will need to be pursued in a low-inertia grid. A new generation of smart inverters (which connect renewables to the grid) will need to be deployed, including inverters that provide synthetic inertia as well as local voltage support. Grid protection schemes and system restoration practices will need to be adapted and updated. All of this is possible today and is required to maintain future grid reliability.
Today, economical grid level energy storage is not readily available. Such storage needs to be available at high power levels and for extended durations. There is the potential for a technological breakthrough where such storage may be available in the future. This is a ‘panacea’ for real-time grid management. Energy storage can be used to balance the minute-to-minute variations of the intermittent production of renewables. Storage and renewables are a perfect marriage!
An important way to mitigate future grid problems is to have all operators in the interconnection work together, by sharing real time data, and by jointly developing corrective solutions. Increasing real-time transparency with neighbors will improve the management of the overall interconnection. Such data sharing will also allow utilities to share energy in a mutually beneficial manner to reduce costs to customers. Sharing data will enable development of an interconnection-wide, holistic, transparent grid management plan.
The challenge will be to design a Far East interconnection grid governance system – the objectives being to enhance real-time operation, improve grid stability and reliability, share economical renewables, facilitate optimal capital investment, and channel political energy towards mutual benefit. This will need to be championed from the highest levels of government and utilities.
References
- Book: ‘The Grid” by Gretchen Bakke, Bloomsbury, 2016
- Book: Standard Handbook for Electrical Engineers, Seventeenth Edition, Jay Giri, Section 18.4, McGraw Hill Education, Library of Congress Control number: 2017957636, 2018
- Book: Smart Grid Handbook, J. Giri, Chapter ‘Modern Energy Management Systems: Real-time Management of the Interconnected Electricity Grid’, John Wiley and Sons, 2016
- IEEE Smart Grid Newsletter Compendium, 2015
http://www.qmags.com/magazines/toc/toc_19496.pdf
Page 6 to 9 – “Distribution System synchrophasor-based control systems” - Madani, J. Giri, et al, “Challenging Changing Landscapes”, IEEE Power & Energy magazine, Digital object identifier 10.1109/MPE.2015.2431213, Sept/Oct 2015
- Giri, “Proactive Management of the Future Grid,” IEEE Power & Energy Technology Systems Journal, Open Access article: http://ieeexplore.ieee.org/stamp/stamp.jsp?tp=&arnumber=7080837, Vol 2, 2015
- Giri, contributor: “Set Phasors to synch: transmission gets smarter,” Bloomberg New Energy Finance Research Note, August 14th, 2014
- Book: Smart Grids – Infrastructure, Technologies and Solutions, J. Giri, and multiple co-authors, Chapter 3.4, ‘Transmission Systems’, Edited by Stuart Borlase, pp156-162 and pp188-210, CRC Press, 2013
- Giri, Manu Parashar, Jos Trehern, Vahid Madani, “The Situation Room”, IEEE Power & Energy magazine, Digital object identifier 10.1109/MPE.2012.2205316, September/October 2012
- NERC, Frequency Response Initiative Report, The Reliability Role of Frequency Response, Oct 30th, 2012.
- Book: Computer Methods in Power System Analysis, Stagg and El-Abiad, McGraw Hill Book Company, 1968
- Useful websites:
- nerc.com
- https://resourcecenter.ieee-pes.org/technical-publications/technical-reports/PES_TR_7-18_0068.html
IEEE/NERC Task Force report on “Impact of inverter-based generation on bulk power system dynamics and short circuit performance” - learn.pjm.com, www.pjm.com – US PJM grid
- entsoe.eu – European grid
- https://consultations.entsoe.eu/system-development/entso-e-connection-codes-implementation-guidance-d-3/user_uploads/igd-high-penetration-of-power-electronic-interfaced-power-sources.pdf
ENTSO-E 2017 “High penetration of power electronic interfaced power sources (HPoPEIPS)” - https://spectrum.ieee.org/energy/the-smarter-grid/chinas-ambitious-plan-to-build-the-worlds-biggest-supergrid
- https://curent.utk.edu/
- naspi.org – PMU synchrophasors
- youtube.com search for ‘psymetrixsolutions’
- http://www.powergridindia.com/ – Indian grid
Appendix A: An Innovative Solution to Future Multi-Utility Grid Management
- Introduction
Managing the future grid will require creative, innovative solutions. Uncertainties in the grid are increasing due to the growth of less predictable renewable generation resources, demand response programs, distributed generation, microgrids, potential cyber-security issues, the retiring workforce and the aging infrastructure.
Recently there has been a sudden growth in the deployment of a new type of grid measurement technology in installations all around the world. These measurement devices are called synchrophasors.
“Synchrophasors are precise grid measurements now available from field device monitors called phasor measurement units (PMUs). Measurements includes voltage and current – magnitudes and angles – frequency, rate of change of frequency and status data. PMU measurements are typically 30-120 observations per second – compared to every 2-4 seconds using conventional EMS technology. Each measurement is precisely time-stamped using a common time reference. Time stamping allows synchrophasors from across the grid to be time-aligned (or “synchronized”). Together, they provide a precise and comprehensive snapshot of the entire interconnection. Synchrophasors provide an immediate indication of grid stress and can be used to trigger corrective actions to maintain reliability.”
Synchronized phasor measurements (synchrophasors) provide a phasor representation of voltage and current waveforms, representing a sinusoidal signal simply as a magnitude and phase angle, with an associated timestamp. Synchrophasor analytics extract information from the PMU data streams and do not need a grid model.
Today, EMS capabilities are poised to be enhanced quite dramatically with the integration of the growing number of synchrophasor PMU measurements.
- The Modern EMS with Synchrophasors: EMS-WAMS
More recently, synchrophasor PMU analytics have been introduced at control centers, which significantly improve EMS control center capabilities. These new EMS-WAMS control centers can immediately share grid alerts with all utility operators, across the entire grid, to facilitate early problem detection and quick mitigation.
Today, many EMS control centers are receiving sub-second PMU data. PMUs generates very high volumes of synchrophasor and synchroscalar measurement data. This massive amount of data is used to provide additional useful information for grid operators. The modern EMS is evolving into a vast, diverse conglomeration of monitoring devices and advanced computer and communications technology that measures power system field conditions at sub-second rate.
Sub-second data rates mean the dynamic behavior of the grid can be readily assessed at the EMS; this was not possible in the past. Also, accurate GPS timestamping allows voltage phase angle differences to be compared at two different parts of the grid providing a summary indicator of power system stress.
Figure 16: Modern EMS-WAMS control center
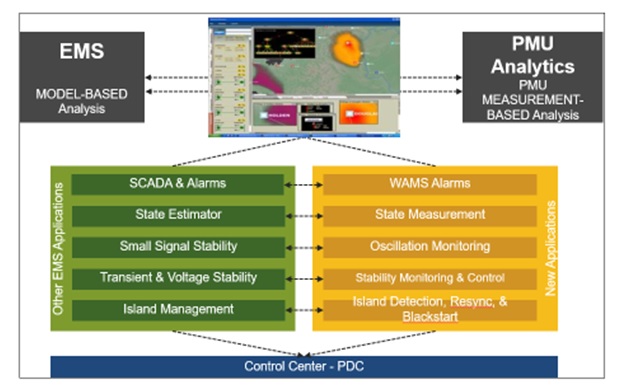
Source: GE Grid Solutions
Figure 16 illustrates the modern EMS (EMS-WAMS) control center functions and tools. They include the new sub-second Phasor Measurement Unit (PMU) measurement data and analytics.
The functions on the left of the bottom portion of Figure 16 represent the traditional EMS that is based on a user-defined model of the transmission system. The functions on the right are called WAMS (wide are monitoring systems). These are new analytics that augment the EMS with sub-second monitoring; these do not need a model of the power grid; the actual power grid is the model. WAMS analytics includes:
- Angular Separation
- precisely indicates location of grid overloads or outages
- State Measurement
- sub-second tracking of substation voltages
- Stability Monitoring
- oscillatory, voltage and transient
- Disturbance Location Identification
- Island detection and re-synchronization
Figure 17: EMS-WAMS Implementation
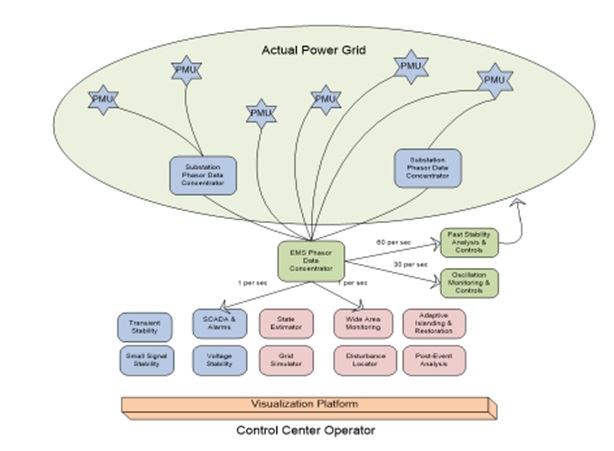
Another depiction of an EMS-WAMS implementation is shown in Figure 17.
Some of the benefits of a modern EMS-WAMS include:
- Faster identification of grid problems – prompt operator alerts and alarms.
- Monitoring of grid oscillations – to detect those that impact grid operations.
- Voltage and angular grid stability analysis in real time.
- Identification of grid disturbances outside one’s own SCADA purview.
- Fast detection of grid separation and partial grid blackouts
- Tools for reconnecting portions of the grid that are separated or de-energized
- Faster disturbance event analysis – provide information on what just happened.
- More robust and accurate SE solutions.
These EMS-WAMS capabilities provide grid operators with a wide-reaching visibility into the status of the grid, as well as, provide the ability to predict and plan for potential problems that may be lurking around the corner. Speed is of the essence when it comes to assessing the cause of grid problems – and more importantly, implementing quick, corrective actions.
- Proposed innovative solution for the Far East Asia multi-country Grid
A new WAMS control center could be created at the Far East interconnection level that uses PMU data from across the grid.
Figure 18: Wide Area Monitoring of Far East Asia – WAMS-R
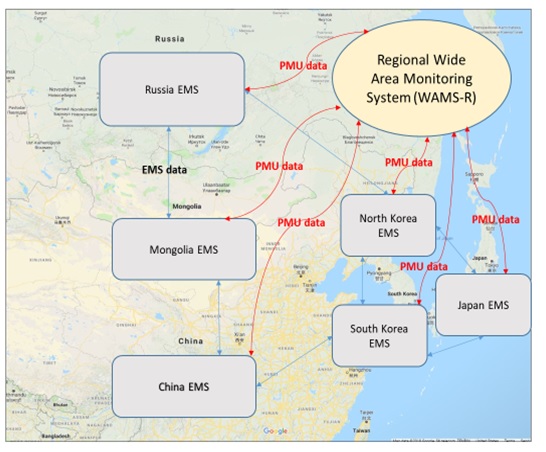
Source: GGM Consulting
Figure 18 shows a proposed regional WAMS (WAMS-R) and its connections with the national control center EMSs.
Building WAMS-R in Far East Asia would be a major technical, business and political effort. It will involve significant cooperation of all nations involved.
A suggested timeline and plan of action is:
- If PMU data are available at any of the EMSs, integrate them to create an EMS-WAMS
- Add new PMUs and bring their data into the EMS
- Integrate the new PMUs into the EMS
- Add new WAMS analytics to use all the PMU data
- Create a new regional WAMS (WAMS-R) control center for the Far East Asia region
- Send PMU data from all the national EMS to WAMS-R
- Add new PMU analytics to WAMS-R
- Add new operator displays and monitoring in WAMS-R
- When WAMS-R detects violations immediately alert all national EMSs
- Work with the national EMSs to develop corrective action plans when necessary
Appendix B: Examples of Other Multi-Country Grid Operations
- India
The Power Grid Corporation of India Ltd. (PGCIL), which oversees operation of the national grid, is one of the largest power transmission utilities in the world. The country is one single electrical interconnection. The peak load demand is over 100 GW.
Figure 19: India’s Regional Interconnections
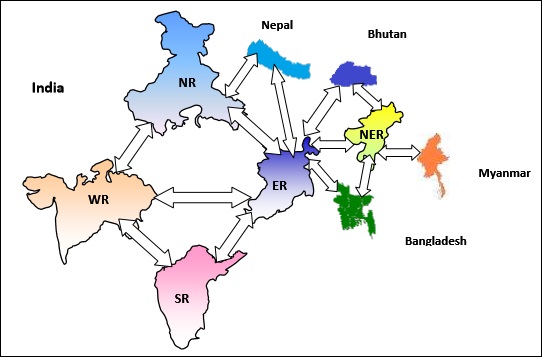
Source: PGCIL, India
Figure 19 provides an overview of the Indian EMS hierarchy. It consists of four EMS levels: national (entire country), regional (geographical groups of states), state, and SCADA systems within a state. Today, the Indian EMS consists of over 450 computers communicating with other each other hierarchically, to gather data from various locations of the grid every few seconds to monitor grid conditions across the country.
The power sector in India and its neighboring countries in South Asian Region must grow rapidly in order to sustain the high level of economic growth in the region. Against this backdrop, strengthening of cross-border electricity cooperation can prove beneficial for all in terms of providing adequate and reliable electricity supply. There are complementarities in electricity demand and resource endowments among these countries which can be leveraged upon to meet the growing energy requirements of the region while optimally utilizing the resources. Furthermore, increased electricity cooperation and trade among these countries can also bring economies of scale in investments, strengthen electricity sector financing capability, enhance competition, improve sector efficiency, and enable more cost-effective renewable energy penetration.
Recognizing the importance of electricity in promoting economic growth & improving the quality of life in the region and envisaging the need for a stronger cross-border electricity cooperation, the South Asian Association for Regional Cooperation (SAARC) organized a cooperative framework for electricity exchanges Eight countries have signed the SAARC Framework Agreement Energy Cooperation (Electricity). The Framework allows the member states to carry out Cross Border Trade of Electricity subject to laws, rules, and regulations of the respective member states.
The objectives include:
- Facilitate cross border trade of electricity between India and neighboring countries;
- Promote transparency, consistency and predictability in regulatory approaches across jurisdictions and minimize perceptions of regulatory risks;
- Meet the demand of the participating countries by utilizing the available resources in the region;
- Ensure reliable grid operation and transmission of electricity across the borders;
- Evolve a dynamic and robust electricity infrastructure for cross border transactions.
Figure 20: India’s International Interconnections
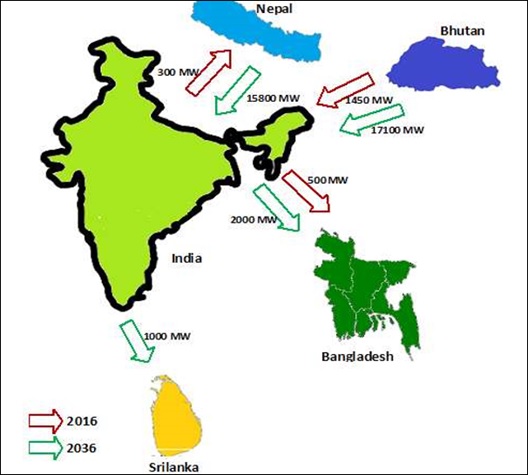
Source: PGCIL, India
Figure 20 provides a schematic of power exchanges between India and four neighboring countries.
In 2013, India embarked on a new project to deploy over 1800 PMUs (Phasor Measurement Units), across the interconnected national grid. This provides sub-second, instantaneous visibility of real-time conditions across India.
- Turkey
Figure 21: International Interconnections of Turkey
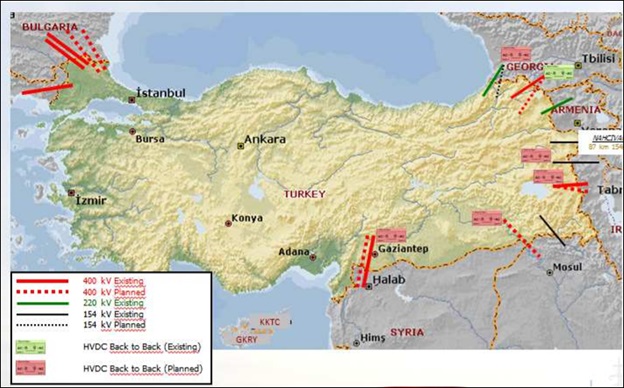
Source: Network Assessment Workshop Athens, Greece March 2017
Figure 21 shows how Turkey is interconnected with the European ENTSO-E grid and its neighbors. Turkey’s stated strategic plan is to continue to strengthen connections in order to improve grid reliability and reduce costs of grid operation.
Appendix C: Types of Data Exchange between Control Centers
Inter-utility real time data exchange has become critical to the operation of interconnected systems in most parts of the world. At the top level there is typically a system operator with coordination responsibilities for dispatch and overall interconnection security. Below this are regional transmission companies that tie together distribution companies and generating companies. In continental power systems, there are numerous interconnections across international borders.
The EMS data objects that are exchanged between control centers are defined in various parts of IEC 60870-6.
Data Examples include:
- Periodic System Data: Status points, analog points, quality flags, time stamps, etc.
- Exception reporting
- Information messages – simple text or binary files
- Device control requests: on/off, trip/close, raise/lower etc. and digital setpoints.
- Event Reporting
- Scheduling, accounting, outage and plant information.
- Historical Time Series Data
C1 Common Information Model CIM
The Common Information Model (CIM) was originally developed to support the integration of multi-vendor applications at control centers. This describes a common format that all utilities can use to exchange network model data. The data includes network topology and parametric data of grid equipment.
CIM standards are used to:
- Facilitate the exchange of power system network data between organizations
- Allow the exchange of data between applications within an organization
- Exchange market data between organizations.
The Common Information Model (CIM) has been officially adopted by the IEC to allow control centers to exchange grid model parameter information. IEC Standards 61970-301, 61968-11, and 62325-301—are collectively known as the CIM for power systems.
Appendix D: Communication Protocols for Data Exchange
SCADA manufacturers developed their own proprietary “closed” protocols for communicating from a control center to equipment in the field. These were followed by the development of “open” industry-standard protocols such as DNP3 (Distributed Network Protocol) and IEC (International Electrotechnical Commission) 61850. However, none of these communication protocols were suited to the requirements of communicating between control centers.
- ICCP
A joint EMS vendor initiative in the United States was development of ICCP (Inter Control Center Protocol). ICCP began as an effort to develop an international standard for real-time data exchange within the electric power utility industry. In the US, ICCP networks are widely used to tie together groups of utility companies, typically a regional system operator with transmission utilities, distribution utilities and generators. ICCP is based on client / server principles. Data transfers result from a request from a control center (client) to another control center (server). Control centers may be both clients and servers.
- ICCP TASE-2
The second ICCP protocol version – TASE.2 – is the version that has become the most popular. The Telecontrol Application Service Element (TASE) protocol – also known ICCP – allows for data exchange:
- Across wide area networks
- Between utility control centers of an interconnection.
- Within a utility’s hierarchies of control centers, and non-utility generators.
Data exchanges include real-time data and historical power system monitoring data.
Appendix E: Grid Operations During the Covid-19 pandemic
Dr. Jay Giri, June 2020
- COVID-19
A viral pneumonia of unknown cause was reported from Wuhan, China on December 31, 2019. On February 11, 2020, the communicable illness was names coronavirus disease COVID-19. On March 11, 2020, the World Health Organization declared COVID-19 a worldwide pandemic.
In the first few months of 2020, the virus quickly spread to almost every country worldwide. Many countries ordered national shutdowns to protect the health of the people. These shutdowns ordered millions of people to self-quarantine and stay at home except for workers meeting essential needs. People were asked to work from home if that was feasible, students took classes online, major businesses were shut down, and international travel restrictions were imposed. Only essential front-line workers could continue to work as before, including staff at hospitals, grocery stores, pharmacies, and other essential services.
The COVID-19 pandemic has had an unprecedented global impact. It has shaken the foundations of most countries through the human casualties caused by the disease and the economic setbacks dealt by the measures taken to limit the spread of the virus. These human and economic impacts continue to dominate the news and have the rapt attention of people worldwide.
Note: This appendix describes the situation as of June 2020.
- Impact of COVID-19 on the US Electrical Power Grid (June 2020)
Several COVID-19 hotspots were identified in the United States as early as February 2020, and electric utilities immediately began preparing for possible abnormal operating conditions.
The sudden downturn in employment, and shutdown of most businesses, directly affects the energy sector. The pandemic’s impacts on electricity and energy consumption include:
- Electricity Demand – Lower:
COVID-19 has caused electricity demand to be significantly reduced – most utilities on average have experienced a reduction of around 10%. - Daily Energy Use Profile – Flatter:
With most of the population following stay-at-home orders, the daily energy usage pattern has changed. The traditional pattern is camel shaped, with two prominent humps, one around noon and another in the evening. The new COVID-19 demand curve is much flatter since many commercial businesses are shut down. Globally, commercial load has decreased significantly, and part of it has shifted to increased residential loads as people spend more time and do more activities—ranging from cooking to home office electronics use—at home. - Carbon Emissions – Lower:
COVID-19 has significantly reduced carbon emissions due to a major reduction in transportation fuels use. People are not commuting to work. Public transportation, airlines, trains, and other modes of transportation are operating at significantly lower levels than before.
E3 Examples of COVID-19 impacts on Load
Figure 22 below shows total electricity demand in Italy before and after COVID-19. Italy was the first country in Europe affected by the virus, and has been the hardest hit. Italy’s maximum demand dropped about 10 GW, by on the order of a quarter, due to the pandemic shutdowns.
Figure 22: Italy Daily Electricity Demand Curve[2]
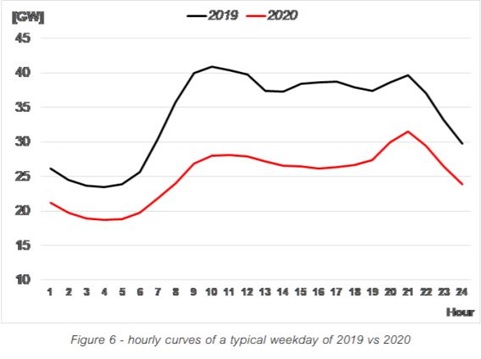
Figure 23 below (https://posoco.in/download/31-may-2020-weekly-demand-comparison/?wpdmdl=29304 shows the impact on the Indian electricity demand and energy use before and after COVID-19. On March 22nd, India imposed extremely strict stay at home orders, where even going out for physical exercise was prohibited. Note the sudden change in the trends below on March 22nd. In the following weeks, both electricity demand and energy use (electricity demand integrated over time) dropped by around 25%. Demand dropped from around 160 GW to around 120 GW, and daily energy use dropped from around 3700 GWh to around 2700 GWh.
Figure 23: India’s Electricity Maximum Demand and Daily Electricity Use Before and During the Period of COVID-19 Movement Restrictions[3]
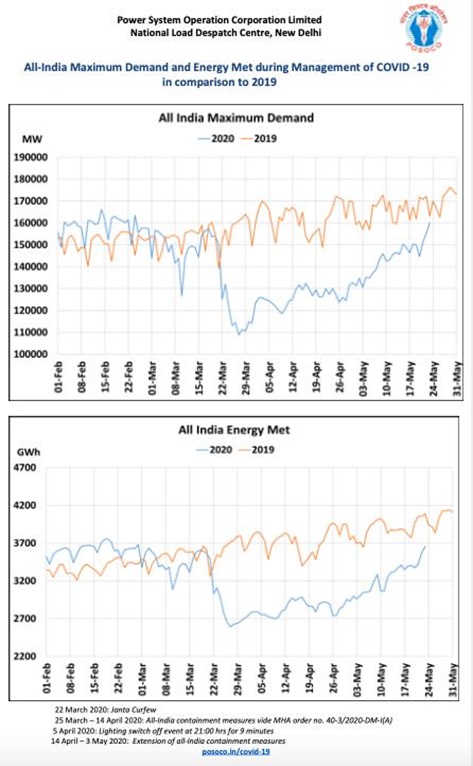
- Power Grid Operations during COVID-19
Electric power companies continually prepare plans to successfully handle many kinds of emergencies that could affect their ability to supply electricity to their customers. This includes preparing for events such as storms, earthquakes, and other natural disasters; cyber and physical attacks; and “high absenteeism” events that typically involve health emergencies that could severely limit the number of employees who are able to report to work.
COVID-19 has affected all aspects of life, including the electrical power grid. Grid operators are responsible for maintaining grid stability to ensure electricity supply to all customers.
Secure operation of the electric power grid, while maintaining grid stability around the clock, is a critical task, not just for commercial consumers and industry, but also for communities that depend upon the availability of safe, reliable power.
The flatter daily energy profile and lower overall demand experienced by many utilities in countries that have adopted stay-at-home orders and other restrictions to help reduce the health impacts of COVID-19 tend to help grid stability since the installed grid infrastructure has been built to handle a higher level of demand with greater daily fluctuations.
More staff are remotely connecting to their offices from home on non-critical tasks. Shifting work patterns on such an unprecedented scale can have serious unanticipated cybersecurity implications. Hackers may try to compromise these connections to access utility information and databases. So, these new connections pose an increased risk and their cyber-security needs to be ensured. [4][5]
As such, the immediate impacts of COVID-19 on grid operations are not of concern. During this pandemic, electric utilities and system operators have continued to provide a high level of service to ensure that the lights stay on for all customers.
But if the pandemic continues for many more months, it will have long-term ramifications on utility revenues, capital expenditures, and O&M expenses.
- Electric Utilities Responses to COVID-19
The immediate steps by electric utilities have been to protect employees’ health, while ensuring the lights stay on. With this objective in mind, utilities responded with changes to grid operation procedures and some mitigation measures were implemented.
- General Utility Responses
Typical actions implemented at utilities and their grid operations centers include, working from home, where possible, and sometimes performing only essential tasks and postponing or cancelling less critical activities. At some times during the months of COVID-19-related restrictions as much as 70% of utility workforces have been working from home.
- Control Center Responses
Control Centers are critical to ensure system reliability and the continuity of grid operations. Some measures instituted by utilities to adjust to COVID-19-related requirements have included:
- Increased length of grid operator shifts
- Reduced number of people in the control center
- Contact-less shift changes
- Off-shift grid operators are required to stay close to the control center, and not return to their homes
- Field Operations Responses
Field Operations staff, who are responsible for maintaining the power grid infrastructure, have implemented the following social distancing measures:
- One person per vehicle
- Drone and helicopter inspections of powerlines, substations, and other facilities
- Separating crews from each other
- Providing personal protective equipment (PPE) for operations staff
- Reduced work plans focusing on the most mission-critical tasks
- Customer Service Responses
Customer Service staff have transitioned to work remotely. Some utilities voluntarily implemented a temporary moratorium on service disconnections for non-payment.
- Supply Chain Responses
The Supply Chain for power system equipment has not been an issue so far. Nevertheless, these can become an issue if the pandemic continues for many months. An example is difficulty in procuring power system equipment such as transformers from China.
- Mitigation Responses to Handle the Pandemic Impacts
The pandemic has created new grid operating conditions and mitigation measures have been implemented. These new pandemic situations and their corresponding mitigation measures include:
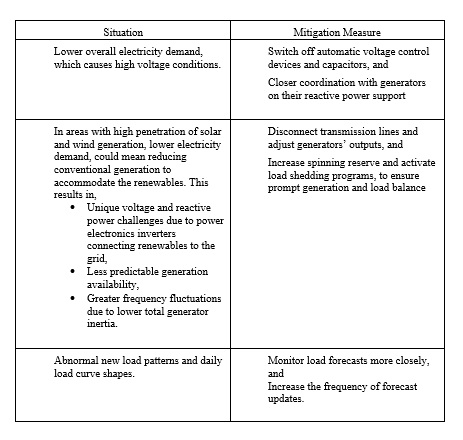
- US National Response
Major US national grid oversight organizations teamed together to prepare an epidemic/pandemic response plan. [6]
The national organizations included:
- NATF: The North American Transmission Forum (NATF) promotes excellence in the reliability, resiliency, and security of the electric transmission system.
- DOE: Established in 1977, the United States Department of Energy (DOE) is a cabinet-level department of the Federal Government whose mission is to ensure America’s security and prosperity by addressing its energy, environmental and nuclear challenges through transformative science and technology.
- FERC: The Federal Energy Regulatory Commission is an independent federal agency that regulates the interstate transmission of electricity, natural gas, and oil.
- NERC: The North American Electric Reliability Corporation (NERC) is a not-for-profit international regulatory authority whose mission is to assure the effective and efficient reduction of risks to the reliability and security of the grid.
This plan is intended to be complementary to an organization’s business or operations continuity plan, and focuses on planning/preparedness, response, and recovery activities that are specific to the outbreak of a severe epidemic/pandemic.
The plan’s objectives addressed the broad topics of health and safety of employees and their families. [7]
- Cyber and physical security of operations
- Communicating preparedness and response
- Preparedness
- Response
- Recovery
- Ongoing and Future Efforts
The NERC ERO (Electricity Reliability Organization) Enterprise will continue monitoring the BPS (Bulk Power System) during this unprecedented period. The ERO’s 2020 Summer Reliability Assessment, to be published in June 2020, will provide further detail on the availability of capacity resources, expected peak demands, and any potential reliability issues during the upcoming summer period. As the industry returns to normal operations, the ERO will identify lessons learned and make recommendations for improved practices.
US national organizations are in regular communication and actively listening to provide support to electric industry operators as needed.
NERC has stated that if the pandemic is prolonged, the extended periods of grid operator sequestration and deferred equipment maintenance pose increased future risks to the BPS, especially during the upcoming hot summer months, and over the longer-term horizon.
- Lessons learned from International Grid Operators
Lessons learned from outside North America can help North American system operators. [8]
Key observations and considerations include the following:
- Pandemic and emergency mitigation actions to support staff and staffing practices, including sequestration and remote capabilities
- Corrective measures implemented by transmission operators by disabling automatic schemes – such as tap-changing of transformers, voltage control, etc.
- Difficulties with transmission outage coordination and cancelled maintenance
- Reverse power flow due to large solar photovoltaic power inputs, effects on under-frequency and voltage protection, and lower short-circuit current
- Changed patterns of congestion and ancillary services needs and availability
- Shifts in availability of industrial loads for demand-side management
- Electricity demand down 5–10% compared to typical demand for this time of year and 10–25% down in areas where restrictions are highest
The European Network of Transmission System Operators for Electricity (ENTSO-E) and the European Commission report the following:
- Extraordinary measures taken by governments (such as restrictions on mobility) have led to a decrease of electricity consumption
- In all countries, the electricity market is functioning normally. All transmission service operators can manage core activities to ensure safety on the grid (e.g. balancing, frequency control). Major challenges largely concern staff and staff mobility (such as with respect to control room operations)
- There have been no concerns of electricity supply deficits—not even in the most COVID-19-affected countries, such as Italy and Spain
- Summary
Electric energy is an integral part of our life, and the COVID-19 pandemic will not change the fact that we all will continue to need reliable and cheap energy.
Electric power utilities have always been prepared to handle disasters, and the COVID-19 disaster once again reveals the importance of building a resilient utility business model.
The electric power grid has been designed and built to operate over a wide range of customer load demand shapes and patterns. Typically, there is sufficient reserve capacity always available to handle sudden emergencies and unplanned events.
The immediate COVID-19 impact on the power grid has been a reduction in electricity demand and flattening of the daily load shape. Both these impacts help the grid operator since they reduce the attention needed to manage generation resources to meet demand. On the other hand, low load conditions, especially with large percentages of renewable energy resources, will need closer monitoring and active management. Also, increased remote working is creating novel cyber-risks for utility companies. With the increase in number of internet connections, the traffic to utility information and databases needs to be continually monitored to ensure security.
As pandemic restrictions are gradually lifted, demand and energy use will return to more traditional patterns. Some of the long-term post-pandemic effects that will need attention include catching up with deferred maintenance of grid equipment, and helping grid operators who were sequestered at control centers to return to normal family life.
The key question is how long will this pandemic last, and how slowly will restrictions be lifted? This answer will decide what we need to do in the rest of 2020 and beyond.
- Closing Thoughts (June 2020)
In the future, the ongoing challenge of COVID-19 itself, as well as the lingering impact on society from the measures adopted to control and economically recover from the pandemic, will likely permanently change our lives in many ways.
Changes to electric power grid operations, that also apply to other industries as well, could include:
- More remote work for non-essential functions
- More online team meetings, less commuting to work
- Less need for physical office space
- Stronger cyber-security measures to handle increased internet business traffic
- Social distancing measures in face to face meetings
- Improved online cloud-based training and new hire onboarding
Some of these changes will likely decrease total electricity demand. For example, commercial buildings’ load would be reduced, with possibly modest increases to residential electricity use. This load shift and reduction in demand would put less pressure on grid energy resources.
Changes specific to grid operations could include:
- More focus on automating grid controls to be “self-healing”. Some potential measures here include:
- Add automation, monitoring and control at substations to make them a first line of defense against grid events.
- Increased focus on growing microgrids. They are self-sufficient for most of the time, and do not always depend on the transmission grid.
- This reduces the dependence on large power plants which are vulnerable in pandemics to disruptions in their supplies of fuels and other materials, such as coal, gas, maintenance supplies, or crucial spare parts.
- Add more electricity storage at renewable plants to ameliorate the impact of their variability on grid operations.
- Invest in new software and power electronics solutions across the grid infrastructure. These changes can be implemented very quickly in comparison to traditional grid expansion of substations, transformers, and transmission lines:
- An example is use of power flow control devices on transmission lines to automatically maximize transfer capability around the clock.
- These implementations are also amenable to centralized monitoring, control, and optimization, to quickly adapt to changing conditions, and have less need for field staff.
- In addition, upgrades to software and power electronics may help to bring about and accelerate improvements in how microgrids and renewables interact with each other and with central grids, as well as assisting in the formulation and operation of real-time electricity (and electricity storage) markets. For example, microgrids and renewable plants in a region could be made to work with each other at the distribution level, to exchange power as needed, and to provide reliable, economical electricity to customers. It is conceivable that microgrids and the generation and storage within them could ultimately establish distribution system-level real-time electricity markets for their regions.
- Minimize human contact. Some measures include:
- Sequestered operation in control centers
- Staggered work shifts
- Perform non-essential functions remotely
- Deploy drones for field inspections and deliveries
- Add new emergency backup control centers at different geographical locations.
- Closer coordination between high voltage transmission grid operators and the lower voltage distribution grid operators, since microgrids and renewables are rapidly growing at the distribution grid level.
- More electrified public transportation and public, commercial, and private electric vehicles will create an extensive fleet of distributed batteries across the region. With proper regulations and standards, they could be designated as potential backup energy resources, so that, when they are idle—such as in the winter and at night when batteries for electric tractors are less used, or when drivers of electric long-haul trucks are resting–these batteries (assuming they are recharged in a timely manner) could be tapped to provide electricity back to the grid as needed (reverse the direction of power flow), such as at night when solar energy is not available.
- Use cloud-based training simulators for:
- Remote operator training and training coordination with neighboring utilities, as well as, for example, transmission systems interconnected across national borders,
- Evaluation and testing of new vendor software applications and platform upgrades.
References:
- IEEE Power & Energy Society, Industry Technical Support Leadership Committee, “Sharing Knowledge on Electrical Energy Industry’s First Response to COVID-19,” May 2020
- NERC Special Report Pandemic Preparedness and Operational Assessment: Spring 2020
- Edison Electric Institute: “Electric Companies and Pandemic Planning: What You Should Know,” February 2020
- Electricity Subsector Coordinating Council, Assessing and Mitigating the Novel Coronavirus (COVID-19) A Resource Guide, Version 8: Updated May 11, 2020
III. ENDNOTES
[1] See, for example, International Atomic Energy Agency (IAEA, 2016, “Decommissioning of Nuclear Facilities: Germany’s Experience”, dated August 18, 2016, and available as https://www.iaea.org/newscenter/news/decommissioning-of-nuclear-facilities-germanys-experience.
[2] Source: Cigre Electra, “System Operations impact of Covid-19: European Perspective” by Enrico Carlini (IT), François Boulet (FR), Jens Jacobs (DE), Jorge Hidalgo (ES), Susana Almeida de Graaff (NL), June 2020
[3] Source: http://POSOCO.in/covid-19
[4] Utility Dive, “COVID-19 forces delay of 7 reliability standards, including cybersecurity supply chain protections”
[5] Power magazine, “Cybersecurity Is More Important Than Ever Due to COVID-19”, https://www.powermag.com/cybersecurity-is-more-important-than-ever-due-to-covid-19/, April 30th 2020
[6] Source: Epidemic/Pandemic Response Plan Resource Electric Transmission Organization Version 1 May 14, 2020 – http://www.natf.net
[7] https://www.natf.net/docs/natf/documents/resources/resiliency/epidemic-pandemic-response-plan-resource.pdf
[8] Source: US Electric Power Research Institute (EPRI)
IV. NAUTILUS INVITES YOUR RESPONSE
The Nautilus Asia Peace and Security Network invites your responses to this report. Please send responses to: nautilus@nautilus.org. Responses will be considered for redistribution to the network only if they include the author’s name, affiliation, and explicit consent.