DPRK Briefing Book: Fuel and Famine: Rural Energy Crisis in the DPRK
The Nautilus Institute, 2000 published as a Policy Paper for the Institute on Global Conflict and Cooperation at UC San Diego
Abstract:
The North Korean economic decline in the 1990s reveals a complex food and energy shortage problem. Inadequate energy supplies are an immediate cause of this agricultural collapse, and the energy shortage must be resolved in order to reach a sustainable recovery. Hayes, Von Hippel, and Williams explore the origins and impacts of the rural energy shortage and suggest that international cooperation is necessary to resolve North Korea’s energy and food crises.
Contents
- Rural Energy Shortages Impacts of Energy Shortages on Agriculture and Rural Life
Rural Energy Profiles: Data Tables for National, County, and Farm Levels
“Bottom-Up” Estimate of Energy and Agricultural Inputs Use in an Indicative DPRK County
Unhari Village: Results of a Rural Energy Survey
Rehabilitating The DPRK’s Rural Energy System
- Benefits of Rural Energy Sector Rehabilitation
Elements of a Rural Energy Rehabilitation Program
Obstacles and Solutions
Assessing Projects
Next Steps in Assisting the DPRK in Addressing Rural Energy Needs
- Rehabilitating the DPRK’s National Energy Infrastructure
The Military Implications of Rural Energy System Rehabilitation
Geopolitical and Regional Implications of Rural Energy System Rehabilitation
Justification of Rural Rehabilitation Program Investments
County-level Project Elaboration
Costs of Specific Alternatives
Impact of Rural Energy Problems (and Solutions) on the Stability of Rural Society
Conclusion
Appendix 1: Summary of Sectoral Demand Estimates
Appendix 2: Demographic and Agricultural Statistics
Appendix 3: Residential Sector Energy Use Estimate
Appendix 4: Public/Commercial Sector Energy Use Estimate
Appendix 5: Domestic Water Supply Energy Use Estimate
Appendix 6: Industrial Sector Energy Use Estimate
Appendix 7: Agricultural Sector Energy Use Estimate
Appendix 8: Electricity Supply Data and Bulk Demand Comparison
List of Tables and Figures
Figure1. Declines in Production and Supply
Table 1: Potential Program of Import Support and Capital Construction
Figure 2: Rural Energy Investment
Figure 3: Commercial Energy Supply in North Korea, 1990 and 1996
Figure 4: Commercial Energy Consumption in North Korea by sector, 1990 and 1996
Figure 5: DPRK Fertilizer Consumption, 1989-99
Figure 6: DPRK Diesel Fuel Consumption in 1990 and 1996
Figure 7: Estimated DPRK Electrical Generating Capability
Table 2: DPRK Rural and Agricultural Energy: National Level
Table 3: DPRK Rural and Agricultural Energy: County Level
Table 4: DPRK Rural and Agricultural Energy: Cooperative Farm Level
Table 5: Summary Estimated Residential Energy Use in County A, 1990 and 1998
Table 6: Public/Commercial Energy Use in County A, 1990 and 1998
Table 9: Summary of Findings of Unhari Village Rural Energy Survey
Figure 8: Summary of Estimated Use of Electricity, Coal, and Diesel Fuel in County A, 1990 and 1998
Figure 10: Nautilus Institute Wind Power Project in Unhari, DPRK, May 1998 and October 1998
Table 10: Rural Energy Import Requirements (Worst Case)
Table 11: Rural Energy Capital Construction Requirements
Figure 11: Investment Trajectory for 5-year North Korean Rural Energy Sector Rehabilitation Program
Figure 12: A Framework for Comparing Rural Energy Rehabilitation Projects
Introduction
It is well known that the Democratic Peoples’ Republic of Korea (the DPRK, sometimes referred to as “North Korea” ) suffers from chronic shortages of both food and energy. It is increasingly evident that inadequate energy supplies are the immediate cause of the collapse of North Korean agriculture, and must be addressed in order for a sustainable recovery to take place. This paper examines the origins and impacts of the DPRK’s rural energy crisis, and explores the technical and economic dimensions of international responses to the crisis.
The principal findings of this paper are summarized as follows:
The DPRK’s energy crisis.
The disastrous decline of the DPRK’s industrial economy in the 1990s-GNP reduced by half, infrastructure in a state of near-collapse-while rooted in long-term economic and policy failures, has its immediate cause in a drastic, ongoing energy crisis. Since the end of the Cold War, major shortages have become chronic for all forms of modern energy supply, with petroleum products, coal, and electricity all reduced by more than 50 percent since 1990. These shortages have in turn affected all sectors of the economy, especially transportation, industry, and agriculture. The energy crisis is a result of the loss of subsidized Soviet oil imports, failure to maintain and modernize energy infrastructure, the impacts of natural disasters, and inefficiency in energy production and end use.
Energy impacts on food production and rural areas.
North Korean grain production fell from 8 million tons in 1990 to 2.5 million tons in 1996. The UN World Food Program estimates the current year’s crop at 3.8 million tons, still one million tons short of the minimum subsistence level. This decline in agricultural production is profoundly related to energy shortages. Lack of fertilizer, fuels, and electricity have seriously affected soil fertility, water pumping, field preparation, and the planting, harvesting, processing, and distribution of crops. Agricultural yields have dropped and human labor requirements have increased, while rural ecosystems are under severe stress due to the increased use of fuelwood and crop wastes as substitutes for commercial energy supplies. Inadequate energy supplies for cooking, heating, and lighting also have negative impacts on human health and the quality of life in rural areas. Current international relief programs have focused primarily on food and medical aid, essential to relieve current suffering but doing little to address the underlying infrastructural problems, particularly energy.
Figure 1. Declines in Production and Supply.
North Korean grain production, fertilizer consumption, and commercial energy supplies have all fallen drastically in the 1990s. The use of biomass energy such as woodfuel and crop wastes has increased, stressing rural ecosystems. Sources: WFP 1999, FAO 1999, Von Hippel et al. 1997.
Rehabilitation of the DPRK’s energy system.
The DPRK’s energy crisis is nearly intractable under present circumstances. The DPRK has few options for fuel switching, given its complete lack of oil and natural gas resources. Much of its energy infrastructure consists of obsolete and worn-out Russian equipment. Given its lack of foreign exchange and the present U.S. sanctions policy, the DPRK lacks access to either the technology or capital required to obtain adequate supplies on the international market, to develop new sources, to improve energy efficiency, or to rehabilitate its infrastructure. Despite recent reports of new generating capacity coming online, North Korean responses are still primarily limited to the rationing of fuel and electricity, and to policies promoting local energy self-sufficiency at the county level, which may have negative environmental and economic consequences. Effective rehabilitation of the DPRK’s energy system will require major intergovernmental cooperation, investment by international financial institutions, and technology transfer. Much of the DPRK’s existing energy infrastructure will have to be replaced or substantially upgraded. The capital cost of complete rehabilitation is estimated at $20 to $50 billion over twenty years.
Solving the rural energy crisis.
Major improvements in agricultural and rural energy can be achieved at much lower cost, and in a shorter time, than rehabilitation of the entire North Korean energy infrastructure. A comprehensive rehabilitation program for rural areas would feature a combination of short-term energy imports and medium-term capital construction and rehabilitation projects. Components of an import program would ideally include imported fertilizer, tractor fuel, and electricity sufficient to restore agricultural production to above minimum subsistence levels. Such an import program would be comparable in cost to current food aid programs-around $300 million per year-while reducing year-to-year food insecurity. Capital projects would include rehabilitation of the rural electricity transmission and distribution grid, development of reliable local power generation, improving the energy efficiency of the irrigation and drainage system, modernizing fertilizer and tractor factories, and improving transportation of agricultural inputs and products. Development of LPG or natural gas pipelines and infrastructure could address a number of rural energy problems, while minimizing the risk of diversion of fuels for military purposes-but these options may be difficult and expensive to develop. The combined cost of a five-year program of import support and capital construction is estimated at $2 to $3 billion over five years (See Table 1 and Figure 2 ). Such an investment program should be implemented in conjunction with a program of institutional reform, revenue generation, energy price reforms, and overall economic rationalization, so as to put the rural economy as a whole on a sustainable footing.
Political implications.
The restoration of the DPRK’s food supply, and the stability of rural society, depend on solving the rural energy crisis. In the context of a breakthrough in U.S.-DPRK relations, joint efforts to solve the rural energy crisis would be a significant, achievable first step toward engagement on both sides. Rural energy rehabilitation would cost much less than full rehabilitation of the DPRK’s national energy system, would have little impact on the military balance, and in the process of cooperative efforts involving international organizations, would provide experience and information necessary to undertake more costly and involved forms of cooperation at later stages. A set of criteria for evaluation of rural projects is suggested.
Table 1: Potential Program of Import Support and Capital Construction
Energy Imports to Meet Current Shortfalls
Energy TypeNeed AddressedTotal RequirementAnnual ShortfallInternational PriceAnnual Cost (year 1) FertilizerSoil fertility750,000 tons (NPK)600,000 tons (NPK)$300/ton(NPK)$180 million ElectricityIrrigation, food processing, lighting3.0 billion kWh1 billion kWh$.05/kWh$50 million FuelTractors, small engines 150,000 tons100,000 tons$270/ton$27 million CoalCooking and heating4 million tons1.5 million tons$50/ton$75 million Total$332 million
Rural Energy Infrastructure Rehabilitation Program
ProjectCapacityNeedCapital Cost Electrical generation500 MWMeet peak demand during irrigation andthreshing season$500 million Rehabilitate rural T&D system 60,000 km , 3 GVAReduce losses, increase reliability$300 million Rehabilitate irrigation system6 million m 3 /yearImprove energy efficiency and reliability of water delivery$250 million Fertilizer factory modernization500000 ton/yearIncrease domestic fertilizer production$100 million LPG storage and pipeline system200000 ton/yearElectrical generation, transportation fuel ,household and public cooking and heating$250 million Tractor factory modernization75000 tractorsService and upgrade tractor stock, possibly convert fuel types$100 million Improve rural transportation 200 million km-tonsNew vehicles, improve roads and railways$250 million Total$1,750 million
Figure 2: Rural Energy Investment. Investment trajectory for 5-year North Korean rural energy sector rehabilitation program, with costs as outlined in Table 1. Annual costs in current-year U.S.$.
The DPRK’s Energy Crisis
After three decades of autarkic, Soviet-style economic development, the economy of the Democratic Peoples’ Republic of Korea (DPRK, also referred to as “North Korea”), by the end of the Cold War, was industrialized and energy intensive, requiring substantial inputs of commercial energy to fuel transportation, heavy industry (including self-sufficient production of primary industrial products such as steel, cement, and chemicals), and the needs of a predominantly urban (60 percent in 1990) population. In 1990, estimated per capita energy use in the DPRK was 71 gigajoules per person (2.4 tons coal equivalent/person), more than twice that of China in the same year, and over half that of Japan’s.
The energy resources used to fuel North Korean industrialization were partly domestic in origin. The DPRK has substantial coal and hydropower resources, with coal reserves estimated at between one billion and ten billion tons, and developable hydroelectric potential estimated at 10-14 GW. 1 Most of the DPRK’s energy infrastructure-coal mines, thermal power plants, hydroelectric plants-was built during the 1950s to 1980s with substantial financial and technical assistance from the Soviet Union and its allies. A national electricity transmission and distribution grid is claimed to have been extended to every one of the DPRK’s rural villages by 1968. 2
The DPRK, however, produces no petroleum or natural gas, and is entirely reliant on foreign oil imports. During the Cold War, the DPRK received heavily subsidized oil supplies from the Soviet Union, the world’s largest oil producer. In 1990, crude oil imports amounted to about 2.5 million tons, from three sources: China, Russia, and Iran. Import of refined products such as diesel and gasoline from China came to another 0.6 million tons. 3 One oil refinery was built at the port of Rajin to process crude oil delivered by tanker from Russia and the Middle East; another was built at the terminus of a pipeline from China.
Although the DPRK’s energy system provided the foundation for the country’s rapid industrialization, the system was riddled with actual and potential problems. The obvious Achilles heel was the DPRK’s complete dependence on imported oil, especially given its lack of foreign exchange and the increasingly hostile geopolitical environment in which it found itself. The system also suffered from fundamental economic irrationality, with energy supplies distributed by the state according to quotas fixed in the central plan. As in other Soviet-style systems, this arrangement was highly vulnerable to mismanagement and misallocation; it lacked independent revenue streams to produce new investment capital; and it included few mechanisms for market feedback to supply and demand-for instance, electricity consumption was not even metered. The sustainability of the DPRK’s energy system was further undermined by heavy dependence on Soviet technology for the equipment used in both energy production and end use; this equipment was both energy inefficient and dependent on continuing Soviet assistance for maintenance. Furthermore, lack of environmental controls-impacts on humans and ecosystems aside-had a damaging cumulative effect on equipment (for instance high-sulfur emissions shortened the useful life of coal-fired boilers). Severe deforestation and inappropriate land conversion increased erosion, leading to major siltation problems in reservoirs that reduced hydroelectric generation.
In the 1990s, the vulnerabilities of the DPRK’s energy system were made manifest by the dissolution of the Soviet Union and a series of natural disasters, resulting in three severely damaging blows. Soviet support had buffered the DPRK’s inability to earn foreign exchange-inability due variously to its general economic decline, bad credit from its default on previous international loans, and U.S. sanctions-and thereby pay for its own oil imports. With the collapse of the USSR in 1990, the new Russia curtailed subsidized oil supplies to the DPRK, as it did to other former client states such as Cuba. Russian oil exports were now on a strictly commercial basis, sold at prevailing market rates. With the DPRK short on credit and foreign exchange, it couldn’t afford to continue importing at former levels. Imports from Russia fell by 90 percent in a few years, as did imports from the Middle East. The DPRK’s main oil supplier is now China. In 1996, oil imports stood at around 40 percent of their 1990 level. 4
The dissolution of the USSR also had an impact on the modernization and maintenance of the DPRK’s energy infrastructure. The spare parts and expertise to maintain energy supply infrastructure-generators, turbines, transformers, transmission lines-and energy consuming equipment-boilers, motors, pumps, chemical reactors-were no longer subsidized. Much of the DPRK’s infrastructure was already at retirement age or beyond in 1990; some facilities dated back to the Japanese occupation in the 1930s. The shortage of replacement parts for old equipment, and the absence of new facilities constructed on a normal replacement schedule, were major contributors to overall infrastructural collapse in the 1990s.
Natural disasters in the mid-1990s, while not the principal cause of many of the problems in the DPRK’s energy system, nonetheless hit an already fragile system with debilitating blows. Severe flooding in 1995 and 1996 was followed by severe drought and a tidal wave in 1997. In addition to destruction of crops and agricultural land, these disasters impacted the energy system in numerous ways. Coal mines were flooded (some mines producing the best quality coal, near Anju, were on the coast below sea level to begin with). Hydroelectric production was affected by floodwaters that damaged turbines and silted up reservoirs, then by drought that reduced water supplies below the levels needed to generate power. Electric transmission and distribution lines were damaged, as were roads and transportation equipment. Heavy erosion and scavenging for food denuded landscapes, reducing the availability of biomass for energy use.
The combination of the three factors described above, plus other influences, resulted in a severe contraction in the supplies and consumption of fuels and electricity in the DPRK between 1990 and 1996. Figure 3 shows the estimated changes in supplies of coal, electricity, oil, and biomass (wood and crop wastes) between 1990 and 1996, and Figure 4 shows estimated 1990 and 1996 demand for commercial energy forms by sector in the DPRK. 5 The consequences of shortages of fuel and electric power are felt throughout the North Korean economy.
Figure 3: Commercial Energy Supply in North Korea, 1990 and 1996. All forms of commercial energy supply declined. Biomass energy use increased.
Figure 4: Commercial Energy Consumption in North Korea by sector, 1990 and 1996. Total estimated consumption fell by 51 percent during the period. Consumption decreased in all sectors, but by very different rates.
Transportation.
Electric and diesel trains, and diesel trucks, are responsible for most of the transportation of goods in the DPRK. It is estimated that road and rail freight transport were reduced to 40 percent of their 1990 values by 1996. 6
Manufacturing.
Energy intensive industries have been powerfully affected. Iron and steel production is estimated to have been reduced to 36 percent of 1990 levels by 1996. For cement, the figure is 32 percent. Lowered production of primary inputs in turn affects other industries that depend on them: automotive, building, and agriculture. 7
Residential and commercial.
Residential and commercial lighting, heating, and cooking are all affected by energy shortages. Indirect effects include health impacts, loss of productivity, and reduced quality of life.
Public health.
One tragedy noted by many international medical relief workers is the abysmal condition of hospitals, in which energy shortages play a crucial role. Many hospitals and clinics are unheated in winter, lack electricity for lighting and medical equipment, and even lack the ability to boil water for human consumption.
Negative synergisms and vicious circles.
The consequences of energy shortages interact with each other, with food shortages, and with general infrastructure decline to produce seemingly insuperable vicious circles. For example, the lack of sufficient coal to run factories that build spare parts or make steel means that there will not be sufficient spare parts to keep coal trains operating, or the steel to repair tracks; in turn, delivery of coal to factories is difficult because the trains are often not running. Another example is that poor power quality damages electrical equipment; devices used to protect equipment, such as variable transformers used in households to power TVs, increase electricity demand and power factor without increasing useful output, which in turn lowers power quality.
In summary, in the last decade the DPRK’s supply of commercial energy has fallen by one-half to two-thirds, with impacts felt throughout the economy. While this is just one result of, and one cause of, the DPRK’s overall economic decline, it is clear that economic recovery will not occur without a major reversal of the present situation.
The Rural Energy Crisis
Rural Energy Shortages
Fertilizer
Modern agriculture relies on steady inputs of inorganic chemical fertilizers. For grain crops under North Korean soil and growing conditions, the amount required is 400-500 kg/ha of the basic macronutrients nitrogen, phosphate, and potassium (NPK). UN and DPRK agricultural experts estimate the total North Korean requirement at 700,000 tons/year (NPK). 8 The actual bulk amount of fertilizer required to achieve this goal could range from 1.5 to 2.5 million tons year, depending on the nutrient contents of the different fertilizers employed (for example, urea contains more than twice the amount of nitrogen per ton that ammonium phosphate contains).
The DPRK historically manufactured 80-90 percent of its own fertilizer. 9 Prior to the current energy crisis, North Korean fertilizer production is estimated at 600,000 to 800,000 tons per year (NPK). 10 Whether production fell steadily during the 1990s, or precipitously around 1994 as North Korean government figures show, is uncertain ( Figure 5 ). What is certain is that since 1995, domestic production has been less than 100,000 tons per year. Aid and foreign purchases have brought the 1999 total to 160,000 tons, less than one-quarter the amount required.
The drastic decline in fertilizer production is a result of fertilizer factories being out of operation or operating at minimal levels. This is due at least in part to the poor condition of Soviet-built plants, which has been blamed on natural disasters. 11 The important nitrogen fertilizer plant at Hamhung has been inoperable since at least 1994, and the DPRK government has requested international assistance to refurbish the plant. 12 In addition to problems of damage or disrepair, however, the energy crisis affects fertilizer production in several important ways. The North Korean fertilizer industry uses coal as both energy source and chemical feedstock. The amount of coal required to produce 700,000 tons per year (NPK) is estimated at 1.5 to 2.0 million standard tons of coal per year. 13 This represents as much as 10 percent of the available annual coal supply, a very significant fraction and thus in competition with other high-priority uses. More important, transporting up to two million tons of coal represents a serious strain on the transportation system, especially the railways, which are already suffering from severe electricity shortages. Electricity shortages also directly impact the ability to provide the requisite 5 billion kWh of electricity used in the production of 700,000 tons of fertilizer. Finally, the transportation bottleneck also limits the ability to ship fertilizer-another 1.5 to 2.5 million tons in bulk-from factories to farms. For these reasons, even if the DPRK’s fertilizer plants were refurbished or rebuilt, energy shortages would continue to pose a serious constraint on domestic fertilizer supply.
FIGURE 5: DPRK Fertilizer Consumption,1989-99.
Consumption is the sum of domestic production and imports, and is calculated based on content of nitrogen-phosphorous-potassium nutrients. FAO data, as reported by the North Korean government, shows a steep decline starting in 1994. More recent data from WFP shows a steady decline throughout the period. The dashed line shows the level of fertilizer required to achieve normal crop yields.
Due to the fertilizer shortage, for at least the last five growing seasons, North Korean agriculture has operated at 20 to 30 percent of normal levels of soil nutrient inputs. This shortfall is the largest single contributor to reduced crop yields, and thus to food shortages. Outright purchase of fertilizer to compensate for a 500,000 to 600,000 ton annual shortfall, at an international market rate of $300 to $400/ton (NPK), would cost $150 to $240 million. 14 Lack of foreign exchange has prevented the DPRK from aggressively pursuing this course.
Diesel Fuel
North Korean agriculture requires petroleum products to fuel mechanical equipment used in field and food processing operations, with an estimated total of 3 million mechanical horsepower on farms. 15 The main fuel consumers are some 70,000 general-use diesel tractors (the workhorse 28 hp Chollima), which constitute two-thirds of the total mechanical power. 16 Other equipment includes 8,000 tractor-crawlers for use in tillage, and 60,000 small engines used in transplanting, weeding, reaping, threshing, and shelling. 17 Based on typical consumption rates of 110-130 liters per hectare per year for rice and maize, UN and DPRK agricultural experts estimate the annual fuel requirements on North Korean farms at 140,000 tons of petroleum products, mostly diesel fuel. 18
In 1990, North Korean agriculture is estimated to have used at least 120,000 tons of diesel fuel. 19 Since the energy crisis began, agricultural consumption has declined to 25,000 to 35,000 tons per year. 20 Given that the total current North Korean oil supply is estimated at 1.5 to 2.0 million tons, it may be difficult initially to understand why more fuel cannot be made available to the agricultural sector. 21 The key is that most agricultural machinery, including all tractors, is designed to use only diesel fuel, and cannot use other petroleum products without expensive retooling. Diesel fuel is only a fraction (less than 20 percent) of the products refined from crude oil. North Korean diesel fuel supplies, which come from crude oil imports refined in the DPRK and to a lesser degree from direct purchases of refined diesel, have fallen from 750,000 tons in 1990 to around 300,000 tons per year in the last five years. At the same time that supplies have dropped by 60 percent, the share consumed by the agricultural sector has fallen from 15 percent in 1990 to around 10 percent at present. The reason that agricultural use has dropped more than proportionally is that military allocations have remained firm, with a much less than proportional decrease. 22 After the current estimated military allocation of 160,000 tons of diesel fuel is accounted for, the amount of diesel remaining for use in all sectors including agriculture, transportation, and industrious only 140,000 tons. This is equal to the yearly requirements for agriculture alone. Agricultural use then, is necessarily only a fraction of that remaining amount (see Figure 6 ). 23
The result of fuel shortages is a 70 to 80 percent reduction in the use of tractors and other farm machinery. The shortfall has been felt both directly, through lack of fuel to run equipment, and indirectly, through the impact of energy shortages on maintenance and spare parts. As a 1998 UN expert mission noted,
. . . an acute shortage of fuel, electrical power, raw materials, consumable machine tool parts (e.g. cutting steels) and other inputs… has severely restricted the flow of essential replacement parts needed to keep the agricultural machinery in operating condition. These same constraints have also severely depressed the manufacturing volume and distribution of new replacement machinery and equipment to the farms…[A] significant proportion of the ” motorized” agricultural equipment is out of service due either to having reached the end of its service life, or due to lack of vital spare parts. . . . [However] even if the entire machinery park could rapidly be brought back into service, the equipment could still not be operated unless it also became possible to restore adequate fuel supplies. . . . In quantitative terms, the total farm power available from tractors and small engines has probably been reduced during the 1998 season from a potential figure of about 2,200 MW down to only 20 percent of this figure. 24
The loss of mechanized power to farms entails much higher inputs of human and animal labor (discussed below). Moreover, it decreases crop yields by reducing the efficiency of tasks, such as spreading fertilizer, and by making it more difficult to accomplish key tasks, such as transplanting and harvesting, in a timely fashion. Additional purchases of diesel fuel to make up the annual shortfall of 80,000 to 120,000 tons would cost $21 to $32 million per year at 1999 prices.
Figure 6: DPRK Diesel Fuel Consumption in 1990 and 1996.
Electricity
The most important use of electricity in North Korean agriculture is to power water pumps for irrigation and drainage. Irrigation pumping is indispensable for rice cultivation, which requires more water than provided by natural precipitation, and moreover requires that the water be delivered at precise times during the growing season. Altogether, 1.0 million hectares of rice, maize, and other crops are irrigated, mostly from surface water that is pumped into reservoirs or directly onto fields, through more than 10,000 kilometers of canals and pipes, by more than 30,000 pumping stations. 25 Most of the pumps in this network are electrical. With the water-use efficiencies of the irrigation network taken into account, rice requires an average of 10,000 cubic meters of irrigation water per hectare per year. 26 For wheat and maize, the figures are respectively 3,500 and 1,600 cubic meters per hectare per year. UN irrigation experts estimate that the electricity requirement of pumping this amount of water averages 1,200 kWH per hectare per year, corresponding to an annual national requirement of 1.2 billion kWh. 27 Electricity is also used to operate other stationary equipment on farms, such as threshing and milling machines, and machine tools in farm and district workshops. These are estimated to require another 460 million kWh per year. 28 The total agricultural electricity requirement is estimated at 1.7 billion kWh per year.
Rural-sector electricity use also includes residential, public, and commercial uses. Despite very low per capita use of electricity by Western standards, 1.5 million rural households are still the largest non-agricultural rural user, requiring over 900 million kWh per year for electrical loads such as lights, refrigerators, irons, and televisions. Public and commercial users–such as clinics, schools, offices, workshops, and stores–require another 300 million kWh per year. Thus electricity demand in the rural sectors with agriculture and other rural uses taken together–is 2.9 billion kWh per year.
Current rural electricity consumption is estimated at 1.9 billion kWh per year, a shortfall of 1.0 billion kWh. The most critical problem for agriculture has been a decline of 300 million kWh in electricity for irrigation pumping. Electricity consumption for other agricultural uses has declined to about 350 million kWh, bringing the total for agriculture to 1.3 billion kWh. In the remainder of the rural sector, electricity consumption has been reduced by half, from 1.2 billion kWh to 0.6 billion kWh.
Even with electricity generation declining from 46 billion kWh in 1990 to 24 billion kWh in 1996, it might appear that the DPRK could reassign power from other sectors to the rural sector, at least sufficiently to compensate for the 300 million kWh shortfall in irrigation pumping. However, the situation may not be so easy to remedy. The key issue is not the total amount of electricity supplied over the course of a year, but rather the peak power required during the period of heaviest demand, namely the irrigation season. Over half of irrigation pumping takes place during the month of May. Peak pumping power demand during this period is at least 900 MW. Total national generating capacity in 1996 was 4.7 GW. With an average capacity factor of 0.65, the average generating capacity online was 3.1 GW. After transmission and distribution losses of 19 percent are accounted for, irrigation pumping demand represents over one-third of all of the DPRK’s generating capacity (see Figure 7 ). Moreover, with the national grid fragmented, irrigation pumping might represent an even higher percentage of generating capacity within some generating “islands.” Given its very large fraction of total demand, competition with minimum electricity requirements in other sectors such as industry and transportation, and the technical problems of “islanding”, high line losses, high power factors, and low reserve capacity, it appears that increasing the power available for irrigation pumping may be very difficult to achieve. The 25 percent shortfall in electricity for irrigation pumping leads to a comparable shortfall in irrigation water provided to crops, decreasing crop yields. A 1998 UN expert mission confirmed that
The unreliable water supply is mainly due to unreliable pumping, which is mainly caused by an unreliable electricity supply. . . . Examinations of records at three major pumping stations indicated that they had suffered an average of nearly 600 power failures per year, over 2300 hours per year with no power, an average voltage reduction of over 15 percent . . . and a 10 percent average frequency reduction. . . . The frequent power failures result in considerable waste of water . . . the shortfall in water available to the crops is estimated to be about a quarter of the total requirement. 29
FIGURE 7: Estimated DPRK Electrical Generating Capability. Irrigation pumping demand represents over one-quarter of online generating capacity in peak seasons.
The main consequence of a 50 percent drop in electricity consumption in the rural residential, household, and commercial sectors is a decline in basic services and quality of life. It is reported that power is rarely available to residences in rural villages during the winter months. Households also experience frequent outages and brownouts during other seasons. Aid workers have reported that clinics and hospitals often have no power available. If it were possible for the DPRK to purchase electricity on the international market–difficult under present circumstances for technical reasons alone–the cost of meeting the 1 billion kWh shortfall, at $0.04 to $0.06/kWh, would be $40 to $60 million. Meeting the shortfall through improvements in domestic supply would likely increase this cost by a factor of two or more, depending on the technology employed (for example, thermal power plant, barge-mounted gas turbine, small diesel generator).
Coal
The principal use of coal in rural DPRK is for cooking and heating. It is the key form of commercial energy for the residential and public/commercial sectors. Households generally use coal in the form of briquettes made from coal dust. These are burned in traditional ondal stoves, which pipe the hot exhaust gases from cooking fires under the floors of living spaces, providing space heating. The average household is estimated to require 2.6 tons per year. The rural sector has a total coal requirement of 3.9 million tons per year.
Coal production in the DPRK is estimated to have fallen by 50 percent between 1990 and 1996, with mines inoperable due to flooding and lack of spare parts for equipment, and with coal transportation greatly reduced due to fuel and electricity shortages. The recent annual shortfall of coal in the rural sector is estimated at 1.4 million tons. Because some rural areas have access to local coal mines, coal use in the rural sector is estimated to have declined somewhat less than in the DPRK as a whole. Many rural areas, however, do not have accessible, functioning local mines.
The consequence of the rural coal shortfall is that household coal consumption for cooking, heating, and preparing animal feed has declined on average by 40 percent, to 1.6 tons per year. Given the variability in access, and the difficulty in transporting coal to remote areas, some areas probably consume only a fraction of the average. Where access to biomass as a substitute fuel is also limited, impacts on health and quality of life are likely severe. Public buildings such as schools and hospitals often have limited coal supplies. In some areas, relief workers have reported significant health effects from waterborne diseases, due to the lack of fuel to boil water.
Biomass
Biomass–wood, fiber, and crop wastes–is used heavily in the DPRK’s rural economy for fuel, fodder, fertilizer, handicrafts, and building material. Biomass consumption is limited by availability. Nine million hectares of the DPRK are covered by forests, but these are in generally poor condition, with only 3 million hectares classified as productive forests. As a result, the DPRK has in recent years imported wood from the Russian Far East on a labor exchange basis.
The dominant use of biomass fuels is for household cooking and heating. In 1990, it is estimated that rural sector biomass fuel consumption was 22.7 million tons. Since that time, biomass consumption has risen by an estimated 1.3 million tons per year to make up for shortfalls in coal and other fuels. The rise in biomass fuel consumption is cause for concern because of the burden it places on competing uses, such as animal fodder and compost, that in turn affect food supplies. Increased biomass harvesting also affects rural ecosystems such as forests, streams, and croplands by reducing ground cover, disrupting habitats, and increasing soil erosion and siltation. Additionally, more household time and effort is spent in foraging at a time when other labor requirements are high and nutritional availability is low.
Impacts of Energy Shortages on Agriculture and Rural Life
As seen in the previous section, the DPRK rural energy crisis is in fact composed of multiple energy crises–distinct and separate shortfalls of solid and liquid fuels and electricity, each of which affects productive activities and living conditions in different and cross-cutting ways. Some of the most serious impacts include the following:
Lower food production.
Modern agriculture in the DPRK requires many energy-based inputs. These include chemical fertilizers, pesticides, irrigation and drainage, and mechanical work such as dike construction, plowing, and harvesting. Post-harvest food processing, including activities such as drying, threshing, and milling, is also energy intensive. The amount, quality, and timing of these inputs and activities are crucial to maintaining high levels of production. All of these inputs and activities have been strongly affected by energy shortages, both directly–such as through shortages of fuel and electricity–and indirectly–such as through energy-driven declines in fertilizer production, transportation of crops and requisites, and manufacturing of agricultural machinery and spare parts.
More human and animal labor required.
Prior to the energy crisis, North Korean agriculture was largely mechanized, with an average of seven tractors per hundred hectares of cultivated land, and other specialized equipment for transplanting, cultivating, harvesting, threshing, and milling was widely available. Fuel shortages and lack of spare parts–itself a consequence of energy shortages in industry–have left an estimated 80 percent of the DPRK’s agricultural machinery out of use. The tasks for which machinery was formerly employed must now be performed manually. A 1998 UN mission concluded
the entire rice crop is being managed this year employing only hand labor or animals, apart from an initial primary tillage operation . . . the entire maize crop is being is being produced employing only hand labor or draught animals.
The additional labor required to compensate for the lack of mechanized inputs is conservatively estimated at a minimum of 300 million person-hours per year, but could easily be a factor of two or more higher. The current return to pre-modern agricultural methods comes at a significant cost in time taken away from other productive activities, in additional nutritional requirements for humans and animals during a period of food scarcity, and in impacts on morale and well-being.
Very limited transportation.
Electricity and fuel shortages, poor maintenance, and the lack of spare parts have severely impacted transportation in rural areas. Nationwide, freight shipments by ship, rail, and truck are estimated to have declined by 55 percent, 60 percent, and 75 percent, respectively, since 1990. In rural areas transportation shortages have impeded the shipment of agricultural inputs and products, such as fertilizer, grain, and vegetables. This has led in turn to greater dependence on farm tractors for transport hauling, reducing their already limited availability and fuel supplies for field operations such as ploughing and harvesting. Aid workers note that walking long distances appears very common in the North Korean countryside. Increased movement of people and products by foot and animal cart reduces the amount of time that might otherwise be spent in productive activities or rest and increases nutritional demands.
Reduced basic human services.
The DPRK’s rural population of approximately 7.5 million, roughly one-third of the total population, depends on commercial energy supplies for many basic needs. In the household, coal is required for cooking and heating, and electricity for lighting and refrigeration. In other parts of the rural economy, such as the public, light industrial, transport, and commercial sectors–which include schools, hospitals, administrative buildings, shops, workshops, and distribution outlets–commercial energy is required for lighting, heating, water pumping, operation of equipment, and movement of goods and services. In addition to the many consequences of reduced agricultural output, energy shortages elsewhere in the rural sector have resulted in unheated buildings, unlighted homes, and other services not provided–a general decline in the quality of life.
Health impacts.
Public health depends on nutrition, hygiene, and medical services, which in turn rely heavily on modern energy inputs. Foreign medical aid workers have noted many public health problems rooted in energy shortages, including the absence of safe drinking water due to the lack of fuel needed to boil water. The problem of hospitals and clinics left unheated during the frigid Korean winter–aid workers have reported that only the hopeless go to them for treatment–has reached such a crisis point that in 1998, the Red Cross felt compelled to provide 7,000 tons of coal for heating hospitals and clinics. Electricity to run surgical and diagnostic equipment, to refrigerate medicines, and even to provide the lighting required in examination and operating rooms, has often been reported as unreliable or unavailable. Under conditions in which nutrition is marginal at best and vulnerability to disease is consequently much greater, energy shortages have conspired with other problems to increase the risk of contagion and reduce the effectiveness of medical treatment.
Environmental degradation.
Prior to the current energy crisis, the rural DPRK still depended heavily on biomass fuels such as firewood and crop wastes. This was especially true in areas where alternative cooking and heating fuels, such as coal, were not locally available. Current shortages of coal, and of functioning trains and trucks to transport it to remote areas, have intensified demand for biomass fuels. This in turn has impacted the rural environment, in the case of fuelwood by reducing forest and ground cover and increasing erosion, and in the case of crop wastes by burning organic matter that might otherwise have been composted, returning nutrients to the soil. Increased biomass use has likely exacerbated the consequences of agricultural conversion of unsuitable land, of excessive logging (one of the few sources of foreign exchange), and of natural disasters. In addition, electricity shortages have led the government to promote local power generation, which in 1998 was said to have led to the construction of 5,000 small and medium-sized hydroelectric stations. It is likely that the construction of these stations has led to the further deterioration of watersheds, riparian and riverine habitats, and freshwater fisheries.
Vulnerability to natural disasters.
No country is immune from natural disasters. However, the ability of rural society to prevent, mitigate, and recover from the impacts of natural disasters depends on factors such as preventive maintenance of infrastructure, redundant equipment, stockpiling of necessary materials, reforestation and soil conservation practices, weather forecasting, emergency communications, and disaster relief operations. These in turn rely on energy supplies to power equipment and move personnel and materiel. In the 1995-97 disasters, the DPRK suffered the loss or degradation of tens of thousands of hectares of agricultural land. The government is currently appealing to the UN for the fuel and machinery to repair some of its lost cropland. Without routine and emergency reserve energy supplies, the DPRK will be unable to recover fully from disasters that have already occurred, and will remain highly vulnerable to future disasters.
Risk of new food catastrophe.
In the DPRK’s short growing season, the timing of agricultural field operations is crucial. Breakdowns in the delivery of crucial inputs such as water and fertilizer can impair plant establishment and cause yields to suffer acutely. Inconsistent energy supplies, in tandem with the relatively non-diversified crop structure of DPRK agriculture, make this a serious risk. For rice, the flooding of paddy fields must take place during a narrow time window in the spring. Water pumping for crop irrigation takes place on a massive scale in the DPRK, and is the largest single agricultural use of electricity. Since irrigation occurs during a concentrated period, it demands a large proportion of overall North Korean electrical generating capacity during this time. With power plants, the national transmission and distribution network, and the irrigation system all in poor repair, electrical outages during the irrigation season already result in significant reduction of water supplies. Should the electrical grid break down altogether in key regions for a sustained period, the consequences could be even more dire. The result could be a near-complete crop loss, with a shortfall of several million tons of grain.
Stability of rural society threatened.
Rural society appears to be a stable element within the DPRK, and may even be considered a backbone of the regime. With the ability to revert to traditional modes of production in the absence of modern inputs, rural society as a whole appears to be suffering less from food and material shortages than urban society, and has reportedly even been absorbing some of the unemployed urban population. Traditional social patterns and the authority of functional local leaders such as cooperative farm managers appear so far to have withstood the general economic collapse. However, if supplies of commercial energy to the rural sector were to fall well below the current 20 to 40 percent levels, or are maintained at very low levels for a very long period, the combination of continued low agricultural production, environmental degradation, vulnerability to natural disasters, declining living standards, urban out-migration, and nascent social discontent could destabilize rural society. This is a factor that should be taken into account by those attempting to predict the stability of the DPRK regime, as rural instability could contribute significantly to regional fragmentation and the possibility of civil war.
Rural Energy Profiles: Data Tables for National, County, and Farm Levels
This section summarizes estimates of the rural energy situation for the DPRK. Table 2 presents estimates of energy and other material inputs into the rural economy, subdivided into agricultural, residential, and public/commercial sub-sectors. (Rural industrial, military, and transportation sub-sectors are not included.) Estimates are presented according to two scenarios, labeled “Crisis” and “Recovery.” The “Crisis” scenario represents the current situation. It is based on Nautilus Institute estimates for 1996, with some modifications based on recent UN reports. 30 The “Recovery” scenario represents a rehabilitated, post-energy crisis North Korean rural sector. It projects reasonable and desirable levels of agricultural inputs and outputs, based on best available data for actual 1990 levels, 31 modified in some cases to reflect recent expert opinion regarding long-term sustainable levels. The numerical difference between Crisis and Recovery scenario figures is shown in the column labeled “Shortfall.” These numbers represent the current shortages of different types of energy and other key quantities. Specific causes and impacts of energy shortages for different fuel types and different aspects of agriculture and the rural sector are discussed in earlier sections.
Tables 3 and 4 provide crisis, recovery, and shortfall estimates for two important sub-national administrative units, namely counties and cooperative farms. The numbers in these tables were obtained by dividing the appropriate quantity in Table 2 by the total number of units at the county (approximately 200) and cooperative farm (approximately 3000) levels, respectively. As cooperative farms comprise nearly nine-tenths of both rural population and agricultural production, the errors or misrepresentation imposed by using this simple calculation to obtain average figures is small. The resulting numbers in Tables 3 and 4 illustrate the approximate conditions in average counties and farms; while rough, these figure are nonetheless useful in considering the impacts of the rural energy crisis at different scales, and also in assessing possible energy/agriculture rehabilitation strategies, as is done later in this paper. 32
Table 2: DPRK Rural and Agricultural Energy: National Level
AG & Rural Statistics Recovery ScenarioCrisis ScenarioCurrent Shortfall Farm Population6,045,000 persons6,045,000 persons Farm Households1,300,000 households1,300,000 households Total Grain Crop Area1,370 kha1,430 kha rice area574 kha580 kha maize area496 kha590 kha other crop area300 kha260 kha Total Grain Production6,824 kt3,748 kt3,076 kt rice production3,444 kt1,798 kt1,646 kt maize production2,480 kt1,534 kt946 kt other production900 kt416 kt484 kt rice yield6.0 t/ha3.1 t.ha2.9 t/ha maize yield5.0 t/ha2.6 t/ha2.4 t/ha other yield3.0 t/ha1.6 t/ha1.4 t/ha Irrigated Area980 kha980 kha0 kha Irrigation Water Use6.8 million m35.1 million m31.7 million m3 Fertilizer NPK750 kt166 kt584 kt Bulk Fertilizer1,786 kt636 kt1,150 kt Human Field Labor450 million hours743 million hours-293 million hours Animal Field Labor30 million hours63 million hours-33 million hours Energy Statistics Recovery ScenarioCrisis ScenarioCurrent Shortfall Agriculture Oil116 kt35 kt81 kt field61 kt18 kt42 kt processing55 kt17 kt39 kt Electricity1693 million kWh1270 million kWh423 million kWh irrigation1231 million kWh923 million kWh308 million kWh processing462 million kWh347 million kWh116 million kWh Coal333 kt299 kt33 kt Biomass3100 kt2790 kt153 kt Rural Residential Oil20 kt2 kt18 kt Electricity917 million kWh550 million kWh367 million kWh Coal3413 kt2948 kt1365 kt Biomass17862 kt19647 kt-1786 kt Rural Public/Commercial Oil20 kt10 kt10 kt Electricity303 million kWh121 million kWh182 million kWh Coal119 kt36 kt83 kt Biomass1786 kt1608 kt179 kt Total Oil155 kt47 kt109 kt Electricity2912 million kWh1941 million kWh972 million kWh Coal3865 kt2383 kt1482 kt Biomass22748 kt24046 kt-1298 kt
Table 3: DPRK Rural and Agricultural Energy: Estimate for Average County Level
AG & Rural Statistics Recovery ScenarioCrisis ScenarioCurrent Shortfall Farm Population30,225 persons30,225 persons Farm Households6,500 households6,500 households Total Grain Crop Area6,850 ha7,150 ha rice area2,870 ha2,900 ha maize area2,480 ha2,950 ha other crop area1,500 ha1,300 ha Total Grain Production34,120 t18,740 t15,380 t rice production17,220 t8,990 t8,230 t maize production12,400 t7,670 t4,730 t other production4,500 t2,080 t2,420 t rice yield6.0 t/ha3.1 t.ha2.9 t/ha maize yield5.0 t/ha2.6 t/ha2.4 t/ha other yield3.0 t/ha1.6 t/ha1.4 t/ha Irrigated Area4,900 ha4,900 ha0 ha Irrigation Water Use34 thousand m326 thousand m38.5 thousand m3 Fertilizer NPK3,750 t830 t2,920 t Bulk Fertilizer8,929 t3,180 t5,749 t Human Field Labor2,250 thousand hours3,715 thousand hours-1,465 thousand hours Animal Field Labor150 thousand hours315 thousand hours-165 thousand hours Energy Statistics Recovery ScenarioCrisis ScenarioCurrent Shortfall Agriculture Oil580 t174 t406 t field303 t91 t212 t processing276 t83 t193 t Electricity8,465 thousand kWh6,348 thousand kWh2,116 thousand kWh irrigation6,153 thousand kWh4,615 thousand kWh1,538 thousand kWh processing2,312 thousand kWh1,734 thousand kWh578 thousand kWh Coal1,664 t1,497 t166 t Biomass15,500 t13,950 t1,550 t Rural Residential Oil99 t10 t90 t Electricity4,583 thousand kWh2,750 thousand kWh1,933 thousand kWh Coal17,065 t10,239 t6,826 t Biomass89,310 t98,241 t-8,931 t Rural Public/Commercial Oil98 t20 t78 t Electricity1,514 thousand kWh606 thousand kWh908 thousand kWh Coal596 t179 t417 t Biomass8,931 t9,824 t-893 t Total Oil777 t203 t573 t Electricity14,562 thousand kWh9,704 thousand kWh4,858 thousand kWh Coal19,324 t11,915 t7,409 t Biomass113,741 t122,016 t-8,274 t
Table 4: DPRK Rural and Agricultural Energy: Estimate for Average Cooperative Farm Level
AG & Rural Statistics Recovery ScenarioCrisis ScenarioCurrent Shortfall Farm Population2015 persons2015 persons Farm Households433 households433 households Total Grain Crop Area457 ha477 ha rice area191 ha193 ha maize area165 ha197 ha other crop area100 ha87 ha Total Grain Production2,275 t1,249 t1,025 t rice production1,148 t599 t549 t maize production827 t511 t315 t other production300 t139 t161 t rice yield6.0 t/ha3.1 t.ha2.9 t/ha maize yield5.0 t/ha2.6 t/ha2.4 t/ha other yield3.0 t/ha1.6 t/ha1.4 t/ha Irrigated Area327 ha327 ha0 ha Irrigation Water Use2267 m31700 m3567 m3 Fertilizer NPK250 t55 t195 t Bulk Fertilizer595 t212 t383 t Human Field Labor150 thousand hours248 thousand hours-98 thousand hours Animal Field Labor10 thousand hours21 thousand hours-11 thousand hours Energy Statistics Recovery ScenarioCrisis ScenarioCurrent Shortfall Agriculture Oil39 t12 t27 t field20 t6 t14 t processing18 t6 t13 t Electricity564 thousand kWh423 thousand kWh141 thousand kWh irrigation410 thousand kWh308 thousand kWh103 thousand kWh processing154 thousand kWh116 thousand kWh39 thousand kWh Coal111 t100 t11 t Biomass1,033 t930 t103 t Rural Residential Oil7 t1 t6 t Electricity306 thousand kWh183 thousand kWh122 thousand kWh Coal1,138 t683 t455 t Biomass5,964 t6,549 t-595 t Rural Public/Commercial Oil7 t1 t5 t Electricity101 thousand kWh40 thousand kWh61 thousand kWh Coal40 t12 t28 t Biomass595 t655 t-60 t Total Oil52 t14 t38 t Electricity971 thousand kWh647 thousand kWh324 thousand kWh Coal1,288 t794 t494 t Biomass7,583 t8,134 t-552 t
“Bottom-up” Estimate of Energy and Agricultural Inputs Use in an Indicative DPRK County
As a supplement to the analysis presented above, a rough estimate of energy use and use of agricultural inputs was prepared for an average-sized county in the mountains of the central DPRK (not Onchon County where Unhari Village is located). This estimate was compiled using a combination of information provided by Nautilus colleagues from the region, previous estimates of national average energy intensities compiled by Nautilus, 33 rural energy data from Nautilus’ rural energy survey in Unhari village 34 and information from UN and other documents. As such, this estimate is a composite of county-specific (though often incomplete and/or anecdotal) data and more generic information from national and village-level analyses. The appendices provide a listing of the procedures and assumptions used in preparing this county-level estimate. The intent of this analysis is to provide a picture, hazy though it might be, of the energy and agricultural system and needs in a particular DPRK setting, with the hope that it will help provide some guidance to those contemplating assistance activities for rural areas in the DPRK.
County Demographic, Agricultural, and Economic Setting
The Indicative DPRK County (“County A”) considered in this estimate is situated in approximately the middle (east to west) of the Korean Peninsula, and is in the southern portion of the DPRK. The estimated population of the county is about 40,000, of which about 18 percent can be considered “urban” (are residents of the county town). The terrain in the county is largely rough and mountainous, with intensive agriculture taking place in river valleys, and less intensive agriculture on slopes. The main crop is maize. Based very roughly on Landsat crop use intensity maps, 35 approximately 10 percent of the roughly 80,000 hectares of land in the county are used for agriculture. There are some relatively small mines producing zinc and gold in the county, otherwise agriculture and associated food processing are reportedly the main economic activities.
Residential Energy Use
Estimates of residential energy use in County A are provided in Table 5 for the years 1990 and 1998. Per-household fuel use figures for 1990 were generally taken from previous Nautilus analyses. For 1998, it is assumed that electricity use has declined 50 percent from 1990 levels (which is roughly consistent with the results of the Unhari survey described below), and that coal use has also declined by 50 percent due to difficulties with coal production and transport (as County A has no coal mines of its own). 1998 oil products use in households is assumed to be only for emergency lighting, and per-household consumption is assumed to be similar to that found in Unhari.
Public/Commercial Sector Energy Use
Public and commercial sector energy use in County A is a combination of energy use in public buildings and other facilities (government buildings, schools, public baths, and meeting halls) plus energy used in the relatively few buildings where goods and services (shops, barber shops, noodle manufacturers) are sold. The estimates of public/commercial sector energy use presented in Table 6 are based in part on national data from Nautilus’ 1997 study, and in part on Unhari survey data.
Table5: Summary Estimated Residential Energy Use in County A, 1990 and 1998
County Usage, 1990County Usage, 1998 FuelUnitsUrbanRuralTotalUrbanRuralTotal ElectricityGWh1.33.95.20.631.962.59 Coalkte3.018.020.91.497.188.67 Oil (diesel)kte0.10.10.170.010.050.06 Biomass/Woodkte72.572.576.276.2 Electricitythous GJ4.514.118.62.37.19.3 Coalthous GJ7143150236172208 Oil (diesel)thous GJ3.93.67.50.52.22.7 Biomass/Woodthous GJ010521052011051105 Total All Fuels80150115813812861325 Total Commercial Fuels8044952938182220
Table 6: Public/Commercial Energy Use in County A, 1990 and 1998
County Usage, 1990County Usage, 1998 FuelUnitsUrbanRuralTotalUrbanRuralTotal ElectricityGWh2.611.373.981.570.822.39 Coalkte0.601.662.260.481.331.80 Oil (diesel)kte—0.0030.0150.018 Electricitythous GJ9.414.9314.345.652.968.60 Coalthous GJ14.3139.8354.1411.4531.8643.31 Oil (diesel)thous GJ0000.140.650.79 Total23.7244.7668.4817.0934.8251.91
Electricity Use For Domestic Water Supply
Approximately 950 MWh were used for water pumping in County A in 1990, with 710 MWh used in 1998. These estimates are based on the per household electricity use for supplying potable water implied by the results of the Unhari energy survey, and assume that, due to electricity supply disruptions, electricity use for water pumping in 1998 was about 75 percent of that in 1990. Urban and rural demand for pumping was assumed to be proportional to population (that is, about 18 percent of pumping energy requirements are in the county town).
Industrial Energy Use
County A is reported to have only small, light industries related (mostly) to food processing, plus some smaller mines that produce both gold and zinc. Based on estimates of the power supply to the mines and assumptions about the relationship between the maximum and average power demand, 1990 electricity use in mining is estimated at about 17.5 GWh. It is assumed that 1998 usage is much less (20 percent of 1990) due to a combination of poor electricity supply, lack of spare parts for mining equipment, and lack of transportation facilities for products. Estimated 1998 electricity usage in mining is thus about 3.5 GWh. For other industries, it is assumed that County A had, in 1990, approximately the same level of per-capita electricity and coal usage as was estimated for “other industries” in Nautilus’ 1997 work. 36 Estimated electricity use for other industries in County A in 1990 was therefore about 2.5 GWh, and coal use was about 3,000 tonnes. It is assumed, as a result of the general economic decline of the DPRK since 1990, that industrial output and energy use were about 30 percent of 1990 levels by 1998, so it is estimated that other industrial activities in County A used about 0.76 GWh of electricity and 900 tonnes of coal in 1998.
Agricultural Energy, Fertilizer, and Water Use
In compiling an estimate of agricultural energy, fertilizer, and water use for County A, it was first assumed that the most intensively cultivated river-valley areas of the county (estimated at somewhat over 2,000 hectares) were likely used to grow rice. Of the rest of the estimated agricultural area, 70 percent was assumed to be used for maize, with the remaining 30 percent split as follows: 10 percent other grains (such as wheat and barley), 10 percent potatoes and vegetables, and 10 percent fruit and other permanent crops. Based on this division of use of agricultural land, and using normal (assumed to be 1990) and ” crisis” (assumed to be 1998) estimates for per-crop use of energy and other inputs obtained from working papers attached to the AREP reports (see Appendix 1 for specific references), the results in Table 7 were derived. 37
Summing the inputs and outputs described in Table 7, and adding in estimated use of electricity, coal, and biomass for food processing based on national averages (as estimated based on Nautilus’ 1997 work) and the results of the Unhari survey, yields the summary of energy use, fertilizer use, water use, and food output presented in Table 8 .
Table 7: Estimate of Agricultural Energy and other Inputs Use, and of Food Outputs, in County A, 1990 and 1998
Estimated County-wide Agricultural EnergyUse, Other Inputs Use, and Outputs by Crop: 1990 FuelUnitsRiceMaizeOther grainsPotatoes+
VegetablesTotal Electricity-IrrigationGWh2.0460.4410.1140.0922.693 Diesel Fuelkte0.2480.3810.0330.0330.696 Electricity-Irrigationthous GJ7.371.590.410.339.695 Diesel Fuelthous GJ10.7216.481.441.4430.072 Total18.0818.061.851.7739.77 Other Input/Outputs Nitrogen Fertilizer te N34665087931,175 P 2 O 5 Fertilizerte P 2 O 5 1733253838573 KCI Fertilizer te K1733254343585 Total Fertilizerte NPK6911,2991681742,332 Irrigation Waterthous m 3 10,3682,23358046413,645 Food Productionkte13.020.31.65.240.1
Estimated County-wide Agricultural EnergyUse, Other Inputs Use, and Outputs by Crop: 1998 FuelUnitsRiceMaizeOther grainsPotatoes+
VegetablesTotal Electricity-IrrigationGWh1.5350.3310.0860.0692.020 Diesel Fuelkte0.0490.0780.0070.0070.140 Electricity-Irrigationthous GJ5.531.190.310.257.271 Diesel Fuelthous GJ2.113.360.280.286.034 Total7.644.550.590.5313.31 Other Input/Outputs Nitrogen Fertilizer te N651221717221 P 2 O 5 Fertilizerte P 2 O 5 —– KCI Fertilizer te K—– Total Fertilizerte NPK651221717221 Irrigation Waterthous m 3 7,7761,67543534810,234 Food Productionkte7.614.21.22.925.8
Table 8: Summary of Agricultural Energy, Fertilizer, and Water Use, and of Food Output, in County A, 1990 and 1998
Fuel/End UseUnits19901998 Electricity-IrrigationGWh2.692.02 Electricity-OtherGWh2.011.51 Electricity-TotalGWh4.703.53 Dieselkte0.700.14 Coalkte1.761.59 Biomasskte13.4612.11 Nitrogen Fertilizerte N34665 P 2 O 5 Fertilizerte P 2 O 5 173- KCI Fertilizerte K173- Total Fertilizerte NPK69165 Irrigation Waterthous m 3 10,3687,776 Food Productionkte13.07.6 Electricity-Irrigationthous GJ9.707.27 Electricity-Otherthous GJ7.235.42 Electricity-Totalthous GJ16.9212.69 Dieselthous GJ30.076.03 Coalthous GJ42.3238.09 Biomassthous GJ195.12175.61 Totalthous GJ284.44232.43
Overall Demand for Fuels
Figure 8 presents estimates of 1990 and 1998 total energy use by fuel (non-biomass fuels only. On a county-wide basis, mining is estimated to have used the largest amount of electricity in 1990, while rural use of electricity was the largest portion of a signifcantly smaller total in 1998. Demand for coal and diesel were dominated by the rural sector in both 1990 and 1998, though 1998 use of these fuels, particularly diesel fuel, is estimated to have been much lower due to fuel supply constraints. Note that the estimates shown do not include the use of electricity or other fuels for transportation (except to the extent that fuel used for local transport of agricultural products by tractor is likely included in the diesel total), nor do they include the energy embodied in industrial products such as fertilizer that are used in the county.
Figure 8: Summary of estimated use of electricity, coal, and diesel fuel in County A, 1990 and 1998
Figure 9 focuses on rural energy use, and presents estimates of 1990 and 1998 fuel consumption by rural consuming sector for each fuel (electricity, coal, oil, and biomass). Estimated use of electricity and coal decrease substantially between 1990 and 1998, though the dominant consuming sectors remain the same in each case. Diesel use declines by almost 75 percent between 1990 and 1998, with diesel use for agriculture absorbing the bulk of the decline. Biomass use is estimated to have increased somewhat between 1990 and 1998, largely to make up for a shortfall of coal for home cooking and heating.
Figure 9: Summary of Estimated Rural Use by Sector of Electricity, Coal, Diesel Fuel, and Biomass in County A, 1990 and 1998
Electricity Supply and Reconciliation with Demand Estimates
Electricity supply in County A is reportedly provided by a mixture of power from the national grid and a number of small- to medium-size (hundreds of kW) hydroelectric power plants. It is possible that there exists an electricity grid at the county level that is functionally separate from that at the national level, although reportedly the county-level grid is integrated with, or at least connected to, the national grid. In the context of an overall national program to enhance the self-sufficiency of rural areas, there are plans to build a significant number of new small- and medium-size hydro plants in the county. Nautilus was provided with anecdotal data on the output of a particular substation in the county and on the capacity and output of the county-level power generation resources (hydro plants). The analysis described below, with its many uncertainties, attempts to reconcile the electricity demand estimates prepared as above with the partial supply data provided for the county.
Starting with an estimate of the total electricity distributed in 1998 at a substation reportedly used by 3 districts (ri) in the county, namely 1.85 GWh for “Household” uses and 8.3 GWh for “Non-Household” uses, and assuming 1) that County A has 10 ris, and 2) that other substations in the county have similar send-out per ri, total implied send-out (including distribution losses) for the county would be 6.2 GWh for “Household” uses and 27.8 GWh for “Non-Household” uses, for a total county electricity demand of about 34 GWh. By comparison, the total of 1998 demand as estimated above, assuming less industry, mining, and agriculture consumption, is 5.7 GWh. Assuming distribution losses of 10 percent, this would imply an electricity requirement of 6.3 GWh, which is fairly close to the “household” estimate derived from the substation data provided. The estimate above for “non-household” electricity use in the county is, however, significantly different from that derived via the “bottom-up” estimates described above. The estimate for agricultural and industrial/mining electricity use for 1998 described in above totals 7.8 GWh, or about 8.7 GWh when distribution losses are considered. There are several possible reasons for this discrepancy, many of which may act in concert, and none of which can be ruled out at present. First, the substation data provided may not be representative of the county, or may not have been interpreted (or, indeed, measured) correctly. Second, the end use-based estimate described above probably omitted key end uses in the county (such as pumping of geothermally-heated water through greenhouses, reportedly a significant end-use) and may have underestimated electricity consumption in other end- uses, such as mining, local industry, or processing of agricultural products. Third, the estimate does not include other sectors, such as transport (electric rail), military energy use, or other uses of electricity specific to the county that may serve to inflate the non-household portion of the electricity output of the substation for which data were provided.
Reported electricity production and related statistics in local small- and medium-size hydro power stations in County A were approximately as follows:
- Implied GWh/yr: 6.8
- Implied Capacity Factor: 70 percent
- Implied fraction of total county electricity demand supplied by local power stations, assuming 1998 demand as estimated by end-use above: 45 percent
- Implied fraction of total county electricity demand supplied by local power stations, assuming 1998 demand as estimated from substation data: 20 percent.
There are reportedly plans to build an additional 4000 kW of small and medium hydroelectric capacity in the county. Assuming that these plants operate at the same capacity factor as has been reported for the existing plants, the total output of the new and existing local plants would be roughly 32 GWh, which would be approximately sufficient to provide the county’s electricity needs at either the level as esti mated above from substation data, or at the 1990 level of consumption as estimated by sector and end use in the analysis described previously.
Probable Energy and Social Infrastructure Needs in County A
Based loosely on the analysis above, plus discussions with colleagues from the region, some of the needs for assistance that are likely to be of importance in County A include:
- Assistance with designing and implementing micro, mini, small and medium hydroelectric and wind power projects (for which there is reportedly a significant local potential in the mountainous county). Assistance focused on small-scale renewable power development of this type would likely also need to include transmission and distribution improvements.
- Assistance with energy efficiency improvements, particularly improvements in motors, piping, valves, and other infrastructure used for water pumping and the processing of agricultural products.
- Provision of supplies of fertilizer, tractor fuel, and parts for agricultural machinery.
- Assistance with the refurbishing of energy-using and electricity supply infrastructure in mines.
- Assistance with providing adequate supplies of cooking fuels (for example, LPG), as well as providing efficient electric lights and other appliances for the residential sector.
Research Needs: County Energy Flows and Energy Needs
The analysis presented in this section is clearly of, at best, an indicative nature. Improving the analysis will require additional county-specific information, including:
- Additional and better data on, as well as analysis of, the existing electricity grid (or grids) in the county, generating and substation equipment installed and planned, and refined estimates of the availability of energy resources (hydraulic and wind) that can be used to generate electricity.
- Additional and better information on, as well as analysis of, energy end uses and energy-using infrastructure (including transport)
- Additional information on county demographics and on the agricultural situation in the county.
These types of data can probably only be obtained through a combination of formal and informal surveys, plus, possibly, selective electricity use monitoring.
Unhari Village: Results of a Rural Energy Survey
In the spring and fall of 1998, a Nautilus Institute team visited a cooperative farm in the village of Unhari, in Onchon County, South Pyongan Province, on the west coast of the DPRK. For more than a month in total, Nautilus specialists worked with a North Korean technical team to plan and install a wind electric system in the village. The wind project, which now powers humanitarian needs such as lighting and a clinic refrigerator, is thought to be the first village-based technical cooperation between U.S. and North Korean organizations. 38 While in the village, the Nautilus and North Korean teams jointly conducted a survey of household and village energy use, following standard international methodologies. The purposes of the survey were to understand energy use in the village relative to the design of the wind project, to train North Korean energy specialists to carry out rural surveys, and to gain a better understanding of the rural energy situation in the DPRK ( Figure 10 ). According to researchers at the DPRK Academy of Sciences, this was the first rural energy survey of any kindconducted in the DPRK. The detailed methods and results of the survey are described in a recent Nautilus Institute report. 39 The main findings are summarized in Table 9 .
Figure 10: Nautilus Institute Wind Power Project in Unhari, DPRK, May 1998 and October 1998
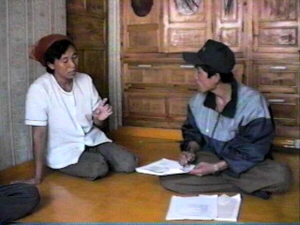

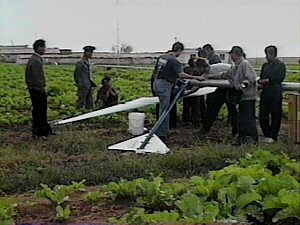
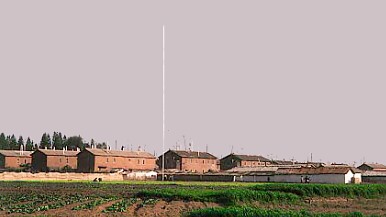
Clockwise from upper left: (1) North Korean researcher conducting rural energy survey in village household. (2) Planning session between Nautilus team and North Korean technicians and farm officials. (3) Anemometer tower raised in village vegetable field. (4) US and North Korean technicians install wind turbine. Photos: Nautilus Institute.
The March 3rd Cooperative Farm of Unhari Village consists of approximately 500 households with a total population of 2,300. The farm grows 800 hectares of paddy rice and 50 hectares of vegetables on flat, reclaimed tidelands. The principal source of irrigation water is a reservoir 30 kilometers away, though the village pumps local groundwater for domestic use and vegetable fields. Historical rice yields were reported to have been as high as 7.0 tons per hectare, but for 1998 the yield was expected to be only 3.5 tons. 40 The farm had been hit by a tidal wave in 1997 that destroyed about one-third of the dikes in its paddy fields. The farm manager complained of natural disaster damage, as well as shortages of fertilizer, tractor fuel, and electricity, and of increasing soil salinity in the reclaimed fields. 41 The farm owns 43 tractors and a variety of other electrical and mechanical equipment used in field operations, aquaculture, food processing, and workshops. During the spring and autumn of 1998, the Nautilus team witnessed that planting and harvesting were conducted by hand, while threshing was carried out using electric threshing machines. Farm income is derived from selling rice and seafood to the state at fixed prices. Average reported household cash income was 3,500 DPRK Won (approximately U.S.$1700 at official exchange rates) in addition to a share of food from the farm’s production.
Table 9: Summary of Findings of Unhari Village Rural Energy Survey
Energy consumption is shown for agriculture, residential, and public/commercial uses at the farm, in both natural and energy (gigajoules, or GJ) units. Estimates are given separately for the cooperative farm proper and two remote subsidiaries, a corn farm and a coal mine. Source: Von Hippel et al. 1999.
SectorElectricityCoalRice StrawPetroleum ProductHuman LaborDraft AnimalsTotal kWhGJTonnesGJTonnesGJ Tonnes GJ Hours GJ Hours GJ GJ Households 194,907 702 1,015 22,294 64.5 903 4.2 182 24,080 Medical & Dental Clinic 1,260 5 2.5 55 0.05 2.2 62 Kindergarten 962 3 20 439 0.01 0.4 443 Guest House 548 2 6 132 0.02 0.9 135 Workshop 29,364 106 – – 106 Bathing Facilities 350 1 8 176 0.01 0.4 177 Other Village Services 18,152 65 – – 65 Primary & Secondary School 2,639 10 50 1,098 0.05 2.2 1,110 Water Pumping 57,913 208 – 208 Agriculture (including tractors) 64.5 2,785 529,200 143 24,600 44 2,972 Rice Processsing 369,000 1,328 – – 1,328 Motor Pool (trucks and other) – – – 21.5 943 943 Emergency Diesel Generator 1.50 65 65 Total on-site at Unhari 675,095 2,430 1,101 24,194 64.5 903 90 3,916 529,200 143 24,600 44 31,630 Coal Mine & Mining Area 133,310 480 10 220 27 1,168 62,500 17 1,884 Upland Corn Farming Area 8,928 32 20 439 0.67 29.1 12,990 3.5 1,980 3.6 508 Total of Unhari use 817,333 2,942 1,131 24,853 64.5 903 118 5,113 604,690 163 26,580 48 34,023
Individual families live in 65 to 70 m 2 apartments with traditional Korean ondol stoves in two-story brick-and-mortar, tile-roofed buildings. The 67 households surveyed all have electric wiring, incandescent lighting, and televisions. Most have clothes irons and fans, and one-sixth have refrigerators. All households use coal briquettes for cooking and heating, made by household members out of crushed coal from a local mine owned by the village; some use rice straw as a supplementary cooking and heating fuel, and most use diesel fuel and batteries to provide supplementary lighting during power outages. Many households own variable transformers to protect their electrical equipment from low and erratic grid voltage, which averaged 180 VAC (out of a nominal 240 VAC) during the Nautilus visits. Households reported that they normally experience lengthy power outages about one day in five, with much greater frequency during the winter. Virtually all households use their full allotment of two tons of coal per year, for which they pay 40 won per ton, and an estimated average of 400 kWh of electricity per household, for which they pay a fixed price of one won per month. There are no electric meters in the village.
Estimates of total energy use at Unhari, based on the rural energy survey results, are given by activity (agriculture, residential, and public/commercial) and fuel type in Table 9. As might be expected, estimates for the real farm at Unhari show both similarities and differences when compared to estimates for the average North Korean farm in Table 4. Electricity use for households and agricultural processing is very close to the expected “Crisis” level for typical farms. Human and animal labor are close to the expected “Crisis” levels on a per hectare basis. Coal use in Unhari is close to the “Recovery” level in Table 3, which is explained by the fact that the Unhari farm operates its own coal mine and transports the coal to the village with its own tractors. (Looked at another way, due to its favored conditions, Unhari’s consumption validates the “Recovery” estimate.) The availability of sufficient coal in Unhari also explains the very low reported consumption of biomass fuels there. Diesel fuel use in agriculture on a per hectare basis is similar to “Recovery” levels in Table 4, which could be attributed to the relative wealth and proximity to fuel supplies of the March 3rd farm. It is also possible that this estimate is based on a misunderstanding between the survey team and farm officials, in which the reported level of consumption was based on desired rather than actual use. Some important data not obtained in the Unhari survey, to be addressed in a subsequent follow-up survey, include fertilizer consumption and electricity consumption in off-farm irrigation pumping, which could easily be 20-30 times the reported on-farm level.
Despite some anomalies and omissions in the survey data, comparing the Unhari survey results with the picture gained from looking at national aggregate figures ( Tables 2-4 ) broadly confirms several key points about rural energy in the DPRK:
- Households depend on coal for heating and cooking. Adequate coal supplies greatly relieve pressure on biomass resources.
- Agricultural field operations depend on diesel fuel. Lack of sufficient diesel fuel greatly increases human and animal field labor requirements.
- Agriculture and households are highly vulnerable to electricity shortages, as there are no adequate substitutes for electricity in irrigation water pumping and household lighting and appliances.
Observations by the Nautilus team and discussions with Unhari farm officials also confirm the general conclusion that crop yields have fallen drastically, and that this is due most immediately -reported natural disaster impacts notwithstanding-to the direct and indirect effects of rural energy shortages, including shortages of fertilizer.
Rehabilitating The DPRK’s Rural Energy System
Benefits of Rural Energy Sector Rehabilitation
Improving the DPRK’s rural energy situation is feasible, desirable, and affordable from both humanitarian and geopolitical perspectives. To the extent that improved bilateral relations between the United States and the DPRK allow the process of rebuilding the DPRK’s infrastructure to begin, rural energy is a particularly appropriate and beneficial area of initial focus for public and private donors and investors, bilateral and multilateral.
The primary and most direct benefit of rural energy sector rehabilitation would be to restore North Korean agriculture to normal operation. To take maximum advantage of improved energy supply, rehabilitation efforts should be undertaken in tandem with other technical improvements in agriculture as outlined in the AREP and IFAD reports, such as restoring cropland damaged by flooding, diversifying crops, removing marginal land from production, and developing improved seeds. Nonetheless, as is clear from the reports of international agricultural experts, provision of sufficient energy inputs is the central and most costly element of agricultural rehabilitation. With a secure energy supply available to agriculture, the DPRK would be in a position to produce adequate food for its own consumption and to eliminate or greatly reduce its need for food aid.
Restoring the energy supply to agriculture would have the collateral benefit of helping to maintain the stability of rural society. As the urban industrial infrastructure has collapsed, rural areas have remained the intact backbone of North Korean society. Village life and traditions remain relatively stable, and local leaders such as farm managers retain a measure of authority based on their functional leadership. Farms have even been able to absorb and feed some of the excess urban population during the present crisis. Nonetheless, the capacity of rural areas to survive continued shortages of inputs, degradation of agricultural ecosystems, and personal privation is probably not unlimited. The rural sector currently has little resilience with which to cope with major new natural disasters, or man-made disasters such as an untimely collapse of the irrigation system. Restoring an adequate rural energy supply can do much to stave off social collapse in the rural areas, avoid dangerous regional fragmentation scenarios, and maintain a societal building block for the future.
On a geopolitical level, rural energy system rehabilitation would present relatively little risk of diversion by the North Korean military, as the amounts and types of energy inputs needed for agricultural and rural consumption do not conform well to military requirements. In the cases where they do, diversion from agriculture could be relatively easily monitored. Rural energy rehabilitation also does little to directly restore North Korean heavy industry and its ability to maintain a high level of military production. Rather, restoring rural energy supplies helps to stabilize the food situation while permitting time for the development of plans for international economic assistance to accompany concrete improvements in the military/security situation. At the same time, restoring the rural energy sector is consistent with different long-term economic reconstruction scenarios, whether Chinese-style reforms or a “chaebolization” model consistent with economic integration with South Korea. It would do so by restoring the food supply to urban workers, stimulating overall reforms of the energy sector, and freeing up rural labor for export-oriented production of light industrial or agricultural specialty products. From a U.S. perspective, involvement in the relatively low cost, low military-risk task of improving the DPRK’s rural energy supply allows the United States to take a substantial initiative, rather than leaving China by default in the role of long-term guarantor of the DPRK’s food supply and principal arbitrator of the DPRK’s international relations. At the same time, rural energy rehabilitation in the DPRK offers ample opportunities for bilateral and multilateral cooperation with China, Russia, Japan, and South Korea.
Among the benefits of rural energy sector rehabilitation is the fact that it is conceivable. In contrast to the profound conundrums faced in reforming North Korean industry, the energy problems of the rural sector seem, if not necessarily easy to solve in practice, at least conceptually straightforward. There do not currently exist reliable economic statistics for the DPRK, nor a large cadre of international experts with experience there. In this light, rural energy rehabilitation constitutes a very significant but not completely daunting first step toward future economic reconstruction on a national scale. Rural energy rehabilitation lends itself to pilot programs, incremental steps, linkage to experimental reforms, and an initial focus on limited geographical areas. Such approaches allow an opportunity for the collection of realistic data, better assessment of technology inventories, and better estimates of supply and demand. One could argue that rural energy rehabilitation is a necessary step to provide the knowledge and experience baseline for planning the full-scale rehabilitation of the DPRK’s national energy infrastructure, which is in turn the key to restoring the entire North Korean economy.
From the perspective of international assistance to the DPRK, rural energy sector rehabilitation is financially feasible. Capital costs will be at least an order of magnitude less than the cost of rebuilding the entire national energy infrastructure. On an annual basis, costs will be comparable to the current funding parameters for international food assistance and KEDO. The reason for the relatively low cost of rural energy rehabilitation is simple. Less than one-third of the North Korean population is rural; rural household per capita energy use is lower than urban household per capita energy use; and the agricultural sector uses less energy than the industrial sector. Quantitatively, in 1990 the rural sector (including the agricultural, residential, and public/commercial subsectors) consumed only 130 petajoules out of a national total of 1,204 petajoules of commercial energy, or 10.8 percent. From the perspective of the shortfalls described earlier, the current shortfall in commercial energy in the rural sector is estimated at 52 petajoules, out of 613 petajoules for the DPRK as a whole, or 8.4 percent. 42 Rural sector energy use is about one-tenth the national total, and, roughly speaking, energy costs will follow this pattern. Some specific cost estimates for rural energy rehabilitation are given in the next section.
Elements of a Rural Energy Rehabilitation Program
The main components and costs of a hypothetical rural energy rehabilitation program for the DPRK are outlined in Tables 10-11. The goal of a rural energy rehabilitation program would be to provide the modern energy inputs necessary to allow North Korean agriculture to recover a sustainable production level and the basic needs of the rural population to be met. The priority areas would be those for which energy shortfalls most seriously affect agricultural production, human health, and fundamental quality of life. These areas include maintenance of soil fertility, farm mechanization, irrigation and drainage, and lighting, heating, cooking, and refrigeration for households and essential public institutions such as clinics and schools.
A comprehensive rehabilitation program for rural areas would feature a combination of short to medium-term energy supplies from imports and medium to long-term capital construction and rehabilitation projects. Components of an import program would include fertilizer, tractor fuel, and electricity at levels sufficient to enable agricultural recovery in the shortest attainable time. The capital construction program would include projects necessary to achieve the sustainable rehabilitation of the North Korean rural energy sector in the medium term (approximately 5 years). It is possible to outline some of the main elements of such a program: rehabilitation of the rural electricity transmission and distribution grid, development of reliable local power generation, improving the energy efficiency of the irrigation and drainage system, modernizing fertilizer and tractor factories, and improving the transportation of agricultural inputs and products. Many of these projects have already been proposed in the context of UN-sponsored agricultural reconstruction studies. In Tables 10 and 11 , the costs and financial trajectory of a theoretical rural energy rehabilitation program are explored, using rough estimates based on comparable costs elsewhere in the region. The next sections discuss some of the challenges facing the selection and implementation of projects in a rehabilitation program, and some of the qualities that will be necessary for a project to successfully address these challenges.
It is clear that many detailed questions pertaining to the technical specifications and costs of a major investment program, the division of financial burdens between DPRK and foreign sources, and between public and private capital, the determination of the desirable and achievable balance between energy imports and domestic supplies, and the integration of rural energy sector reforms with the long-term rationalization and reform of the North Korean economy as a whole, must be studied and negotiated at great length. Similarly, analysis of investments in very large energy projects that would potentially benefit not only the rural sector but the entire economy (including the military)-such as interconnection of the DPRK to Northeast Asian regional electricity grids and hydrocarbon pipelines; the construction and re habilitation of major hydroelectric stations, thermal power plants, coal mines, and oil refineries; and the improvement of energy efficiency in transportation and industry-will require extended and painstaking political and economic analysis. Implementation of such projects will require a much greater level of resolution of outstanding political and military questions than currently exists, and substantial steps toward the integration of the DPRK with the international economy.
Table 10: Rural Energy Import Requirements (Worst Case)
Energy TypeNeed AddressedTotal RequirementAnnual ShortfallInt’l PriceAnnual Cost Fertilizersoil fertility750,000 tons (NPK)600,000 tons (NPK)$300/ton (NPK)$180 million Electricityirrigation, food processing, lighting3.0 billion kWh1 billion kWh$.05/kWh$50 million Fueltractors, small engines150,000 tons100,000 tons$270/ton$27 million Coalcooking and heating4 million tons1.5 million tons$50/ton$75 million Total$332 million
Table 11: Rural Energy Capital Construction Requirements
ProjectCapacityNeedCapital Cost Electrical Generation500 MWMeet peak demand during irrigation and threshing season$500 million Rehabilitate Rural T&D System60,000 km, 3 GVAReduce losses, increase reliability$300 million Rehabilitate Irrigation System6 million m 3 /yearImprove energy efficiency and reliability of water delivery $250 million Fertilizer Factory Modernization500,000 ton/yearIncrease domestic fertilizer production$100 million LPG Storage and Pipeline System200,000 ton/yearElectrical generation, transportation fuel, household and public cooking and heating$250 million Tractor Factory Modernization75,000 tractorsService and upgrade tractor stock, possibly convert fuel types$100 million Improve Rural Transportation200 million km-tonsNew vehicles improve roads and railways$250 million Total$1,750 million
Figure 11: Investment Trajectory for 5-year North Korean Rural Energy Sector Rehabilitation Program
Costs are as outlined in Tables 10 and 11. Annual costs in current-year U.S.$.
These caveats notwithstanding, the approximate economic scale of a rural energy rehabilitation program can be seen in Tables 10 and 11, and in summary form in Figure 11 . 43 This program is based on worst- case assumptions about North Korean import needs and rehabilitation costs. This is useful for setting an upper bound on costs for discussion purposes, but it should be noted that an actual program might be substantially less expensive. Table 10 describes a program of full import support to make up for rural energy shortfalls, assuming that the DPRK makes no more direct foreign purchases than it does at present. The result is a worst-case import program roughly comparable in cost to current food aid programs, in the neighborhood of $332 million per year. Table 11 assumes the highest reasonable level of capital costs, assuming that many unusual costs would be borne under North Korean conditions. The result is an estimated $1.75 billion in capital investments in current-year dollars. These results are combined in Figure 11, which calculates estimated levelized costs based on a five-year program with a declining trajectory for import supports (from $332 million per year in the first year to $66 million per year in the last year), a ramped-up trajectory for capital investment, a 10 percent discount rate, and a five-year payment period. It is assumed that the DPRK assumes all costs following the completion of the five-year program.
Obstacles and Solutions
The principal obstacles facing the rehabilitation of the DPRK’s rural energy system through international cooperation arise from the country’s overall economic collapse, lack of foreign exchange, hostile relations with other states, and the U.S. sanctions policy. If U.S.-DPRK diplomatic relations were to dramatically improve, accompanied by other developments such as an end to economic sanctions, World Bank membership, and access to international finance, many other problems would still confront rural energy projects. These include the issues of securing funding, avoiding potential military diversion, reversing the legacy of failed agricultural policy, and overcoming the effects of cultural and technical isolation. Below are some of the main challenges that must be faced-and some thoughts on the characteristics that will be required-for a rural energy rehabilitation program to be successful.
Finding Sources of Capital and Revenue to Pay for Rural Energy Rehabilitation
International donors, after looking carefully at the costs and benefits of restoring rural energy supplies in comparison to current forms of support for the DPRK such as food aid, should strongly consider shifting the principal focus of their assistance to rural energy rehabilitation.
Within the DPRK, rural energy rehabilitation should be implemented in conjunction with institutional and energy price reforms that would put the rural energy economy on a more sustainable footing. An initial step might be the creation of rural electric cooperatives that raise revenues to rehabilitate rural electric grids by installing meters and charging for consumption, and in fact there is anecdotal evidence that the North Korean government is beginning to encourage local markets for electricity in order to spur local development of generation resources. 44 The addition of local generation to the current DPRK grid, however, may have some implications for grid stability and safety that need to be considered carefully. The DPRK should allow foreign investors to seek opportunities for cost-effective investments with reasonable rates of return. An example might be rural energy projects that directly enable revenue generation and foreign exchange earning, by providing energy for growing agriculture specialty products or by developing rural light industries0.
Avoiding Military Diversion of Energy Supplies
Projects must have very limited military diversion potential. This limited diversion potential can be either inherent, in the specific types of energy supplies or technologies deployed, or because verification of diversion or non-diversion can be obtained through simple measures. For example, diesel fuel has an obvious military diversion potential. Programs to supply diesel fuel for agricultural uses must be able to confirm by inspection that the fuel is being used for agricultural purposes.
Reforming Failed Agricultural Policies and Institutions
Many of the current problems in agriculture originate from the DPRK’s self-sufficiency doctrine and its rigid implementation through the country’s central planning organs. Implementation of the self-sufficiency doctrine has led to misallocation, mismanagement, and insufficient local control. Long-term cost-effective rural energy projects and supply options can only be identified and implemented in the context of a reformed agricultural economy. This reformed economy must include a strong market element that emphasizes international comparative advantages for agricultural products, encourages nascent local markets, and provides credit and decision-making autonomy to farmers.
Overcoming Disaster Damage and Long-Term Degradation of Agricultural Ecosystems
North Korean agriculture suffers at its roots from the legacy of having too much unsuitable land in production and using excessive amounts of agricultural chemicals. These policies have left agricultural ecosystems vulnerable to the natural and man-made disasters of the 1990s. Presently, North Korean agricultural ecosystems suffer from the destruction of fields due to past flooding, severe erosion, nutrient depletion, chemical saturation, and increasing salinity. They may also suffer from the presence of toxic substances, such as heavy metals introduced into the ecosystem in slag and coal ash used as fertilizer. 45 To be effective in the long run, rural energy rehabilitation must be accompanied by other efforts to build a sustainable and resilient agricultural system. The provision of adequate commercial energy inputs should progress in parallel with reducing acreage and chemical dependence, encouraging crop diversification, and restoring soils and ecosystems.
Overcoming Regional Discrepancies and Distributional Failures
Food aid workers report that famine conditions have been worst in the DPRK’s mountainous regions and northeastern provinces. According to a 1990 UN report, poverty and food shortages existed in these areas years before the current crisis. 46 This situation may be due to poor natural resource endowments and the difficulty of transportation in remote areas, or perhaps, as some critics have asserted, to North Korean government lack of concern for the residents of these areas because they are considered “politically unreliable.” Whatever the cause, it is clear that pockets of unusual poverty, even by North Korean stan-dards, exist in the DPRK. It is likely that rural energy problems are especially severe in these locations. In order to achieve its humanitarian goals, a rural energy rehabilitation program must address the energy problems of remote poverty areas as well as more-favored and more-accessible areas of the DPRK.
Overcoming Momentum for Reusing Existing Equipment Stock
The DPRK’s energy infrastructure reflects past technological choices, which in turn reflect its self-sufficiency doctrine and the DPRK’s position in the former Soviet-bloc barter economy. Some of the distinctive features of the DPRK’s infrastructure include coal-based fertilizer production, electric railways, and Soviet-standard electricity infrastructure. Much of the equipment, from rolling stock to irrigation pumps, is oversized and inefficient, and much of it does not currently operate due to lack of spare parts. Still, there may be momentum in the DPRK to rehabilitate and continue using existing technology, due to a combination of local familiarity with existing equipment and the high up-front cost of replacing equipment stocks. A rural energy infrastructure rehabilitation program should take the long-term perspective where possible and emphasize technology that is more energy efficient, safer, more environmentally benign, and more interchangeable with regional and world technical standards, than is the current North Korean technology stock.
Overcoming Emphasis on Energy Supply, Rather than Reducing Demand
Planners and technical personnel in the DPRK’s energy sector exhibit a strong orientation toward increasing energy supply as the sole solution to energy shortfalls, and demonstrate little awareness of more contemporary approaches that focus on reducing demand as a least-cost energy option. The prevailing orientation reflects the DPRK’s distinctive engineering culture, which has been heavily influenced by Soviet-style education and isolation from the rest of the world. Rural energy rehabilitation programs must make capacity building among DPRK specialists a central element to be successful, as actual project implementation will almost certainly be taken over by North Korean engineers and technicians. Capacity building should include technical exchange, training in energy analysis, and the provision of up-to-date information on energy efficiency, demand-side management, and integrated resource planning, to complement and balance the inevitable emphasis on energy supply technologies.
Overcoming Barriers to Technology Transfer
An infrastructure rehabilitation project in the DPRK using imported technology would face many obstacles to technology transfer. Foreign companies may be reluctant to provide state-of-the-art technology to a country with no foreign exchange, small market potential, and a reputation for engaging in reverse engineering. From the North Korean perspective, there may be concerns about technology shock and dependence on imported technology. Rural energy rehabilitation projects should avoid these problems by keeping technology choices as simple as possible, focusing on technologies that are amenable to local manufacture and joint ventures.
Overcoming the Lack of Reliable Technical Information
The DPRK’s closed society and rigid bureaucratic culture makes reliable technical information very difficult to come by for foreigners, and even for Koreans themselves. Missing or unreliable blueprints, statistics, legal codes, and regulations make technical project design and budgeting extremely difficult. For rural energy rehabilitation projects, obtaining information first-hand through energy surveys and technology inventories will be essential. Planning how to gain access to adequate information must be on the initial checklist for every project. The creation of a general database on North Korean rural energy, with participation by both North Korean and foreign experts, will be an indispensable practical foundation for rural energy rehabilitation, as well as for other economic reconstruction projects.
Reducing the Impact of General Economic and Infrastructure Collapse
Insofar as is possible, rural energy projects should be technically and economically insulated from the limitations of the rest of the North Korean economy. Projects should not depend for their success on the supply of goods and services from unreliable sources. At the same time, projects should be devised so as to contribute to a general economic recovery in the DPRK, rather than to form a drain on the economy. Local production should be encouraged where feasible.
Overcoming Mistrust Between North Koreans and Foreigners
Long isolation and suspicion between North Koreans and foreigners will complicate rural energy rehabilitation projects. Food aid workers report that working relationships with North Korean colleagues and institutions generally improve with time and familiarity. Rural energy rehabilitation projects will benefit greatly from transparent and businesslike dealings that inspire trust, as well as from the use of written agreements that explicitly spell out rights and responsibilities. The costs of providing technical exchange and education opportunities for North Korean technical and administrative personnel must be seen as a necessary investment, not only in a shared knowledge base, but also in person-to-person and culture-to-culture contact. Chinese bilateral and multilateral participation in rural energy projects is also essential, because of technical, cultural, and political affinities. South Korean and overseas Korean participation also has obvious benefits and should be included whenever feasible.
Assessing Projects
A sample framework for assessing potential rural energy rehabilitation projects in the DPRK is described in Figure 12 . Many other criteria may also be included. Project decisions must take account of a wide variety of factors, both quantitative and qualitative. The most successful projects will be cost-effective in improving energy supplies, contributing to higher crop yields, and/or reducing field labor requirements. They will also contribute a variety of intangible benefits, such as facilitating economic reform and the opening of the DPRK to the outside world.
A key practical issue in initiating rural energy rehabilitation projects is the question of scale. How can the financial and technical capabilities of institutions-multilateral banks and other organization, bilateral lenders or donors, private businesses, or NGOs-best be matched to needs and capacities within the DPRK? One way to begin approaching the problem is to compare the scale of outside resources available for commitment to a project to the scale of needs at different levels of North Korean administration. Figure 13 shows a simplified representation of these layers, from the national level down to the cooperative farm. At each level, average figures regarding current food and energy shortfalls are provided, based on the figures in the section on rural energy profiles. Average amounts of investment associated with each level, given the hypothetical $2.3 billion overall budget for a nationwide rural energy rehabilitation program sketched the section on elements of a rural rehabilitation project are also provided. Figure 13 should not be taken as quantitatively rigorous, but rather as a tool for quickly “scoping” scales of need and resources.
Figure 12: A Framework for Comparing Rural Energy Rehabilitation Projects
Projects can be compared on quantitative grounds according to the cost-effectiveness of their contributions to energy supply or agriculture. They can also be compared on more qualitative grounds.
Figure 13: Administrative Levels and Corresponding Scales of Energy and Agricultural Shortfalls in the DPRK.
Scales of average investment at each level for a presumed total national investment of $3 billion are also given.

Next Steps in Assisting the DPRK in Addressing Rural Energy Needs
Difficulties with obtaining accurate information regarding the DPRK in general, and the rural energy situation in the DPRK in particular, are daunting. As a consequence, although this paper has made a start on the evaluation of options and approaches for rehabilitation of rural energy systems in the DPRK, there are still many topics that must be addressed before an effective rural revitalization program can get underway. Some (and only some) of the topics that need to be explored in greater detail in the future are described very briefly below.
Rehabilitating the DPRK’s National Energy Infrastructure
The decline in rural energy infrastructure is a symptom of the decline, since at least 1990, in the DPRK’s overall national energy system, as discussed earlier in this paper. Ideally, rehabilitation of rural energy infrastructure would be a part of a program for the overall rebuilding of the country’s energy system, and, indeed, its economy. Practically speaking, starting on a smaller scale may be likely to work in the DPRK for a variety of reasons relating to internal and external politics, among other factors. Nonetheless, any sizable (for example, county-level) program of rehabilitation of rural energy systems in the DPRK should be founded in at least a general overall strategy for rehabilitation on a national scale. This type of overall strategy has yet to be elaborated.
The Military Implications of Rural Energy System Rehabilitation
Given international concerns about the DPRK’s military status, any program of rural energy rehabilitation with input from outside the DPRK (and especially inputs from the United States and its allies) must undergo considerable scrutiny as to potential for diversion of equipment and material for use by the DPRK military. Although this topic has been discussed briefly in this paper, it is clear that a much more in-depth review of options for diversion must accompany any detailed proposal for assistance with rehabilitating the DPRK’s rural energy system.
Geopolitical and Regional Implications of Rural Energy System Rehabilitation
The presentation in this paper of needs and options for the revitalization of rural energy in the DPRK rests on the assumption that a such revitalization is desirable a) on humanitarian grounds, and b) because a DPRK that is better able to feed and provide energy services to its people is more likely to be a better member of the international community, and one more willing to work toward reducing tensions in the region. There are, however, other points of view on this topic that should probably be explored during the formulation of rural energy system rehabilitation programs for the DPRK.
Justification of Rural Rehabilitation Program Investments
The estimates of rural rehabilitation program costs presented in this paper are not, and are not intended to be, more than order-of-magnitude estimates designed to assist in “scoping out” possibilities. Actual implementation of a rehabilitation program at any significant level will require a much more detailed review of the costs and benefits involved in a particular program. How much will the program cost, by element? Who in the DPRK will benefit from the program? Is the program designed to be self-sustaining? How do the benefits of the program, both tangible and intangible, compare with the benefits that can be expected from other uses of aid money? These questions, and others, need to be addressed during the detailed specification of any rural rehabilitation program. That said, it is important to recognize that at least for the first several rehabilitation projects undertaken, the lack of information about the DPRK situation (plus political, logistical, and many other concerns) will make even approximate “optimization” of rural rehabilitation investment next to impossible.
County-level Project Elaboration
This paper has discussed county-level project possibilities in only the most general of terms. A more detailed program of county-level rehabilitation of rural energy systems can be designed, but more information will be required. This information can only be obtained via cooperation with DPRK authorities. The indicative county-level analysis presented earlier provides a hint as to the types of information that will be required, along with some of the data difficulties that can be expected. In addition to energy data, information will be needed on both the local economy and on the potential for local economic changes that could make a county-level rehabilitation effort self-sustaining. This type of information will, at least in the near term, be very difficult to obtain in any detail in the DPRK.
Costs of Specific Alternatives
The costs of the alternatives suggested in this paper, including costs for both goods (such as fertilizer) and equipment (factories for tractor parts) are in general only rough guesses. The technical and economic parameters of all the alternatives should be investigated in much more detail before decisions are made as to whether to pursue rural infrastructure projects.
Impact of Rural Energy Problems (and Solutions) on the Stability of Rural Society
Some of the potential impacts of energy problems on rural society in the DPRK were touched on briefly earlier in this paper. The successful implementation of programs to rehabilitate rural energy systems in the DPRK will require a more thorough assessment. How, for example, has the energy problem affected rural society in recent years? What impact will the rehabilitation program have on rural society? What impact will it have on the interaction of rural society with government in the DPRK (and vice versa)?
Conclusion
In this paper, the authors have attempted to describe, in a quantitative (albeit rough) fashion, the manifold difficulties faced by people in the rural DPRK in obtaining energy services, and some of the potential means that outsiders may have of helping to address those difficulties. The key is clearly to facilitate the process in such a fashion as to allow rural energy rehabilitation to be self-sustaining-to “pay its own way.” To accomplish this, assistance projects will need to take full advantage of fledgling efforts in the DPRK to allow more local economic autonomy, as well as working through existing central government channels.
Notes
- Von Hippel, D. F., and Peter Hayes, Demand and Supply of Electricity and Other Fuels in the Democratic Peoples’ Republic of Korea (DPRK) (Berkeley, Calif: Nautilus Institute, 1997), 15-17.
- Hunter, Helen-Louise, Kim Il-Song’s North Korea (New York: Praeger, 1999), 196.
- Von Hippel and Hayes 1997, 94, A1-1.
- Ibid., 94.
- Ibid.
- Ibid., 91.
- Ibid.
- FAO/WFP, Special Report: FAO/WFP Crop and Food Supply Assessment Mission to the Democratic People’s Republic of Korea, 29 June 1999, 4; United Nations Development Programme and the UN Food and Agriculture Organization, DPR Korea: Agricultural Recovery and Environmental Protection (AREP) Program, Identification of Investment Opportunities, Vol. 2: Working Papers 1-3 (New York: UN, 1998), Working Paper 3: 11-26. (Hereafter AREP 1998 WP3).
- FAOSTAT 1999, available at http:/apps.fao.org. According to DPRK figures provided to FAO, about 20 percent of phosphate fertilizer, and all of potassium fertilizer were imported. Potassium fertilizer is not produced domestically.
- FAO/WFP 1999, 4; AREP 1998, WP3:11-26.
- AREP 1998, WP3:Appendix 1, Fertilizer Request
- Peter Hayes, eyewitness account while on UNDP mission.
- Von Hippel and Hayes 1997, A1-50. Roughly 40 percent is used for feedstock.
- Urea (46 percent nitrogen) is $150/ton. DAP (di-ammonium phosphate, 18 percent nitrogen, 46 percent phosphate) is $250/ton. AREP 1998, WP3:Appendix 1, Fertilizer Request.
- AREP 1998, WP2:2.
- AREP 1998, WP2; and IFAD, DPRK Reconnaissance Mission Report (Rome: International Federation of Agricultural Producers, 1990). The 75,000 tractors are concentrated in the approximately 1.1 million hectares of prime rice and maize land, yielding an average of about 7 tractors per 100 hectares.
- AREP 1998, WP2:Appendix 1, 14.
- Ibid., Appendix 1, 11.
- Von Hippel and Hayes 1997, A1-1
- Ibid., A1-2, estimates 35,000 tons (1.5 PJ). AREP1998, WP2:2, estimates 20 percent of pre-crisis levels.
- Von Hippel and Hayes 1997, A1-9, “Estimated Energy Balance for the Year 1996: Refined Products by Product Type.”
- Ibid., A1-34. Military diesel use is estimated to have declined from 200,000 tons of diesel in 1990, to 160,000 tons in 1996.
- Ibid., A1-7, A1-9.
- AREP 1998, WP2:2.
- AREP 1998, WP1:6. The irrigated area is 980,000 hectares. See AREP, WP1, 14, for a description of the irrigation system, which includes 32,000 pumping stations, 2,000 km of 0.3-1.5 m steel pipe, and over 10,000 km of canals.
- See AREP 1998, WP1:9, for irrigation needs of different crops. These figures are measured at the source.
- Ibid. Based on actual data for the Pyongnam irrigation district, which contains 10 percent of the total irrigated area of the DPRK, and extrapolated to the rest of the country. The average lifting head in Pyongnam is 50 meters, and this is assumed to hold for the rest of the country. Pumpset efficiency is estimated at 69 percent.
- Von Hippel and Hayes 1997, A1-61.
- AREP 1998, WP1:11.
- See Von Hippel et al. 1997; AREP 1998; and WFP 1999.
- Von Hippel et al. 1997.
- Sources used to calculate the figures shown in Tables 2-1 through 2-3 include Von Hippel and Hayes 1997; David F. Von Hippel et al., Rural Energy Survey In Unhari Village, The Democratic People’s Republic Of Korea (DPRK): Methods, Results, And Implications (Berkeley, Calif.: Nautilus Institute 1999); FAO/WFP 1999: and UN 1998.
- Von Hippel and Hayes 1997.
- Von Hippel et al. 1999.
- UN Environment Programme Global Resources Information Database 1998, The Democratic People’s Republic of Korea Crop Use Intensity, Interpreted from Landsat TM and MSS Images (Sioux Falls, S.D.: UN Environment Programme Global Resources Information Database, 1998).
- Von Hippel and Hayes 1997.
- “AREP” refers to the three-volume series DPR Korea: Agricultural Recovery and Environmental Protection (AREP) Program, Identification of Investment Opportunities, compiled by the United Nations Development Programme and the UN Food and Agriculture Organization. Volume 1 contains the Main Report, Volume 2 contains Working Papers (WP) 1-3, and Volume 3 contains Working Papers 4-6.
- James H. Williams et al., ” The Wind Farm in the Cabbage Patch,” Bulletin of the Atomic Scientists (May/June 1999): 40-48.
- Von Hippel et al. 1999.
- Personal communications with Unhari farm manager, May 1998 and September 1998. The 7.0 tons/hectare figure is supported by the 1990 IFAD DPRK Reconnaissance Mission Report. The neighboring farm in Unhari, which operates under very similar conditions, reported a rice yield of 7.0 tons/hectare in 1989.
- It is not clear if the increasing salinity of the fields at Unhari was due to saltwater intrusion from the ocean, or to inadequate freshwater flushing of the fields. In either case the ultimate culprit may have been a shortage of electricity to accomplish the necessary water pumping.
- This does not include the embedded energy value of fertilizer. The rehabilitation program calls for direct import of fertilizer, until and if North Korea restores its own fertilizer production. If fertilizer were included at its embedded energy value, it would add another 53 PJ, doubling the rural share of current shortfall.
- Among the options presented in Table 10, the LPG/natural gas pipeline option should probably be considered as a longer-term possibility, with considerable uncertainty as to its technical feasibility and cost-effectiveness. It may be, for example, that provision of LPG in cylinders to supplement household cooking fuels is a more reasonable short-term option.
- See Ri Soong Pil, ” Construction of Medium Hydroelectric Plants for Comprehensive Development of Local Economies,” Economic Study (DPRK) no 3, 1999; and “DPRK Eager To Build Power Plants,” Korea Times, 16 November 1998.
- Von Hippel et al. 1999, analysis of coal from Unhari.
- IFAD 1990.
Appendix 1: Summary of Sectoral Demand Estimates
Estimate Of County-Level Energy Consumption For An Indicative Rural County In The Democratic Peoples’ Republic Of Korea
Prepared by:David Von Hippel Date last modified:12/31/99 Summary of Sectoral Demand Estimates Estimated Energy Use by Fuel in 1990Estimated Energy Use by Fuel in 1998 ElectricityCoalOil (Diesel)BiomassElectricityCoalOil (Diesel)Biomass Sector/Sub-sector/End UseGWhktektekteGWhktektekte Rural Residential3.9317.960.0872.551.967.180.0576.17 Public/Commercial1.371.66-0.821.330.02 PotableWater0.780.59 Agricultural4.701.760.7013.463.531.590.1412.11 TOTAL OF RURAL10.7821.380.7886.006.9010.100.2188.28 Urban (County Town) Residential1.252.980.09-0.631.490.01- Public/Commercial2.610.60-1.570.480.003 Potable Water0.170.12 Light/Local Industry2.533.030.760.91 TOTAL OF URBAN6.566.610.09-3.082.880.01- Mining (Zinc/Gold)17.523.50 OVERALL COUNTY TOTAL34.8627.990.8786.0013.4812.970.2288.28 Estimated Energy Use by Fuel in 1990Estimated Energy Use by Fuel in 1998 ElectricityCoalOil (Diesel)BiomassTOTALElectricityCoalOil (Diesel)BiomassTOTAL Sector/Sub-sector/End UseThousand GJThousand GJ Rural Residential14.154313.651,0521,5017.071722.241,1051,286 Public/Commercial4.9340–452.96320.65-35 Potable Water2.82—32.12—2 Agricultural16.924230.0719528412.69386.03176232 TOTAL OF RURAL38.8251333.721,2471,83324.842428.921,2801,556 Urban (County Town) Residential4.5071.503.87-79.92.2535.750.47-38.5 Public/Commercial9.4114.31–23.75.6511.450.14-17.2 Potable Water0.60—0.60.45—0.4 Light/Local Industry9.0972.73–81.82.7321.82–24.5 TOTAL OF URBAN23.60158.533.87-186.011.0769.010.61-80.7 Mining (Zinc/Gold)63.07—372.012.61—161.4 OVERALL COUNTY TOTAL125672381,2472,39149311101,2801,798
County Overview for Graphic
19901998 SectorElect.CoalDiesel Elect. Coal Diesel Rural 38.82 513.1 33.72 24.84 242.35 8.92 County Town 23.60 158.53 3.87 11.07 69.01 0.61 Mining 63.07 12.61
Rural End-Use Estimate for Graphic
Electricity Coal Diesel Biomass Sub-sector/End-Use 1990 1998 1990 1998 1990 1998 1990 1998 Residential 14.15 7.07 431.00 172.40 3.65 2.24 1,052 1,105 Public/Comml 4.93 2.96 39.83 31.86 – 0.65 – – Potable Water 2.82 2.12 – – – – – – Agricultural 16.92 12.69 42.32 38.09 30.07 6.03 195 176
Appendix 2: Demographic and Agricultural Statistics
Estimate Of County-Level Energy Consumption For An Indicative Rural County In The Democratic Peoples’ Republic Of Korea
Notes/Sources:
- Estimated by colleague from the region. Consistent with information, also provided by colleague from the region, that each county has 9 to 20 “Ri”, or districts, and each “Ri” has 1000 to 1500 households, or about 4000 to 6000 people.
- Based on estimate of population of county town (6-7,000) by colleague from the region. Seems similar to size of Onchon county town as noted during Nautilus mission to Unhari village of 1998. Overall maps of the DPRK available for this study suggest that there are probably no “urban” areas in the Indicative County apart from the county town The Democratic People’s Republic of Korea Crop Use Intensity map, published by the UN Environment Programme Global Resources Information Database (1998), seems to indicate that the “urban” areas of the county towns of Onchon County and the Indicative County are roughly the samesize.
- Rough assumption. Earlier sources (as used for Von Hippel and Hayes, 1997) indicate persons per household in the DPRK in the early 1990s was approximately 4.65. Nautilus/KANPC survey in Unhari Village yielded estimate of 3.8 persons per household. Number used in this estimate is between these two figures.
- Estimated by measurement from map citedin Note 2.
Appendix 3: Residential Sector Energy Use Estimate
Estimate Of County-Level Energy Consumption For An Indicative Rural County In The Democratic Peoples’ Republic Of Korea
Notes/Sources:
- From D. Von Hippel and P. Hayes (1997) Demand and Supply of Electricity and Other Fuels in the Democratic People’s Republic of Korean (DPRK) . Nautilus Institute Report prepared for the for Northeast Asia Economic Forum.
- Source cited in 1 estimates 1996 residential electricity usage per household at 60% of 1990 usage. Assumption of 50 percent is roughly consistent with continued degradation from 1996 conditions to 1998 and is also roughly consistent with results of Nautilus rural energy survey (390 kWh/HH) in Unhari village (D. Von Hippel et al (1999) Rural Energy Survey In Unhari Village The Democratic People’s Republic of Korea (DPRK): Methods , Results , and Implications Nautilus Institute September 1999) tempered by consideration of reduced usage due to increased frequency of power outages in non-harvest seasons.
- As in source 1 but averaged over all rural households (not just those using coal). Roughly consistent with situation at Unhari (which has its own mine) as of 1998 (reference–study cited in note 2 above).
- Since county under study has (apparently) no coal mines of its own it is assumed that coal use in the county has declined by more than the national average (of approximately 50 percent) due to restrictions on transporting coal in from outside the county.
- As in source 1 but averaged over all rural households (not just those using oil products for cooking). It is assumed that the use of oil products for lighting in 1990 was relatively minor.
- Assumes that oil products use for cooking is negligible in 1998 due to oil supply restrictions. Lighting oil use per household in both urban and rural homes assumed similar to that found in Unhari (averaged over all households–9.7 liters per HH using oil lighting * 80 percent of households with oil lamps).
- Assumes average value from source 1 for 1990.
- Assumes rural household wood/biomass use increases somewhat between 1990 and 1998 due to lack of coal for heating with the increase tempered by a general shortage of wood resources.
Appendix 4: Public/Commercial Sector Energy Use Estimate
Estimate Of County-Level Energy Consumption For An Indicative Rural County In The Democratic Peoples’ Republic Of Korea
Notes/Sources:
- From Von Hippel, D., and P. Hayes (1997), Demand and Supply of Electricity and Other Fuels in the Democratic People’s Republic of Korean (DPRK). Nautilus Institute Report, prepared for the for Northeast Asia Economic Forum.
- Somewhat lower than used to estimate national public/commercial floor space and energy use in Source 1. Lower figure chosen based on the assumption that county towns will have a lower ratio of public/commercial to residential floor space than the nation as a whole (most such buildings in major cities/Pyongyang).
- From Nautilus rural energy survey of Unhari village (D. Von Hippel et al (1999), Rural Energy Survey In Unhari Village, The Democratic People’s Republic of Korea (DPRK): Methods, Results, and Implications , Nautilus Institute, September 1999). Total village public/commercial fuels use divided by number of households in the farm surveyed (500).
- From survey referenced above. Includes oil used for emergency lighting and for fueling emergency generators. These end-uses are assumed to have been minimal in 1990, when the electricity supply situation was more stable, so an estimate of zero is used for 1990. Rural and urban use on a per household basis in 1998 are assumed to be the same.
Appendix 5: Domestic Water Supply Energy Use Estimate
Estimate Of County-Level Energy Consumption For An Indicative Rural County In The Democratic Peoples’ Republic Of Korea
Notes/Sources:
- From Nautilus rural energy survey of Unhari village (D. Von Hippel et al (1999), Rural Energy Survey In Unhari Village, The Democratic People’s Republic of Korea (DPRK): Methods, Results, and Implications, Nautilus Institute, September 1999). Total farm cooperative domestic water pumping electricity use divided by number of households in the farm surveyed (500). Since the Unhari estimate was compiled without consideration of the extent of electricity outages (that is, based on usage during the harvesting season when electricity supplies to Unhari were relatively stable), this estimate was taken as representative of water pumping energy1 use in approximately 1990. Value assumed to be approximately the same for both urban and rural households.
Appendix 6: Industrial Sector Energy Use Estimate
Estimate Of County-Level Energy Consumption For An Indicative Rural County In The Democratic Peoples’ Republic Of Korea
Notes/Sources:
- Information provided by colleague from the region (“two small mines producing both zinc and gold”).
- Colleague from the region provided estimate of 2000 to 3000 kW of grid electric supply to mine (assumed to be to each).
- Guess. Figure is intended to reflect power consumption under “normal” operating conditions.
- Rough estimate consistent with reported overall decline in industrial output to 1996 (as described in Von Hippel, D., and P. Hayes (1997), Demand and Supply of Electricity and Other Fuels in the Democratic People’s Republic of Korean (DPRK). Nautilus Institute Report, prepared for the Northeast Asia Economic Forum). Cited source assumed 30% of 1990 industrial activity by 1996. This value is reduced still further to 20% in consideration of additional reported decline in the DPRK economy since 1996, plus reported difficulties in obtaining power for mining activities in the county under study.
- From source cited in note 4.
- Rough estimate. It is assumed that local industries will be somewhat more active than that national average.
Appendix 7: Agricultural Sector Energy Use Estimate
Estimate Of County-Level Energy Consumption For An Indicative Rural County In The Democratic Peoples’ Republic Of Korea
Notes/Sources:
- From “Demographic and Agricultural Area” worksheet in this workbook.
- Assumes that rice is planted in the most heavily cropped areas (river bottom areas), while other crops (mostly maize, reportedly the main crop of the county) are planted in other areas.
- Rough guess. Seven to one is approximately the ratio of other grain crops to maize area reported for the country as a whole as of 1998 (AREP V. 2, WP3, p.3).
- Most figures from AREP V.2, WP3, p.15-18. AREP estimates for “Existing technology with adequate farm power” were taken to be representative of 1990 conditions, and AREP estimates for “crisis situation” were assumed to be representative of 1998 conditions. 1998 values for other grains were estimated roughly based on from figures for maize, as the AREP report presented no “crisis situation” data for other crops. Values for the “vegetables and potatoes” column are rough averages of data for “Upland Potato” and “Cabbage” crop models in the referenced section of the AREP report. It is assumed that neglible quantities of commercial fertilizers and diesel fuel are used in cultivating fruit crops.
- Estimates based on rough interpolation of net average irrigation requirements for each crop as presented in AREP V.2, WP 1, Appendix 6, pages 2 to 25. Since none of the five climate stations for which irrigation data are provided in the referenced report are in the Indicative County, data from the Pyongyang and Wonsan stations were averaged (roughly) to provide the estimates shown.
- AREP V.2, WP1, p. 11 suggests that there was a 25 percent shortfall in irrigation water in the DPRK as of 1998.
- Derived from irrigation requirements estimates in AREP V.2, WP1, p. 9.
- Based on results of Von Hippel, D., and P. Hayes (1997), Demand and Supply of Electricity and Other Fuels in the Democratic People’s Republic of Korean (DPRK). Nautilus Institute Report, prepared for the Northeast Asia Economic Forum). For electricity, the value shown is somewhat less than that estimated for rice processing (about 432 kWh/ha crops) in the Nautilus study of Unhari village, (D. Von Hippel et al (1999), Rural Energy Survey In Unhari Village, The Democratic People’s Republic of Korea (DPRK): Methods, Results, and Implications, Nautilus Institute, September 1999), but a lower value is probably appropriate here, as rice is not the main crop in the Indicative County.
- As used for 1996 in Von Hippel and Hayes (1997), as cited above.
Appendix 8: Electricity Supply Data And Bulk Demand Comparison
Estimate Of County-Level Energy Consumption For An Indicative Rural County In The Democratic Peoples’ Republic Of Korea
Notes/Sources:
- Based on monthly “Average kW” send-out data for a substation in the county, as provided to Nautilus by a colleague from the region. It is not clear what the definition of “Household” and “non-Household” are in this context, although this portion of the county is reportedly home to a number of geothermally-heated greenhouses, and the pumps for the heating water reduce the ratio of “household” to “non-household” electricity use. The data provided are reported to cover 3 “ris”, or districts. It is also not known whether the “average kW” figures obtained by Nautilus reflect demand (send-out) averaged over each hour of each day of the month, (as the calculation shown interprets the data), or is the average of the daily peaks for the month, which would imply a substantially lower (perhaps two or three-fold, given Nautilus experience at Unhari) total electricity consumption. It is also not known to what extent the substation data provided average in periods of electricity outages. The weighted average ratio of the average kW to the monthly maximum peak is a relatively high 71%, suggesting that outage periods are not included and/or that the “average kW” figure is not a true time-weighted average and/or that the data are not in fact very good.
- If county population is 40,000 as reported, at 4000 to 6000 persons per ri, a maximum of 10 ris are implied.
- Data for local power station output provided to Nautilus by a colleague from the region. It is unclear whether the output of these stations is or should be (depending on the power plant locations) included in the substation send-out data provided, although comparison with estimated demand suggests that this local production probably is included in substation send out. There is apparently a functionally separate county-level electricity system fed by local generation resources, but the county-level system does connect to the national grid.
- Data provided to Nautilus by a colleague from the region.