
by Dr. Vlado Vivoda
25 February 2014
This Special Report was originally published as a Working Paper 2013-9 by the Center for Energy, Governance and Security at Hanyang university, Seoul.
I. INTRODUCTION
Asia’s share of global demand for natural gas has increased from 13 to 18 per cent over the past decade, and the overall consumption has nearly doubled. At the same time, there is a growing gap between regional natural gas demand and supply, with increasing reliance on imports. Regional liquefied natural gas (LNG) imports are forecast to increase by 60 per cent by 2030, and natural gas has been described as Asia’s “fuel of the future”. Asian LNG importers seek to diversify their supplier mix as much as possible to lower the prices and to reduce economic vulnerability to future disruptions or the failure of any one producer to provide adequate supplies. This paper explores major regional importers’ approaches to LNG import diversification between 2002 and 2012 and explains why patterns of LNG imports differ between states and over time. The focus of the paper is on five largest LNG importers in the region: China, India, Japan, South Korea and Taiwan.
Banner Image:
とまりん♪, CC BY-SA 2.1 JP https://creativecommons.org/licenses/by-sa/2.1/jp/deed.en, via Wikimedia Commons
II. SPECIAL REPORT BY VLADO VIVODA
Natural gas is becoming an increasingly important source of energy. In the past decade, the global use of natural gas has increased by 28 per cent, and natural gas accounts for close to 24 per cent of global primary energy demand (BP, 2013: 41). A particular appeal of natural gas is that it is 30 per cent less carbon-intensive than oil and 50 per cent less than coal (Stevens, 2010: 4). In comparison to oil, with a relatively high reserves-to-production ratio (64 years) natural gas is in ample supply; and its reserves are more widely spread across regions than in the case of oil, which is primarily concentrated in the Middle East. Against this backdrop, natural gas, and LNG more specifically, is often considered the energy source that will be the “bridging fuel” to a sustainable energy system (Kumar, et al, 2011).
Nowhere is the increased importance of natural gas more pronounced than in Asia. Asia’s share of global demand for natural gas has increased from 13 to 19 per cent over the past decade, and the overall consumption has nearly doubled (BP, 2013: 25). At the same time, there is a growing gap between regional natural gas demand and supply, with increasing reliance on imports. While a number of countries in the Asia-Pacific region – Australia, Brunei, Indonesia, Malaysia and Myanmar – are important exporters, a number of major economies – Japan, China, South Korea, India, Taiwan, Singapore and Thailand – are becoming increasingly reliant on natural gas imports. For example, India began importing LNG in 2004 and China in 2006. Although a large share of these imports is supplied from within the region, increasingly they are sourced from non-regional exporters.
Of these importers, Singapore and Thailand import natural gas almost exclusively via pipelines. While Thailand started importing LNG in 2011, the import volumes are very low compared to pipeline imports from Myanmar. Singapore imports natural gas via pipelines from Indonesia and Malaysia, and is building a regasification terminal to allow for LNG imports from 2014. Consequently, Thailand and Singapore’s suppliers are largely locked in, and generally there is very low, if any, variance in the sources of their natural gas imports. Analysing Singapore’s and Thailand’s natural gas import diversification is therefore of no utility. At the same time, Japan, South Korea, India and Taiwan only import LNG, while China imports both LNG and piped natural gas. The overall LNG import volume of these five countries has doubled in the past decade, with volume increases recorded in all cases (Fig. 1). While Japan remains by far the largest regional importer, its share of regional LNG imports has dropped from 70 per cent to 53 per cent over the past decade. South Korea’s and Taiwan’s shares of regional LNG imports have remained unchanged at 22-24 per cent and 7-8 per cent, respectively, during the same period. At the same time, China and India are fast becoming important regional LNG importers, having lost self-sufficiency over the past decade. Such is the importance of these five importers that in 2012 they accounted for 71 per cent of global LNG demand (GIIGNL, 2013). Regional LNG imports are forecast to increase by 60 per cent by 2030 (Smith, 2012), and natural gas has been described as Asia’s “fuel of the future” (Fesharaki, et al, 2000).
Figure 1: LNG imports of the five countries (2002-2012; billion cubic metres per year)
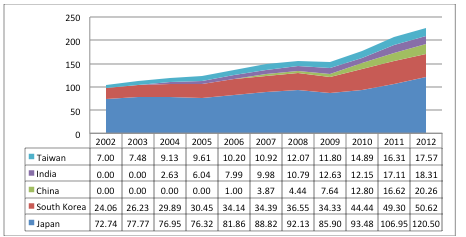 Sources: BP (2003-2012); GIIGNL (2013)
Energy importing states adopt a variety of strategies to provide for energy security, which are almost exclusively designed to mitigate the risks associated with supply disruption. These include, inter alia, diversification of types of fuels used, diversification of transport routes, securing access to energy at source (i.e. through equity deals), energy conservation, energy efficiency, technological innovation, stockpiling, increased domestic production, improving energy infrastructure, increasing international cooperation among the importers, and improving political relations with the exporters. A final method is the diversification of import sources: trying to import energy supplies from as many different regions and countries as possible. This militates against supply disruptions due to political or environmental crises in one area of the world (Vivoda and Manicom, 2011: 224).
The logic for diversifying the sources of natural gas imports is simple. A majority of key natural gas exporters, particularly those located in the Middle East or Africa, suffer political instability or have a high risk potential for it, and this places importers at risk. A nation that relies heavily on international markets for natural gas imports faces a multitude of potential disruptions to the availability of supplies. Disruptions are any events that lead to imbalances between supply and demand in the natural gas market, and they can occur as a result of political, market, and accidental/natural events, or a combination thereof (Lesbirel, 2004). Natural gas is traded in gaseous form via international pipelines and in liquid form via seaborne trade. While piped gas is highly politicised in the Eastern European context as well as in the Central Asian context, this applies to a much lesser extent in the case of LNG. Consequently, diversifying natural gas imports, and increasing LNG imports at the expense of natural gas imports from countries, such as Russia, that have historically politicised its supply, is a prudent energy security strategy.
Risks for importers are exacerbated by the high cost of LNG storage. LNG stockpiling is not used as a primary tool to ensure supply security as much as oil. Moreover, even by extractive industry standards, lead times for the LNG projects can be extensive. The high level of capital costs means that long-term LNG contracts are necessary before financing can be negotiated and even then the level of capital costs are such that financing can be tedious and time consuming. The need for delivery of sophisticated LNG tankers is a further complicating factor (Langton, 1994: 257). The large capital costs and the inherent inflexibility associated with this type of system invariably require special contractual arrangements to protect both supplier and purchaser. As a consequence, the international trade in LNG has been characterized by long-term supply contracts of between 15-25 years in length with accompanying take-or-pay clauses. Once in place, these systems offer little opportunity for flexibility in delivery without financial malaise. In the context of inflexible supply chain that provides little opportunity for securing additional supplies from other suppliers, a well-diversified import portfolio is important in the event of a disruption to supplies from one or more LNG suppliers.
In addition, given that the international natural gas market is not integrated, there is a significant price differential among the three major basins – North American, Atlantic and Pacific (Fig. 2). Unlike oil, and given inflexibilities inherent in the supply chain, LNG is not a fungible commodity that is traded in a world market with fairly strong arbitrage that yields one price between different basins. This provides additional rationale for assessing import diversification. Most importantly for Asian importers, since 2009, the price in the Pacific basin has been considerably higher than in other two basins. Given that even small increases in energy prices can yield sizeable economic losses through unemployment and lost income, as well as the loss of value for financial and other assets, diversifying imports to cheaper suppliers, is theoretically a sound strategy aimed at reducing import costs and building a truly integrated global LNG market. Efficient energy-importing portfolios aim to minimize national exposure to price fluctuations, commensurate with creating optimal overall importing costs (Wu, et al, 2009).
Figure 2: LNG price in the three basins (US$ per million Btu; 2002-2012)
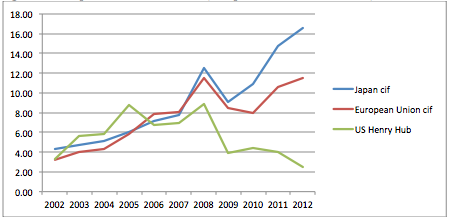
Source: BP (2012: 27); GIIGNL (2013)
In this paper, diversification refers to the mix of suppliers of LNG. A more diversified import diversification strategy is one which sources LNG from as many suppliers as possible, thereby minimising the potential for supply disruption and reducing import costs by enhancing physical arbitrage between prices across regional LNG markets (Stevens, 2010: 2). Relying on a single source for LNG imports, in general, is far riskier than importing LNG from multiple sources. Having multiple suppliers provides security and reduces vulnerability in cases of temporary or permanent disruption of supply (Vivoda, 2009: 4616). Should one supplier fall victim to natural disasters, terrorism, war, regime change, or other export damaging events, importers will only experience minor disruptions to their total supply (Leiby, 2007).
All five of the Asian LNG importers surveyed in this paper have either an explicit or an implicit diversification policy. On one hand, the policy is explicit in the cases of Japan, India and Taiwan. Articles 2 and 3 of the Basic Act on Energy Policy call for Japan to diversify its energy sources by type and import region in an effort to secure stable energy supply (Government of Japan, 2002). While prior to the Fukushima disaster of 11 March 2011, by 2030, Japan aimed to reduce natural gas consumption by 25 per cent of 2007 levels (METI, 2010), this policy is likely to change to an increased demand for natural gas in the near future in order to replace nuclear power (Hosoe, 2012). The Government of India (2006: 60) included improved diversity of supply sources both domestically as well as for imports of oil and natural gas as the first measure for increasing energy security. In June 2009, Taiwan’s Legislative Yuan passed an energy act aimed at boosting energy diversification, and the Ministry of Foreign Affairs, Taiwan (2009: 2), included expansion of natural gas supply sources as one of its policy aims.
On the other hand, diversification policy is implicit in China and South Korea. For example, although not stated in any official documents, energy diversification in order to optimise the energy mix is one of the central objectives of Chinese energy strategy. In order to ensure an uninterrupted supply of energy for its rapidly growing economy, Beijing induced intense energy diplomacy efforts aimed at diversifying its gas and oil imports. The 1999 “going-out” strategy, endorsed by the government, and implemented by Chinese national oil and gas companies, is a core element of these broader diplomatic efforts (Government of the People’s Republic of China, 2006). The Chinese government anticipates boosting the share of natural gas as part of total energy consumption to 10 per cent by 2020 to diversify the fuel mix in all end-use sectors (EIA, 2012). In the attempt to diversify the suppliers, South Korea’s Ministry of Knowledge Economy (2011) listed development of energy resources in the Former Soviet Union, Central and South America and Africa, and reduction in costs imports from Asia, as its policy objectives. In December 2010, the government has developed a long term gas supply and demand plan which calls for independent development of gas resources with long-term contracts (EIA, 2011a). Historically, Seoul has placed a strong emphasis on supply diversification policies. The fact that the South Korean government projected the country’s natural gas demand to increase by approximately 30 per cent of 2009 by 2024, attests to the importance of diversification in securing these additional supplies (Yoo, 2011: 1).
Asian LNG importers seek to diversify their supplier mix as much as possible to lower the prices and to reduce economic vulnerability to future disruptions or the failure of any one producer to provide adequate supplies. This portfolio approach mitigates the risks of the international natural gas market provided it is accomplished with acceptable economic and political costs (Neff, 1997; Lesbirel, 2004; Wu, et al, 2007). Despite similarities in the objective of diversifying imports, patterns of import diversification vary from case to case, with concomitant effects on energy security. Against this backdrop, this paper explores major regional importers’ approaches to LNG import diversification and explains why patterns of LNG imports differ between states. The structure of the paper is as follows. Section 2 presents the methodology used to evaluate LNG import diversification across five countries and the region between 2002 and 2012. Section 3 presents the results of the quantitative analysis of LNG import diversification and engages possible explanations for differences among cases and over time. Section 4 summarizes the findings and proposes policy implications related to the future prospects for regional LNG importers.
1. Methodology and Data
In order to assess and analyse LNG import diversification portfolios of China, India, Japan, South Korea, Taiwan, and of the Asia-Pacific region as a whole, the paper adopts the Herfindahl-Hirschmann index (HHI) of market concentration. According to Helm (2002), the natural way to think about diversification is as a portfolio effect. Risks are spread in financial markets by diversification, and so, too, by diversifying fuel sources. Such a conceptual approach provides a view to the past and current source and supplier dimensions of diversification, and also allows a general assessment of the potential threats to a nation’s energy sources or access to them (Stringer, 2008). Diversification indices can provide a summary statistic of changes over time. The HHI has been used as an indicator of the degree of competition in an industry using the market share of firms and has been widely applied in the analysis of competition for antitrust law and industry regulation. More specifically, the HHI has been employed in evaluations of energy diversification strategies, but with the exception of a study by Cohen, et al (2011), has mainly focused on oil (Wu, et al, 2007; Gupta, 2008; Wu, et al, 2009; Vivoda and Manicom, 2011) or on diversification of overall energy or electricity supplies within a specific country or region (Neff, 1997; Lesbirel, 2004; Grubb, et al, 2006; Loschel, et al, 2010; Jun, et al, 2009; Le Coq and Paltseva, 2009; Frondel, et al, 2012).
The Herfindahl-Hirschmann index is calculated according to:
I
HHI = ∑ pi², i=1
where pi is the proportion of LNG imports from the ith LNG-exporting country. The HHI rises to the maximum value of 1 if LNG is imported from only one country. A value of 1, or close to it, indicates low level of diversification, high concentration and dependence on one or very few sources of LNG that may threaten the security of supply in the event of any sustained interruption. A value of 0, or close to it, indicates a high level of diversification, with numerous sources of imported LNG, none of which play a dominant role. Such a system can be considered reasonably secure in the face of interruption in any particular LNG-exporting country. In terms of exporter diversification, the HHI rises to the maximum value of 1 if there is only one LNG exporter. A value of 1, or close to it, indicates low level of exporter diversification. A value of 0, or close to it, indicates a high level of diversification, with numerous global LNG exporters, none of which play a dominant role.
An alternative approach to measuring the diversity of energy suppliers would be to use the Shannon–Wiener concentration index (SWI). According to Christie (2009: 281), from the point of view of diversification both HHI and SWI seem adequate and there is no prima facie case for favouring one over the other. However, the SWI puts relatively more weight on the impact of smaller market participants, while the HHI places more emphasis on larger suppliers. Other things equal, suppliers that constitute a larger share of country’s energy imports potentially may cause more problems for energy security. In addition, the possible range of the SWI values increases unboundedly with the number of market participants (Frondel and Schmidt, 2008), which undermines the usefulness of the index for comparison across markets/countries. Therefore, the HHI is better suited to reflect the risks associated with the non-diversified energy portfolios (Le Coq and Paltseva, 2009: 4475). It is important to note that HHI and SWI are only effective in measuring import diversification and not energy vulnerability. In order to assess broader energy vulnerability risks, it is preferable to use measures of expected shortfall from the financial economics literature, which represents an actual volume of expected shortfall which can be directly linked to a country’s fuel intensity of GDP (Christie, 2009: 289).
The main sources of data are the annual BP Statistical Review of World Energy (2003-2013) and the annual reports published by the International Group of Liquefied Natural Gas Importers (GIIGNL), entitled The LNG Industry (2009-2013). The data on LNG trade, which is utilised to calculate the HHI for five LNG importers and the region is presented in Appendix A, while the HHI data for each country and the region as a whole is available in Appendix B.
2. Results
LNG import diversification strategies of China, India, Japan, South Korea and Taiwan, Asia’s five major LNG importers and the region’s cumulative import diversification were assessed by applying HHI in order to measure the level of diversification between 2002 and 2012. The data for India and China is analysed for the 2004-2012 period (India) and the 2006-2012 period (China), as these two countries did not import any LNG prior to 2004 and 2006, respectively. Based on Eq. (1) the HHI was calculated for the five countries and the region as a whole. Fig. 3 shows the HHI applied to the corresponding data (see Appendix A for the data on annual imports by source for each country), and Fig. 4 shows the region’s cumulative HHI.
Figure 3: HHI for the five countries (2002-2012)
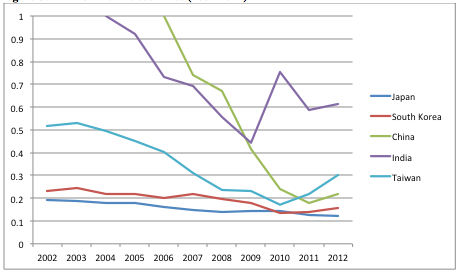
Figure 4: Cumulative regional HHI (2002-2012)
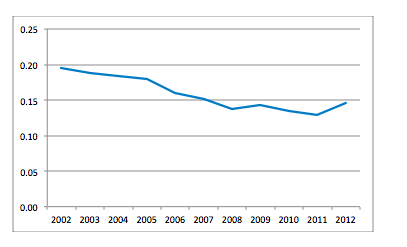
It is apparent from Fig. 3 that all of the regional LNG import portfolios have become more diversified over the past decade. At the same time, there is much contrast in the extent of LNG import diversification for the five Asian countries. In particular, as measured by the HHI, the sources of LNG imports for Japan and South Korea, and Taiwan to a lesser extent, have been most diversified; diversification of China’s sources of imported LNG has improved dramatically since it became an LNG importer in 2006, with a slight deterioration in 2012; and while India’s portfolio of LNG imports has continually improved until 2009, it has become less diversified since. In terms of regional HHI, Fig. 4 reveals that, cumulatively, five major Asian LNG importers have improved their LNG import portfolio until 2011, with a minor deterioration in 2012. The remainder of this section summarises the results for each country.
China
Upon its shift to a LNG importer in 2006 China was largely reliant on Australia for imported LNG. Between 2006 and 2008, over 80 per cent of China’s imported LNG originated from Australia and, as a consequence, China’s HHI was at a relatively low level during the early years as an importer. As China’s thirst for imported LNG increased, as part of its broader energy diplomacy, China expanded its relations with other energy suppliers, and imports from Indonesia, Malaysia and Qatar each made up more than 10 per cent of overall imports by 2010. A push to diversify continued in 2012, and while still the largest source of imported LNG, Australia’s share in China’s LNG imports dropped to less than 25 per cent. While in only five years (from 2006 to 2011) China’s LNG import diversification profile was transformed from being dominated by one country to a profile which exhibited a relatively high degree of diversification, with four countries each accounting for over 10 per cent of imports. China’s LNG imports from Qatar increased significantly, to 34 per cent of the overall imports in 2012, compared to 19 per cent of the total share in 2011. The going-out strategy has enabled Chinese oil & gas companies to sign long-term LNG supply contracts in some of the major LNG-exporting regions, including Australia, Southeast Asia and the Middle East. Since 2006, China’s LNG import volumes have continued to grow by an average 41 per cent annually. Overall, since becoming an LNG importer, China has consistently been able to secure access to additional sources of LNG, reflective in the improved HHI. Since 2006, China’s HHI has dropped from 1.0000 in 2006, to a record low of 0.1781 in 2011, before increasing to 0.2205 in 2012 as a consequence of increased imports from Qatar (Fig. 3).
India
India started importing LNG in 2004, and in the first two years it was almost exclusively reliant on Qatar for LNG imports. Unlike China, which diversified away from Australia soon after becoming an LNG importer, India has remained largely dependent on Qatar for its imports. While securing substantial supplies, India has only signed two long-term supply contracts, with Qatar in 2004 and the USA in 2011, which indicates that the government and Indian companies have not effectively implemented their diversification policy (GIIGNL, 2013). Qatar’s share in India’s LNG imports reached a low of 65 per cent in 2009, before rebounding to above three-quarters of overall imports since 2010. Given that India’s LNG imports have increased by an average 36 per cent annually since 2004, increasing volumes of Qatari LNG have played an instrumental role in supplying additional volumes. In contrast to China, only Nigeria (in 2012) accounted for more than 10 per cent of India’s LNG imports since 2004. Several suppliers provided between 5 and 10 per cent of India’s imports, including Egypt (in 2006), Nigeria (in 2007 and 2011), Australia and Russia (in 2009) and Trinidad & Tobago (in 2009 and 2010). This low level of diversification in India’s sources of LNG imports is reflected in relatively high HHI, which dropped to the low of 0.4435 in 2009, incidentally the year in which imports from Qatar were at their lowest point, before returning to higher levels.
Japan
Japan is a mature LNG importer, with first imports recorded in 1969 from Alaska, making it the pioneer in the global LNG trade. During the past decade, Japan’s LNG imports have increased by an average 5.4 per cent annually. Given that it is the region’s largest LNG importer by some margin, Japan has been the most active in securing new long-term LNG supply contracts. Over the past decade, Japanese companies have signed 56 long-term contracts in six countries (GIIGNL, 2013). While not growing at a rate observed in China and India, Japan remains by far the largest LNG importer in the region. Between 2002 and 2011, Japan imported at least 10 per cent of LNG from the minimum of four countries each year. Indonesia, Malaysia, Australia and Qatar supplied over 10 per cent of Japan’s LNG imports, with Brunei’s share dropping from 11 per cent in 2005 to under 7 per cent in 2012. Indonesia’s share dropped from over 11 per cent in 2011 to 7 per cent in 2012. This drop in Brunei’s and Indonesia’s share has largely coincided with an increase in imports from Russia, a country that started exporting LNG to the Asian markets in 2009. As of 2012, Russian LNG accounted for 9.5 per cent of Japan’s imports. The share of the United Arab Emirates (UAE) in Japan’s LNG imports stood at between 6 and 9 per cent throughout this period, further contributing to Japan’s diversified portfolio. In recent years, the share of LNG imports from Qatar, Nigeria and Equatorial Guinea increased significantly. While Indonesia remained the major supplier from 2002 (with 32 per cent) until 2009 (20 per cent), Malaysia assumed that in 2010 and 2011. In 2012, Australia became the largest source of Japan’s LNG imports. Since 2010, none of the suppliers accounted for over 20 per cent of Japan’s LNG imports. Reflective of a constantly large number of important LNG suppliers to Japan, and a drop in the largest supplier’s share to below 20 per cent, Japan’s HHI has been consistently low and has dropped from 0.1938 in 2002 to 0.1224 in 2012.
South Korea
Similar to Japan, South Korea is a mature LNG importer, with first imports recorded in 1987. Between 2002 and 2012, South Korea’s LNG imports have increased by an average 8.1 per cent annually. South Korea is the second largest LNG importer in the region, with volumes just under the combined imports of China, India and Taiwan. Driven by the policy to increase development of energy resources in specific regions, South Korean companies have signed twelve new long-term supply contracts in seven countries since 2002 (GIIGNL, 2013). Also similar to Japan, during the past ten years, South Korea imported at least 10 per cent of LNG from four countries (Qatar, Indonesia, Malaysia and Oman) each year. With an over 20 per cent share in overall imports for most years, Qatar and Indonesia have remained South Korea’s major LNG suppliers since 2002. Both Malaysia’s and Oman’s shares have dropped from their highs of 24 per cent for Malaysia (2007) and 21 per cent for Oman (2006) to 11 per cent in 2012, but their shares were replaced by an increase in imports from Indonesia, Russia and Yemen, in 2010 and 2011, and, most importantly, Qatar, in 2012. With 6-7 per cent shares in 2012, Russia and Yemen have fast become important sources of South Korea’s LNG imports and have improved the country’s import diversification portfolio. Of the five countries surveyed in this paper, LNG import portfolios of South Korea and Japan have been the most diversified and constant in terms of low degree of annual fluctuation. The improvement in South Korea’s LNG import diversification is reflected in the drop in HHI from a high of 0.2431 in 2003 to a low of 0.1349 in 2010, before rising in 2011 and 2012. In fact, 2010 was the only year in which South Korea outperformed Japan.
Taiwan
Taiwan is also a relatively mature LNG importer, with first LNG imports recorded in 1990. Over the past decade, Taiwan’s LNG imports have increased by an average of 10 per cent annually. Although Taiwan has historically been the third largest LNG importer in the region, given their rapidly growing remand, China and India have caught up by 2011. Unlike in the cases of Japan and South Korea, between 2002 and 2012, shares of major LNG suppliers to Taiwan have varied considerably. In 2002, Taiwan imported all of its LNG from Indonesia and Malaysia, and these two countries accounted for over 90 per cent of Taiwan LNG imports until 2006. However, by 2012, the shares of these two countries have dropped to 22 per cent (Malaysia) and 14.5 per cent (Indonesia). While import volumes from Malaysia have relatively constant during the past decade, import volumes from Indonesia dropped by 40 per cent. Meanwhile, Qatar has emerged as the largest source of imported LNG, accounting for 47 per cent of Taiwan’s imports in 2012. This is a massive transformation in Taiwan’s LNG import portfolio, as there were no LNG imports recorded from Qatar until 2007. Taiwan has been the least active of the five countries over the past decade, with only one new long-term supply contract signed with Qatar in 2008 (GIIGNL, 2013). Consequently, given the lack of commitment to increase supplies from other sources, it is not surprising that Taiwan has become increasingly reliant on the largest global LNG supplier (Qatar) in recent years. Two other suppliers (Nigeria and Equatorial Guinea) provided over 10 per cent of Taiwan’s imports, but both in a single year (2008), and their respective shares have dropped significantly since. Reflective of the drop in Indonesia and Malaysia’s share in Taiwan’s LNG imports since 2002, Taiwan’s HHI has dropped from a high of 0.5316 in 2003 to a low of 0.1717 in 2010. In fact, 2010 was the only year in which no single supplier accounted for more than one-quarter of Taiwan’s LNG imports. This changed since 2011 with Qatar’s share increasing significantly and, as a consequence, Taiwan’s HHI has increased to 0.3014 in 2012, the worst level since 2007.
The Asia-Pacific region
If import volumes of five major Asian LNG importers are analysed collectively, the data reveals an overall improvement in regional LNG import diversification portfolio over the past decade. The regional HHI shows a significant improvement, with the highest value of 0.1954 in 2002 and the lowest value of 0.1291 in 2011, before increasing to 0.1455 in 2012. While the region was mainly dependent on Indonesia and Malaysia for over 50 per cent of its LNG imports until 2004, their share has continued to drop to the low of under 26 per cent in 2012. Meanwhile, Qatar has emerged as the largest source of LNG imports, with its share increasing from 15 per cent in 2002 to almost 29 per cent in 2012. Qatar’s rapidly increasing share in 2012 is the main reason for an increase in regional HHI in that year. An important factor which explains a relatively low HHI is that since 2005 the region has relied on at least four suppliers for the minimum of 10 per cent of supplies.
3. Discussion
Given the importance assigned to the policy objective of increased diversification of energy sources, and supplier mix more specifically, it is not surprising that all five countries have improved their LNG import portfolios over the past decade as measured by HHI. What may explain variation in LNG import diversification among cases and over time? More specifically, why are Japan’s and South Korea’s LNG imports more diversified than Taiwan’s or India’s? What factors have allowed China to diversify its LNG imports more effectively than India? Why have the regional LNG importers collectively improved their diversification portfolios over the past decade? In order to answer these questions, this section engages six possible explanations, summarized in Table 1. The data for these possible explanations is provided in Appendix B.
Table 1: Possible explanations for variation in LNG import diversification portfolios
| Explanation | Definition | Calculation |
| Number of LNG suppliers (1) | the number of LNG suppliers to regional LNG importers has increased from 8 in 2002 to 21 in 2012; it is expected that if an LNG importer sources its supplies from a greater number of suppliers, its LNG import portfolio will be more diversified | Number of LNG suppliers for five LNG importers and the region (2002-2012) |
| LNG prices (2) | Japan LNG cost, insurance and freight (cif) price, a benchmark for Asian purchases, has more than tripled between 2002 and 2012; moreover, since 2009, Japan cif price has been considerably higher than the LNG price in the other two basins; it is expected that if LNG prices increase, LNG importers would diversify their import portfolio to a greater number of suppliers in order to reduce the price | Average Japan cost, insurance and freight (cif) LNG price (US$ per million Btu; 2002-2012) |
| LNG import volumes (3) | regional LNG import volumes have more than doubled between 2002 and 2012 (Fig. 1); it is expected that LNG import portfolios would become more diversified as the overall import volumes are higher | Overall LNG imports by five importers and the region (bcm; 2002-2012) |
| Spot and short-term share of LNG imports (4) | Asian spot and short-term LNG imports (defined as LNG traded under contracts with a duration of four years or less) increased from 14 per cent in 2010 to 25 per cent of the overall LNG imports in 2012 (GIIGNL, 2013); in 2002 and 2006, the share of spot and short-term Asian imports in Asia stood at 4 per cent and 9 per cent, respectively; it is anticipated that LNG import portfolio would become more diversified if the share of spot and short-term contracts in the overall imports increases | Share of LNG imports under spot and short-term contracts for five LNG importers and the region (%; 2008-2012) |
| Experience as an LNG importer (5) | as countries begin importing small volumes of LNG, they are likely to be sourced from one or only a few suppliers in the early years; as these importers establish their presence in the market, they are likely to diversify their import portfolios; it is expected that more mature LNG importers (Japan, South Korea and Taiwan) will have a more diversified LNG import portfolios than the new market entrants (India and China) | Experience as an LNG importer for five countries and the region (years; 2002-2012) |
| Share of non-regional LNG imports (6) | over the past decade, all regional importers have increased the relative share of non-regional LNG imports; it is anticipated that LNG importers with a higher non-regional share of LNG imports will have a more diversified import portfolio | Share of LNG imports from outside of the immediate region; Asia-Pacific (Australia, Brunei, Indonesia and Malaysia) for China, Japan, South Korea and Taiwan, and the Middle East (Oman, Qatar, UAE and Yemen) for India (%; 2002-2012) |
Between 2002 and 2012, the number of LNG suppliers to the five Asian LNG importers has increased from 8 to 21. In fact, Libya is the only LNG exporter without any exports to Asia recorded. However, Libya is a very marginal LNG exporter. Overall, the higher number of sources of imported LNG implies an improved LNG import diversification portfolio for all countries, and this supports the findings by Cohen et al (2011). In fact, HHI improves more rapidly for countries initially reliant on very few suppliers (China, India and Taiwan). However, once an importer is reliant on approximately ten suppliers, the rate of improvement in diversification portfolio ensues, but at a slower pace. This is evident from the cases of Japan and South Korea. While these two countries increased their number of LNG suppliers from 8 in 2002 to 21 in 2011 (Japan), and from 7 in 2002 to 16 in 2012 (South Korea), the relative improvement in HHI has not been as drastic as in the cases of Taiwan until 2008, or China. The case of India all but confirms the relationship between the number of suppliers and HHI. India’s HHI increased from 0.4435 in 2009 to 0.7560 in 2010 against the backdrop of the number of LNG suppliers dropping from 12 to 6.
Similarly, in all cases, there is a relationship between LNG import volumes and HHI and level of experience as an LNG importer and HHI. This suggests that higher import volumes and more experience as an LNG importer imply an improved import diversification portfolio. More specifically, an increase in import volumes up to 20 billion cubic meters (bcm) per year implies a much more rapid improvement in HHI, as evident in the cases of China, India and Taiwan, than an increase in import volumes that are already at higher volumes, as in the cases of Japan and South Korea. Maturity as an LNG importer affects the import diversification portfolio. More mature importers, such as Japan and South Korea, have a highly diversified portfolio. At the same time, India, a relatively recent market entrant has a less diversified import portfolio than the more established importers. However, China’s import portfolio as measured by HHI has, by 2011, become more diversified than Taiwan’s, although Taiwan has been an LNG importer since 1990. It is also apparent that new LNG importers are likely to improve their diversification portfolio at a much faster rate during the first two decades as an importer. This is particularly pronounced in the case of China, which in only five years reached the level of LNG import diversification of Japan after 35 years, South Korea after 22 years and Taiwan after 20 years as LNG importers.
There is a relationship between an increase in non-regional LNG imports and HHI in all cases, with the exception of South Korea. Consequently, with the notable exception of South Korea, an increase in import shares from outside of the immediate region implies a more diversified import portfolio. This finding may not be surprising given that South Korea has been by far the most reliant on non-regional imports between 2002 and 2012, with their share constantly at or above 50 per cent. When Taiwan’s share of non-regional imports climbed to over 50 per cent in 2011, largely as a consequence of over-reliance on Qatar, its HHI increased indicating less diversification. More generally, it is apparent that the most diversified LNG import portfolios coincide with non-regional LNG supplying approximately 30 to 55 per cent of overall imports.
Analysis of data indicates that although regional importers have diversified their LNG import portfolios over the past decade, a drop in LNG prices has not accompanied such improved diversification. In fact, a push to import LNG from more sources may have caused an increase in LNG prices in the region with Japan particularly important in this context as the largest market player. Moreover, with the growing trend towards spot and short-term contracts in Asia, it was anticipated that with an increase in the uptake of spot and short-term contracts, import portfolios would become increasingly diversified. Spot and short-term LNG contracts allow LNG importers to secure required supplies on shorter terms (less than four years) than is possible with long-term agreements, and are not indexed to oil prices. However, with country-specific spot and short-term supply data available only since 2008, this only applied to India and Japan. In India, an increase in spot and short-term purchases significantly improved its HHI. This was also the case with Japan, although annual HHI variation has been minimal. This is an important factor which may explain the difference between levels of diversification for China and India. For India, an increase in reliance on spot and short-term LNG purchases indicates a more diversified LNG import portfolio, and this is not observed in the case of China.
4. Conclusions
Overall, until 2011, China’s improvement in LNG import diversification has been nothing short of spectacular, with the country achieving diversification levels of more mature importers in only six years as an importer. Given that China’s HHI has been markedly improved between 2006 and 2011, and was lower than that of Taiwan, a mature LNG importer, in 2011, it is apparent that China’s diversification policy has been implemented successfully over a short period of time. However, in 2012, China’s HHI deteriorated as a consequence of greater reliance on Qatar. Although outside of the scope of this paper, China’s pipeline imports from Turkmenistan since 2010 and Myanmar from July 2013, attest to Beijing’s commitment to diversification policy, and with increased volumes of natural gas from Central Asia under contract, will further contribute to China’s diversification of natural gas imports in the long term. If China is to further diversify its import portfolio, with increased import volumes in the future, it should aim to further increase the number of suppliers, from 12 in 2011, to closer to 20 in the coming years, along with the non-regional share of imports from 39 per cent in 2011 to approximately 50 per cent. The key determinant will be whether Beijing can reduce its growing reliance on Qatar. In this context, it is also important to mention the potential for shale gas exploration in China (Clemente, 2012), which could increase domestic production and reduce demand growth for imported natural gas in the future.
Unlike other major Asian LNG importers, India does not belong to the East Asian region. Geographically, it is approximately equidistant from Southeast Asia and the Persian Gulf, two of the major LNG exporting regions. At the same time, all of India’s LNG import and gasification terminals are located on its western coast, and consequently the Persian Gulf has been prioritized as a source of LNG imports. While India’s LNG import portfolio has become more diversified since it became an LNG importer in 2004, this improvement has been markedly slower than that of China. As of 2012, India had the least diversified LNG import portfolio of the five countries. India is willing to spend less to secure long-term contracts than China and is more reliant on spot and short-term contracts (PFC Energy, 2012: 19). Overall, for India, a greater diversification will be achieved by increasing spot and short-term purchases from as many suppliers as possible outside of the Middle East, and particularly by avoiding Qatar’s abundant supplies. An effective strategy to achieve higher diversification levels would be to increase involvement in Southeast Asia and Australia, as India’s imports from these regions have been negligible. Petronet’s long-term contract in Gorgon LNG project in Australia that will supply India with LNG from 2018 is a step in the right direction; and so is GAIL’s 2011 long-term contract to import LNG from Sabine Pass in the US (GIIGNL, 2013). Another effective strategy to increase diversification of imported natural gas, more broadly, would be to build pipelines from surrounding regions that are rich in natural gas. Yet, the three proposed pipeline projects, from Myanmar (MBI), Turkmenistan (TAPI) and Iran (IPI), have thus far failed to proceed due to security and political issues in transit countries, and cost (EIA, 2011b).
For mature importers, such as Japan and South Korea, that have a well diversified LNG import portfolio, a way forward is to at the very least maintain the levels of diversification they have achieved over the past decade. In order to do so, they should avoid becoming overly reliant on any one single supplier (e.g. Qatar), and increase (Japan) or maintain high levels of non-regional imports (South Korea) from as many countries as possible, again avoiding Qatar as much as possible. Taiwan’s LNG import portfolio has deteriorated in 2011 and 2012 as a consequence of a large increase in the share of imports from Qatar. Moreover, an increase in non-regional imports (mainly from Qatar) from 46 per cent in 2010 to 61 per cent in 2012, have resulted in a less diversified import portfolio. If Taiwan is to reach diversification levels of Japan and South Korea, it should aim to increase imports from its immediate region, and particularly from Australia, Indonesia, Russia and Papua New Guinea (from 2015), because if recent trends continue, it may become overly dependent on Qatar.
Standard & Poor’s (2012: 11) expect that energy security will continue to motivate Asian importers to diversify their natural gas sources. Yet, diversification of sources of imported energy, including natural gas, is only one energy security objective of importing governments. Often, this objective is balanced against other energy security objectives. For instance, importing LNG from countries that are in geographic proximity is beneficial as it reduces transport costs and the likelihood of supply disruption along the sea lines of communication (SLOCs), such as the Strait of Hormuz or the Malacca Straits. Consequently, for East Asian importers, LNG imports from Southeast Asia (Brunei, Indonesia and Malaysia), Australia and the Russian Far East have much appeal. Similarly, given that its LNG import and regasification terminals are located on its west coast, Middle Eastern suppliers have most appeal to India due to geographic proximity. Yet, herein lays the dilemma for Asian importers: overreliance on their immediate regions not only negatively affects their LNG import diversification portfolio, but also perpetuates the existing LNG market structure in which Asian importers pay a large premium on LNG prices in other regional markets, as LNG price in Asia remains linked to the Japan Crude Cocktail (JCC), or the average Japan crude oil cif import price. Oil indexation for long-term contracts has remained the industry standard in Asia because crude oil is the most widely traded global energy commodity (Standard & Poor’s, 2012: 6). Relying on long-term contracts in Australia, Brunei, Indonesia, Malaysia and Russia, driven by JCC indexation methods, makes regional LNG importers enhance energy security by locking in supplies for 20-30 years. At the same time, relying on LNG imports through regional long-term contracts perpetuates the existing market structure and contractual arrangements that link LNG prices to crude oil prices, thus reducing the potential for price arbitrage between the three basins.
Consequently, at first glance, regional policymakers will have to make a crucial decision on whether they will seek supply security in terms of increased reliance on the immediate region, while sacrificing diversification and price; or will seek increased reliance on non-regional suppliers, other than Qatar, which, while costly in the short-to-medium term (due to the high cost of building required terminals, etc.), may enhance diversification, and by bringing LNG from more suppliers to the market, create a liquid global LNG market in order to challenge the prevailing pricing formula and reduce LNG prices in the longer term. Of course, these two strategies can be pursued in tandem and they are not mutually exclusive.
While Asian importers share an interest in the establishment of a truly international LNG market, their interest is also to increase regional LNG supply. With more than 60 per cent of the global planned LNG liquefaction projects located in Australia, with $200 billion worth of largely Asian-financed LNG projects either planned or under construction, there is certainty about the future increase in LNG imports from Australia, mainly under long-term contracts (Natural Gas Asia, 2011). At the same time, importing more LNG from the Atlantic basin and North America, under both spot and short-term and long-term contracts will go some way towards the establishment of a fungible global LNG market and will put pressure on oil indexation in Asia. Yet, it will take a lot of spot and short-term LNG to create a liquid global market where the process of physical arbitrage creates a global price across different markets (The Economist, 2012). The reason is that LNG terminals are highly capital intensive projects and are built based on long-term contracts, not on playing in the spot market (Hanser, 2012; Wood, 2012: 27). However, following the massive shale gas discoveries in North America, Asian importers have increasingly participated in LNG export projects in the US and Canada. Liquefaction tolling arrangements that Asian companies have negotiated at several LNG export projects in the US are likely to provide a new model of LNG procurement, focussed on gas procurement in North America (based on Henry Hub-linked pricing system) rather than traditional LNG sales into the Asian markets—effectively avoiding oil-linked LNG pricing.
Appendix A: Asian LNG imports by source (2002-2012)
|
Year |
EXPORTERS |
||||||||||||||||||||
| Australia | Brunei | Indonesia | Malaysia | Russia | Qatar | Oman | UAE | Yemen | Egypt | Algeria | Nigeria | Eq. Guinea | USA | Trinidad | Peru | Norway | Belgium | Spain | |||
|
IMPORTERS |
China |
2006 |
1.00 |
– |
– |
– |
– |
– |
– |
– |
– |
– |
– |
– |
– |
– |
– |
– |
– |
– |
– |
| 2007 |
3.30 |
– |
– |
– |
– |
– |
0.07 |
– |
– |
– |
0.42 |
0.08 |
– |
– |
– |
– |
– |
– |
– |
||
| 2008 |
3.61 |
– |
– |
0.01 |
– |
– |
– |
– |
– |
0.25 |
0.17 |
0.24 |
0.16 |
– |
– |
– |
– |
– |
– |
||
| 2009 |
4.75 |
– |
0.72 |
0.88 |
0.25 |
0.55 |
0.09 |
– |
– |
0.08 |
– |
0.08 |
0.08 |
– |
0.08 |
– |
– |
0.08 |
– |
||
| 2010 |
5.21 |
– |
2.45 |
1.68 |
0.51 |
1.61 |
– |
0.08 |
0.70 |
0.08 |
– |
0.17 |
0.08 |
– |
0.07 |
0.08 |
– |
0.08 |
– |
||
| 2011 |
4.95 |
– |
2.72 |
2.14 |
0.33 |
3.17 |
– |
– |
1.10 |
0.24 |
– |
0.98 |
0.18 |
0.18 |
0.47 |
0.15 |
– |
– |
– |
||
| 2012 |
4.92 |
– |
3.34 |
2.56 |
0.53 |
6.88 |
0.09 |
– |
0.82 |
0.40 |
0.08 |
0.42 |
– |
– |
0.23 |
– |
– |
– |
– |
||
|
India |
2004 |
– |
– |
– |
– |
– |
2.63 |
– |
– |
– |
– |
– |
– |
– |
– |
– |
– |
– |
– |
– |
|
| 2005 |
0.16 |
– |
– |
– |
– |
5.80 |
0.08 |
– |
– |
– |
– |
– |
– |
– |
– |
– |
– |
– |
– |
||
| 2006 |
0.08 |
– |
– |
0.08 |
– |
6.80 |
0.24 |
0.08 |
– |
0.55 |
0.08 |
0.08 |
– |
– |
– |
– |
– |
– |
– |
||
| 2007 |
– |
– |
– |
0.07 |
– |
8.27 |
0.21 |
0.07 |
– |
0.07 |
0.44 |
0.64 |
– |
– |
0.21 |
– |
– |
– |
– |
||
| 2008 |
0.16 |
– |
– |
– |
– |
7.98 |
0.35 |
0.13 |
– |
0.26 |
0.65 |
0.41 |
0.44 |
– |
0.24 |
– |
0.08 |
0.09 |
– |
||
| 2009 |
1.12 |
– |
0.08 |
0.25 |
0.67 |
8.25 |
0.35 |
0.17 |
– |
0.33 |
0.16 |
0.32 |
0.25 |
– |
0.68 |
– |
– |
– |
– |
||
| 2010 |
– |
– |
– |
– |
– |
10.53 |
– |
– |
0.37 |
0.09 |
– |
0.33 |
0.17 |
– |
0.66 |
– |
– |
– |
– |
||
| 2011 |
0.18 |
– |
– |
0.17 |
– |
12.99 |
0.14 |
0.16 |
0.18 |
0.60 |
0.25 |
1.36 |
– |
0.42 |
0.57 |
– |
0.09 |
– |
– |
||
| 2012 |
– |
– |
– |
– |
– |
14.19 |
– |
– |
– |
0.72 |
0.61 |
1.85 |
– |
0.52 |
– |
– |
0.08 |
– |
– |
||
|
Japan |
2002 |
9.72 |
7.95 |
23.40 |
14.50 |
– |
8.40 |
1.09 |
5.93 |
– |
– |
– |
– |
– |
1.70 |
– |
– |
– |
– |
– |
|
| 2003 |
10.27 |
6.93 |
24.05 |
16.72 |
– |
9.05 |
2.16 |
6.87 |
– |
– |
– |
– |
– |
1.64 |
0.08 |
– |
– |
– |
– |
||
| 2004 |
11.20 |
8.29 |
21.19 |
16.63 |
– |
9.22 |
1.48 |
7.10 |
– |
– |
– |
0.16 |
– |
1.68 |
– |
– |
– |
– |
– |
||
| 2005 |
13.05 |
8.35 |
19.00 |
17.65 |
– |
8.35 |
1.25 |
6.75 |
– |
– |
0.08 |
– |
– |
1.84 |
– |
– |
– |
– |
– |
||
| 2006 |
15.68 |
8.65 |
18.60 |
15.60 |
– |
9.87 |
3.04 |
7.00 |
– |
0.80 |
0.24 |
0.22 |
– |
1.72 |
0.44 |
– |
– |
– |
– |
||
| 2007 |
16.05 |
8.57 |
18.07 |
17.65 |
– |
10.87 |
4.81 |
7.41 |
– |
1.62 |
0.78 |
0.88 |
0.36 |
1.18 |
0.57 |
– |
– |
– |
– |
||
| 2008 |
15.94 |
8.22 |
18.79 |
17.47 |
– |
10.91 |
4.25 |
7.41 |
– |
2.21 |
1.12 |
2.36 |
1.64 |
0.97 |
0.67 |
– |
0.17 |
– |
– |
||
| 2009 |
15.87 |
8.11 |
17.25 |
16.79 |
3.69 |
10.29 |
3.44 |
6.75 |
– |
0.24 |
– |
0.77 |
1.70 |
0.86 |
0.14 |
– |
– |
– |
– |
||
| 2010 |
17.66 |
7.78 |
17.00 |
18.55 |
8.23 |
10.15 |
3.80 |
6.86 |
0.16 |
0.57 |
0.08 |
0.84 |
0.72 |
0.85 |
0.15 |
– |
– |
0.08 |
– |
||
| 2011 |
19.01 |
8.36 |
12.60 |
20.35 |
9.76 |
15.78 |
5.41 |
7.66 |
0.25 |
0.92 |
0.08 |
2.65 |
2.01 |
0.50 |
0.44 |
0.51 |
0.24 |
0.27 |
0.15 |
||
| 2012 |
21.96 |
8.15 |
8.51 |
20.16 |
11.46 |
21.61 |
5.49 |
7.64 |
0.41 |
1.43 |
0.23 |
6.60 |
3.85 |
0.37 |
0.38 |
1.13 |
0.56 |
0.18 |
0.21 |
||
|
South Korea |
2002 |
0.24 |
1.04 |
6.78 |
3.10 |
– |
6.95 |
5.48 |
0.32 |
– |
– |
– |
– |
– |
– |
– |
– |
– |
– |
– |
|
| 2003 |
0.17 |
0.74 |
6.93 |
3.79 |
– |
7.88 |
6.49 |
– |
– |
– |
0.23 |
– |
– |
– |
– |
– |
– |
– |
– |
||
| 2004 |
0.55 |
1.21 |
7.30 |
6.25 |
– |
7.96 |
6.00 |
0.08 |
– |
– |
0.30 |
0.24 |
– |
– |
– |
– |
– |
– |
– |
||
| 2005 |
1.16 |
0.80 |
7.51 |
6.36 |
– |
8.31 |
5.93 |
0.08 |
– |
0.30 |
– |
– |
– |
– |
– |
– |
– |
– |
– |
||
| 2006 |
0.87 |
1.16 |
6.72 |
7.51 |
– |
8.98 |
7.10 |
– |
– |
1.25 |
0.32 |
0.16 |
– |
– |
0.07 |
– |
– |
– |
– |
||
| 2007 |
0.56 |
0.78 |
5.12 |
8.15 |
– |
10.79 |
6.74 |
0.07 |
– |
1.48 |
0.24 |
0.24 |
– |
– |
0.22 |
– |
– |
– |
– |
||
| 2008 |
0.53 |
0.98 |
4.06 |
8.31 |
– |
11.62 |
6.04 |
– |
– |
2.13 |
0.47 |
0.16 |
1.33 |
– |
0.84 |
– |
– |
0.08 |
– |
||
| 2009 |
1.75 |
0.70 |
4.10 |
7.81 |
1.35 |
9.28 |
6.05 |
– |
0.25 |
0.31 |
0.08 |
0.23 |
1.52 |
– |
0.90 |
– |
– |
– |
– |
||
| 2010 |
1.33 |
1.05 |
7.42 |
6.39 |
3.90 |
10.16 |
6.11 |
0.25 |
2.27 |
0.98 |
– |
1.18 |
1.85 |
0.35 |
0.88 |
0.08 |
0.16 |
0.08 |
– |
||
| 2011 |
1.07 |
1.03 |
10.76 |
5.64 |
3.88 |
11.09 |
5.03 |
– |
3.70 |
0.61 |
– |
1.53 |
1.05 |
0.25 |
2.18 |
1.00 |
0.40 |
0.08 |
– |
||
| 2012 |
1.15 |
1.07 |
10.27 |
5.63 |
2.98 |
14.18 |
5.70 |
– |
3.57 |
0.83 |
0.76 |
2.50 |
0.51 |
0.08 |
1.15 |
– |
0.08 |
0.15 |
– |
||
|
Taiwan |
2002 |
– |
– |
4.15 |
2.85 |
– |
– |
– |
– |
– |
– |
– |
– |
– |
– |
– |
– |
– |
– |
– |
|
| 2003 |
– |
– |
4.68 |
2.80 |
– |
– |
– |
– |
– |
– |
– |
– |
– |
– |
– |
– |
– |
– |
– |
||
| 2004 |
– |
– |
5.00 |
4.05 |
– |
– |
– |
– |
– |
– |
– |
0.08 |
– |
– |
– |
– |
– |
– |
– |
||
| 2005 |
0.40 |
– |
4.95 |
4.10 |
– |
– |
0.16 |
– |
– |
– |
– |
– |
– |
– |
– |
– |
– |
– |
– |
||
| 2006 |
0.40 |
– |
4.25 |
4.85 |
– |
– |
0.16 |
– |
– |
0.16 |
– |
0.38 |
– |
– |
– |
– |
– |
– |
– |
||
| 2007 |
0.33 |
– |
4.55 |
3.92 |
– |
0.57 |
0.21 |
– |
– |
0.41 |
0.14 |
0.23 |
0.56 |
– |
– |
– |
– |
– |
– |
||
| 2008 |
– |
– |
4.00 |
3.61 |
– |
1.10 |
0.09 |
– |
– |
0.08 |
0.08 |
1.36 |
1.53 |
– |
0.22 |
– |
– |
– |
– |
||
| 2009 |
0.60 |
– |
3.77 |
3.71 |
0.24 |
1.56 |
0.16 |
– |
– |
0.08 |
– |
0.93 |
0.67 |
– |
0.08 |
– |
– |
– |
– |
||
| 2010 |
1.06 |
– |
2.62 |
3.68 |
0.67 |
3.75 |
0.50 |
0.42 |
– |
0.17 |
– |
1.09 |
0.35 |
– |
0.51 |
– |
0.07 |
– |
– |
||
| 2011 |
0.38 |
– |
2.65 |
4.49 |
0.25 |
5.34 |
0.17 |
0.08 |
0.19 |
0.67 |
– |
0.92 |
0.78 |
– |
0.07 |
0.08 |
0.17 |
– |
0.07 |
||
| 2012 |
0.35 |
– |
2.54 |
3.88 |
– |
8.27 |
– |
– |
– |
0.34 |
0.08 |
1.69 |
0.17 |
– |
0.08 |
– |
0.08 |
– |
0.09 |
||
Sources: BP (2003-2012); GIIGNL (2013). Note: data in billion cubic meters (1 bcm LNG = 1.38 Mt LNG
Appendix B: Data
| Explanation | country |
2002 |
2003 |
2004 |
2005 |
2006 |
2007 |
2008 |
2009 |
2010 |
2011 |
2012 |
| Importer HHI | China |
1.0000 |
0.7397 |
0.6699 |
0.4156 |
0.2403 |
0.1781 |
0.2205 |
||||
| India |
1.0000 |
0.9230 |
0.7305 |
0.6938 |
0.5563 |
0.4435 |
0.7560 |
0.5864 |
0.6138 |
|||
| Japan |
0.1938 |
0.1898 |
0.1790 |
0.1773 |
0.1596 |
0.1485 |
0.1399 |
0.1461 |
0.1419 |
0.1267 |
0.1224 |
|
| Korea |
0.2335 |
0.2431 |
0.2167 |
0.2191 |
0.2028 |
0.2180 |
0.1988 |
0.1775 |
0.1349 |
0.1385 |
0.1577 |
|
| Taiwan |
0.5172 |
0.5316 |
0.4968 |
0.4493 |
0.4031 |
0.3111 |
0.2368 |
0.2311 |
0.1717 |
0.2178 |
0.3014 |
|
| Region |
0.1954 |
0.1886 |
0.1832 |
0.1796 |
0.1594 |
0.1515 |
0.1370 |
0.1427 |
0.1348 |
0.1291 |
0.1455 |
|
| Number of suppliers (1) | China |
1 |
4 |
6 |
11 |
13 |
12 |
11 |
||||
| India |
1 |
3 |
8 |
8 |
11 |
12 |
6 |
12 |
6 |
|||
| Japan |
8 |
9 |
9 |
9 |
12 |
13 |
14 |
13 |
16 |
19 |
21 |
|
| Korea |
7 |
7 |
9 |
8 |
10 |
11 |
12 |
13 |
17 |
16 |
16 |
|
| Taiwan |
2 |
2 |
3 |
4 |
6 |
9 |
9 |
10 |
12 |
15 |
11 |
|
| Region |
8 |
10 |
10 |
10 |
12 |
13 |
15 |
16 |
18 |
19 |
21 |
|
| LNG prices (2) |
4.27 |
4.77 |
5.18 |
6.05 |
7.14 |
7.73 |
12.55 |
9.06 |
10.91 |
14.73 |
16.57 |
|
| LNG import volumes (3) | China |
0.00 |
0.00 |
0.00 |
0.00 |
1.00 |
3.87 |
4.44 |
7.64 |
12.80 |
16.62 |
20.26 |
| India |
0.00 |
0.00 |
2.63 |
6.04 |
7.99 |
9.98 |
10.79 |
12.63 |
12.15 |
17.11 |
18.31 |
|
| Japan |
72.74 |
77.77 |
76.95 |
76.32 |
81.86 |
88.82 |
92.13 |
85.90 |
93.48 |
106.95 |
120.50 |
|
| Korea |
24.06 |
26.23 |
29.89 |
30.45 |
34.14 |
34.39 |
36.55 |
34.33 |
44.44 |
49.30 |
50.62 |
|
| Taiwan |
7.00 |
7.48 |
9.13 |
9.61 |
10.20 |
10.92 |
12.07 |
11.80 |
14.89 |
16.31 |
17.57 |
|
| Region |
103.80 |
111.48 |
118.60 |
122.42 |
135.19 |
147.98 |
155.98 |
152.30 |
177.76 |
206.29 |
227.26 |
|
| Spot and short-term share of LNG imports (4) | China |
0.19 |
0.17 |
0.12 |
0.17 |
0.22 |
||||||
| India |
0.38 |
0.49 |
0.18 |
0.34 |
0.43 |
|||||||
| Japan |
0.15 |
0.09 |
0.10 |
0.20 |
0.22 |
|||||||
| Korea |
0.24 |
0.10 |
0.17 |
0.30 |
0.25 |
|||||||
| Taiwan |
0.34 |
0.21 |
0.24 |
0.29 |
0.22 |
|||||||
| Region |
0.20 |
0.14 |
0.14 |
0.24 |
0.25 |
|||||||
| Experience as an LNG importer (5) | China |
0 |
1 |
2 |
3 |
4 |
5 |
6 |
||||
| India |
0 |
1 |
2 |
3 |
4 |
5 |
6 |
7 |
8 |
|||
| Japan |
33 |
34 |
35 |
36 |
37 |
38 |
39 |
40 |
41 |
42 |
43 |
|
| Korea |
15 |
16 |
17 |
18 |
19 |
20 |
21 |
22 |
23 |
24 |
25 |
|
| Taiwan |
12 |
13 |
14 |
15 |
16 |
17 |
18 |
19 |
20 |
21 |
22 |
|
| Region |
33 |
34 |
35 |
36 |
37 |
38 |
39 |
40 |
41 |
42 |
43 |
|
| Share of non-regional LNG imports (6) | China |
0.00 |
0.15 |
0.18 |
0.14 |
0.23 |
0.39 |
0.44 |
||||
| India |
0.00 |
0.03 |
0.11 |
0.14 |
0.22 |
0.31 |
0.10 |
0.21 |
0.23 |
|||
| Japan |
0.24 |
0.25 |
0.26 |
0.24 |
0.28 |
0.32 |
0.34 |
0.28 |
0.26 |
0.34 |
0.42 |
|
| Korea |
0.54 |
0.56 |
0.49 |
0.48 |
0.52 |
0.58 |
0.62 |
0.54 |
0.55 |
0.55 |
0.58 |
|
| Taiwan |
0.00 |
0.00 |
0.01 |
0.02 |
0.07 |
0.19 |
0.37 |
0.29 |
0.46 |
0.52 |
0.61 |
|
| Region |
0.29 |
0.30 |
0.29 |
0.30 |
0.35 |
0.38 |
0.40 |
0.37 |
0.37 |
0.42 |
0.45 |
|
III. REFERENCES
BP, 2003. BP Statistical Review of World Energy 2003. BP, London.
BP, 2004. BP Statistical Review of World Energy 2004. BP, London.
BP, 2005. BP Statistical Review of World Energy 2005. BP, London.
BP, 2006. BP Statistical Review of World Energy 2006. BP, London.
BP, 2007. BP Statistical Review of World Energy 2007. BP, London.
BP, 2008. BP Statistical Review of World Energy 2008. BP, London.
BP, 2009. BP Statistical Review of World Energy 2009. BP, London.
BP, 2010. BP Statistical Review of World Energy 2010. BP, London.
BP, 2011. BP Statistical Review of World Energy 2011. BP, London.
BP, 2012. BP Statistical Review of World Energy 2012. BP, London.
BP, 2013. BP Statistical Review of World Energy 2013. BP, London.
Choo, J., 2009. Northeast Asia energy cooperation and the role of China and Japan. In: Len,
C., Chew, E. (Eds.), Energy and Security Cooperation in Asia: Challenges and Prospects. Institute for Security and Development Policy. Stockholm, Sweden, pp. 41–60.
Christie, E. 2009. Energy vulnerability and EU-Russia energy relations. Journal of
Contemporary European Research, 5(2), 274-92.
Clemente, J., 2012. Natural gas – international: China to supply huge natural gas growth.
Natural Gas & Electricity, 29(1), 13-20.
Cohen, G., Joutz, F., Loungani, P., 2011. Measuring energy security: trends in the diversification of oil and natural gas supplies. Energy Policy, 39(9), 4860-69.
The Economist, 2012. LNG: a liquid market. 14 June.
Energy Information Administration (EIA), U.S. Department of Energy, 2012. China: country analysis brief. 4 September.
Energy Information Administration (EIA), U.S. Department of Energy, 2011a. Korea, South: country analysis brief. 11 October.
Energy Information Administration (EIA), U.S. Department of Energy, 2011b. India: country analysis brief. 21 November.
Fesharaki, F., Wu, K., Banaszak, S., 2000. Natural gas: the fuel of the future in Asia. East-
West Center, AsiaPacific Issues, no. 44, June.
Frondel, M., Ritter, N., Schmidt, C.M., 2012. Measuring long-term energy supply risks: a G7 ranking. SFB 823, Discussion Paper, Nr. 28/2012.
Frondel, M., Schmidt. C.M., 2008. Measuring energy security—a conceptual note. Ruhr
Economics Papers #52, July.
GIIGNL (International Group of Liquefied Natural Gas Exporters), 2009. The LNG industry in 2008. GIIGNL, Paris.
GIIGNL (International Group of Liquefied Natural Gas Exporters), 2010. The LNG industry in 2009. GIIGNL, Paris.
GIIGNL (International Group of Liquefied Natural Gas Exporters), 2011. The LNG industry in 2010. GIIGNL, Paris.
GIIGNL (International Group of Liquefied Natural Gas Exporters), 2012. The LNG industry in 2011. GIIGNL, Paris.
GIIGNL (International Group of Liquefied Natural Gas Exporters), 2013. The LNG industry in 2012. GIIGNL, Paris.
Government of India, 2006. Integrated energy policy: report of the Expert Committee Planning Commission, August.
Government of Japan, 2002. Basic Act on Energy Policy. Act No. 71, 14 June.
Government of the People’s Republic of China, Office of State Council, 2006.
更好地实施“走出去”战略 [Improved implementation of the “going-out” strategy]. 15 March.
Grubb, M., Butler, L., Twomey, P., 2006. Diversity and security in UK electricity generation: the influence of low-carbon objectives. Energy Policy, 34(18), 4050–4062.
Gupta, E., 2008. Oil vulnerability index of oil-importing countries. Energy Policy, 36(3),1195–1211.
Hanser, P.Q., 2012. Impact of U.S. LNG on international gas prices. Paper presented to EIA International Natural Gas Workshop, 23 August.
Helm, D., 2002. Energy policy: security of supply, sustainability and competition. Energy Policy, 30(3), 173–184.
Hosoe, T., 2012. LNG’s role in post-Fukushima Japanese energy policy. Oil & Gas Journal, 2 April.
Jaffe, A.M., Soligo, R., 2006. Market structure in the new gas economy: is cartelization possible? In Victor, D.G., Jaffe, A.M., Hayes, M.H. (Eds.), Natural Gas and Geopolitics: From 1970 to 2040. Cambridge University Press, Cambridge, UK, pp. 439-464.
Jun, E., Kim, W., Chang, S.H., 2009. The analysis of security cost for different energy sources. Applied Energy, 86(10), 1894-1901.
Kumar, S., Kwon, H.-T., Choi K.-H., Cho, J.H., Lim, W., Moon, I., 2011. Current status and future projections of LNG demand and supplies: a global perspective. Energy Policy, 39(7), 4097-4104.
Langton, T. 1994. LNG prospects in the Asia-Pacific region. Resources Policy, 20(4), 257-64.
Le Coq, C., Paltseva, E., 2009. Measuring the security of external energy supply in the
European Union. Energy Policy, 37(11), 4474-4481.
Leiby, P.N., 2007. Estimating the energy security benefits of reduced US oil imports. Oak
Ridge National Laboratory, 23 July.
Lesbirel, S.H., 2004. Diversification and energy security risks: the Japanese case. Japanese Journal of Political Science, 5(1), 1-22.
Loschel, A., Moslener, U., Rubbelke, D., 2010. Indicators of energy security in industrialized countries. Energy Policy, 38(4), 1665-1671.
Ministry of Economic Affairs, Taiwan, 2009. Taiwan’s sustainable energy policy framework, energy saving and carbon reduction action plans. GO-MOEA Newsletter, June.
Ministry of Economy, Trade and Industry (METI), Government of Japan, 2010. The Strategic Energy Plan of Japan (summary). 18 June.
Ministry of Knowledge Economy, Republic of Korea, 2011. Trade policies.
Natural Gas Asia, 2011. Increased global LNG demand forecast. 30 August.
Neff, T.L. 1997. Improving energy security in Pacific Asia: diversification and risk reduction
for fossil and nuclear fuels. Commissioned by the Pacific Asia Regional Energy Security (PARES) Project, December.
PFC Energy, 2012. LNG markets study. June.
Smith, R., 2012. Asian natural gas: a softer market is coming. Paper presented at the U.S. EIA’s International Natural Gas Workshop, 23 August.
Standard & Poor’s, 2012. What’s behind the boom in global liquefied natural gas development? Global Credit Portal, 20 April.
Stevens, P., 2010. The ‘shale gas revolution’: hype and reality. A Chatham House Report, September.
Stringer, K.D., 2008. Energy security: applying a portfolio approach. Baltic Security & Defence Review, 10, 121–142.
Vivoda, V., 2009. Diversification of oil import sources and energy security: a key strategy or an elusive objective? Energy Policy, 37(11), 4615-4623.
Vivoda, V., 2010. Evaluating energy security in the Asia-Pacific region: A novel methodological approach. Energy Policy, 38(9), 5258-5263.
Vivoda, V., 2012. Japan’s energy security predicament post-Fukushima. Energy Policy, 46,135-143.
Vivoda, V., Manicom, J., 2011. Oil import diversification in Northeast Asia: a comparison between China and Japan. Journal of East Asian Studies, 11(2), 223-254.
Wood, D.A., 2012. A review and outlook for the global LNG trade. Journal of Natural Gas Science and Engineering, 9, 16-27.
Wu, G., Liu, L.C., Wei, Y.-M., 2009. Comparison of China’s oil import risk: results based on portfolio theory and a diversification index approach. Energy Policy, 37(9), 3557-3565.
Wu, G., Wei, Y.-M., Fan, Y., Liu, L.C., 2007. An empirical analysis of the risk of crude oil imports in China using improved portfolio approach. Energy Policy, 35(8), 4190–4199.
Yoo, M., 2011. South Korea’s 10th long-term natural gas supply/demand plan (summary).
The Institute of Energy Economics, Japan, May.
IV. NAUTILUS INVITES YOUR RESPONSES
The Nautilus Peace and Security Network invites your responses to this report. Please leave a comment below or send your response to: nautilus@nautilus.org. Comments will only be posted if they include the author’s name and affiliation.