
DAVID VON HIPPEL
May 27, 2019
I. INTRODUCTION
In this report, David von Hippel “provides a demonstration of the potential impact of remote sensing methods and testing in the DPRK in reducing uncertainties in cumulative historical uranium production, and thus in fissile materials inventories; and, offers conclusions, resulting from the potential impacts of uncertainty reduction approaches, as to which verification procedures should be key targets during negotiations with the DPRK.”
The full report may be downloaded here (PDF file).
David von Hippel is a Nautilus Institute Senior Associate.
The views expressed in this report do not necessarily reflect the official policy or position of the Nautilus Institute. Readers should note that Nautilus seeks a diversity of views and opinions on significant topics in order to identify common ground.
This report is published under a 4.0 International Creative Commons License the terms of which are found here. It is published by Nautilus Institute here; by the Asia-Pacific Leadership Network for Nuclear Non-Proliferation and Disarmament here; and by the Research Center for the Abolition of Nuclear Weapons, Nagasaki University, here.
Banner image: Uranium concentration plant at Pyongsan, DPRK. Source, Google Earth from here
II. NAPSNET SPECIAL REPORT BY DAVID VON HIPPEL
METHODS FOR REFINING ESTIMATES OF CUMULATIVE DPRK URANIUM PRODUCTION
MAY 27, 2019
Summary
This paper summarizes the history of what is known about uranium mining in the DPRK; describes the major uncertainties regarding DPRK uranium production; notes some of the key techniques, as used in preparing estimates of nuclear sector activity in other nations, that might be available to assist in narrowing the range of estimates of DPRK uranium and processed fissile material production; summarizes estimates of enriched uranium and plutonium production prepared by other authors; describes existing estimates of the amounts of fissile materials used in nuclear weapons tests and exported; provides a demonstration of the potential impact of remote sensing methods and testing in the DPRK in reducing uncertainties in cumulative historical uranium production, and thus in fissile materials inventories; and, offers conclusions, resulting from the potential impacts of uncertainty reduction approaches, as to which verification procedures should be key targets during negotiations with the DPRK.
This Special Report provides the following excerpts only from the full report:
The full report may be downloaded here (PDF file).
1 Introduction and Statement of Problem
2 History of Uranium Mining in the DPRK..
2.1 Mining sites: location, extent, dates of known mining.
2.2 Processing sites and complexes.
2.4 Trade in uranium and related ores with other nations (Russia, China)
2.5 Existing estimates of total uranium production as prepared by others.
3 Major Uncertainties in Preparing Estimates of Historical DPRK Uranium Production.
3.3 Uranium remaining in wastes after processing.
3.4 Unreported exports to other nations.
3.5 Uncertainties as to whether DPRK has uranium in storage.
4 Techniques and Tests to Try to Narrow Uncertainties.
4.1 Satellite imagery measurements of ore slag piles, and other features near mines and mills.
4.2 Satellite imagery measurements of uranium mills.
4.3 On-site measurements of ore slag piles near mines.
4.5 Isotopic examination of ore slag piles.
4.6 Evaluation of uranium content of ore samples by mine.
4.8 Establishing Nuclear Forensic Signatures for mines.
4.9 Information for confirmation of past U ore imports by trade partners.
5 Estimates of Enriched Uranium Produced.
6 Estimates of Plutonium (Pu) Produced.
7 Estimates of Uranium and Plutonium Used in DPRK Weapons Tests.
8.1 Presentation of central estimate and range of estimates at present
9.3 Practical issues associated with verification testing.
1 Introduction and Statement of Problem
Recent weeks and month have seen what appears to be a series of improvements in relationships between the Democratic People’s Republic of Korea (DPRK) and the international community. In particular, summit meetings between Republic of Korea (ROK) President Moon and North Korean leader Kim Jong Un, a meeting between Kim Jong Un and United States President Donald Trump, and advancing planning for a second Trump-Kim summit have raised hopes for progress in talks to “denuclearize” the DPRK. Reaching agreement on, and then implementing a process of dismantling the DPRK’s nuclear weapons production facilities, and of removing from the Korean Peninsula (or otherwise isolating under international oversight) the DPRK’s nuclear weapons and fissile material, is likely to take years, perhaps more than a decade. In the meantime, it is important that the international community be able estimate as accurately as possible the amount of uranium—enriched and natural—that has been produced and used in the DPRK over the decades since its first foray into nuclear technologies, starting in the 1960s or before,[1] as well as the amount of plutonium that has been produced in irradiated fuel and separated via reprocessing. Determination and verification of the potential quantity of fissile material existing in DPRK as a result of mining and processing activities in advance of the DPRK’s own declaration of its inventory of fissile materials will require a combination of remote sensing analysis and on-the-ground tests at DPRK uranium mines and other facilities to narrow the range of estimates of historical uranium production, and of the resulting inventory of fissile materials likely to exist in the DPRK.
8. Impact of Narrowing Uncertainties in Uranium Production on Estimate of Overall Current DPRK Processed Uranium and Fissile Material Inventories
An exhaustive estimate of the total uranium produced by the DPRK, and thus of an upper bound on the amount of fissile material available to the DPRK (assuming no or insignificant imports of same) would in theory require determined values or estimates for a number of different parameters. These parameters would include:
- The average capacity of DPRK uranium mines, ideally by historical period
- The average capacity factor of DPRK uranium mines, also by historical period
- The capacity of uranium mills, and/or the fraction of uranium ore milled to produce natural uranium
- The fraction of uranium ore (or other forms of uranium) exported to other nations, also ideally by historical period
- The average fraction of uranium in uranium ore (which may have changed over the history of DPRK uranium production)
- The efficiency with which uranium mills convert uranium to yellowcake (U3O8)
Estimates of the amount of fissile materials produced from the DPRK’s uranium output would further require:
- Estimates of the efficiency of conversion of uranium in yellowcake to uranium hexafluoride and back to uranium oxide for reactor fuel
- Estimates of the fraction of purified forms of natural uranium (UF6, UO3, uranium metal) retained in storage, versus the fraction undergoing enrichment or conversion to natural uranium reactor fuel (for example, for use in Yongbyon “5 MWe” reactor)
- Estimates of the fraction of uranium remaining in uranium “tails” (depleted uranium) from enrichment to HEU and LEU
- Estimates of the fraction of Pu in reprocessed fuel prior to reprocessing
- Estimates of the efficiency of Pu recovery during reprocessing
We have undertaken what must be considered initial estimates of the amount of uranium that may have been mined and milled over time in the DPRK using two different procedures. The first, which might be called “top-down” starts with the estimates of the amount of fissile materials thought by others (as described above) to be held by the DPRK and/or have been used in weapons tests, and calculates the volumes of uranium and uranium ore implied to have been produced. The second approach starts with estimates of the DPRK uranium mining capacity and estimates overall uranium ore and refined uranium production. Comparison of the differences between the two estimates, including sensitivity analysis with the second approach, is used to try and determine what types of information should be sought, either on the ground or by remote means, to try and narrow down the estimates of uranium available to the DPRK as a part of nuclear weapons/nuclear materials verification in support of a denuclearization agreement. Below, and in the annexes that follow, we present the methods and results of our estimates.
8.1. Presentation of central estimate and range of estimates at present
“Top-down” Estimates of Uranium and Uranium Ore Produced by the DPRK
Starting with the ranges of estimates of enriched uranium and plutonium production prepared by others, and summarized above, and selecting “central” estimates from those ranges, we estimate that on the order of 200 to 800 tonnes of natural uranium (as U, not uranium oxides) would be required to produce the ranges of enriched uranium—as HEU for weapons (or possibly some for the Yongbyon research reactor) and as LEU for the DPRK’s ELWR—and plutonium described above. A central estimate is 400 tonnes uranium. These calculations are shown in Annex 1. Please note that in both Annex 1 and 2, although results are shown for convenience to many digits, the figures shown should probably not be considered accurate to more than one significant figure.
Using a range of average uranium concentrations in DPRK ore of 0.15 percent to 0.9 percent, with a central estimate of 0.25 percent, we get uranium ore requirements implied by the production estimates above ranging from about 20 thousand to 600 thousand tonnes, with a central estimate of somewhat under 200,000 tonnes.
Note that these are cumulative, not annual figures. Note also that these figures do not include any estimates of the amount of uranium in processed or ore form that the DPRK may have in storage. We would consider the possibility of significant amounts of ore being held in storage less likely than storage of processed uranium, as to the bulk of ore that would have to be stored would be on the order of one hundred to (more likely) over one thousand times the volume of processed yellowcake with the same uranium content.
“Bottom-up” Estimates of Uranium and Uranium Ore Produced by the DPRK
Starting with estimates of DPRK uranium mining capacity, and implicitly assuming that most, if not all, mined uranium is processed to yellowcake (and that therefore the processing capacity is sufficient to more or less keep up with ore production), we estimate that between about 200 and 7,000 tonnes of natural uranium (tonnes U) has been produced by the DPRK, with a central estimate of about 800 tonnes U. Note that this estimate excludes uranium that may have been exported (mostly as ore, but possibly in small part in refined form) and thus remains in the country in some form—as yellowcake or other uranium oxides, uranium metal, UF6, HEU, LEU, depleted uranium or as Pu produced from uranium.
The lower end of this estimate starts with mine capacity of 29,000 tonnes of ore per year, which is the sum of the estimates for two major mines described by Yoon (ibid). The higher end of the estimate is capacity doubles that estimate, and a central value was chosen as 38,000 tonnes/yr, which assumes that the other mines (that is, apart from Pyongsan and Woong-gi) that have been noted in various articles sum to a capacity of about 10,000 tonnes of ore annually. Using the same range of ore concentrations—from 0,15% U to 0.9% uranium—implies total cumulative uranium ore output (net of exports) of about 200,000 to 1 million tonnes of ore, with a central estimate of about 400,000 tonnes. See Annex 2 for details of these calculations.
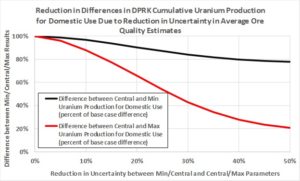
Figure 5 shows the differences, in percentage terms, between uranium production (net of exports), as the differences between the minimum and central and central and maximum estimates of production capacity are reduced. Figure 6 shows how the difference between these pairs of estimates is reduced as the range of estimates of ore quality are reduced.
Figure 5
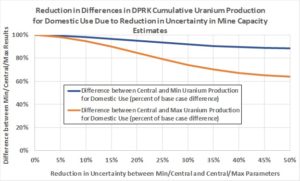
Figure 6
A key input assumption in these calculations are the annual average capacity factors for different periods (each a decade or more) in which the DPRK produced uranium. These annual capacity factors are our rough estimates and range from 5 percent—of what are assumed to have been the highest capacities achieved by the DPRK over the years—in the early years of production, to up to 50 percent in the 1990s.
Comparison of Top-down and Bottom-up Estimates
The ranges of the top-down and bottom-up estimates of natural uranium and uranium ore produced above do not match up entirely, but do overlap. Particularly at the low end of the range, for total uranium production as expressed as tonnes of elemental U, the two estimates are relatively close, at near 200 tonnes uranium. The estimates diverge somewhat in going from the “minimum” end of the range through central estimates to the “maximum” values, which could imply uranium in storage as natural (probably refined) uranium. We prepared a rough calculation of the amount of space that might be required to store all of the refined (for example, as yellowcake) uranium produced by the DPRK (net of exports, but including all forms of uranium, and uranium and plutonium that has been used in weapons tests. The space required for uranium storage ranges from 1000 square meters (smaller than the buildings on site at the known uranium refining facilities in the DPRK) to about 40,000 square meters (several such buildings), but in either case is not so large that it would be difficult for the DPRK to conceal the stored uranium.
8.2 Using direct sampling and satellite analysis to reduce the range of uncertainty in key parameters
Direct sampling and satellite image analysis can be used together to reduce the range of uncertainty in a number of key parameters. Perhaps the most important among these is the average ore content of uranium mined in the DPRK. Our guess is that the average value for ore quality is much more likely to be near 0.2 percent than 0.9 percent, as the latter would be quite high and seems to be contradicted by the typical ore qualities in the nations in the area, as well as by Russian reports of ore quality (see above). Although multi-band analysis of satellite imagery may provide some way of assessing the ore quality in uranium mine spoil or in piles of ore waiting to be processed, it is likely that direct access and sampling (of ore, mine spoil, and mill tailings, for example) will be needed to reduce uncertainty in the range of historical uranium output. Satellite techniques for assessing the growth in spoil piles and tailings dumps would ideally be combined with on-the-ground measurements, including cores, to attempt to determine the rate of ore production and uranium refining over time.
8.3 Sensitivity analysis of degree sampling/satellite analysis would reduce range of estimates of existing uranium
Annex 3 provides calculations of how reducing the difference between the minimum and central estimates of key parameters, and between the central and high estimates, can reduce the difference in results. Differences in each of the parameters was reduced by 5 to 50 percent. A reduction of 50 percent in the difference between the minimum and central estimates of uranium mine capacity decreases the difference in uranium production net of export (as U) by about 10 percent, and in uranium ore by about 30 percent. (A reduction in the difference between minimum and central annual capacity factors for mines would have had a similar impact). A reduction of 50 percent between the central and maximum estimates for mine capacity would reduce the difference in tonnes of uranium and uranium ore available for domestic use by about 60 and 40 percent, respectively. Reduction in the differences between the estimates for ore quality by 50 percent reduce the volume of ore needed for non-exported production by about 20 percent (for minimum to central estimates) and by 80 percent for central to maximum estimates. The reduction in the latter is particularly pronounced because the difference between the central and maximum values we assumed for ore quality is large.
9 Conclusions
9.1 Overall current understanding of potential range of historical U production in the DPRK, and of potential net inventories of U
Based on the above, total historical uranium production (net of export) in the DPRK is estimated to be in the range from about 200 to 1000 tonnes of uranium as U, with ore production in the range from tens of thousands of tonnes to up to a million tonnes, with hundreds of thousands of tonnes being more likely, in our opinion.
9.2 Implications for verification tests that should be a part of a negotiated settlement with the DPRK
It will be crucial to obtain a better understanding of ore quality in the DPRK in particular, so sampling of ore bodies, waste piles, and tailings ponds/piles at identified major mines and at uranium processing facilities will be crucial, and should be a part of any negotiated agreement. Satellite image analysis will provide a useful addition to data acquired on the ground, but likely cannot, particularly in the short term, substitute for direct sampling.
9.3 Practical issues associated with verification testing
There are, of course, a wide range of issues associated with reducing the uncertainty of uranium production estimates. These include (but are not limited to):
- Site access—that is, whether the DPRK will allow access to all identified and suspected sites involved in uranium production and processing.
- Hidden facilities, including underground facilities, are widely expected to exist for a variety of military installations, with uranium processing and enrichment among them.
- Sampling error or bias, caused by not being able, through physical or access impediments, or to lack of equipment, manpower, and/or time, to sample all of the relevant parts of a given uranium-bearing stratum, spoils pile, tailing pile, or other input to our output of the uranium industry.
- Access to mining and processing records at all the sites and facilities involved in uranium mining, processing, enrichment, and fabrication.
Maximizing access to sites and records and making arrangements that will allow the minimizing of sampling errors and of missed hidden facilities, as well as reducing, to the extent possible, any other issues likely to limit the effectiveness of verification testing, will be a goal of negotiations on verification protocols.
III. ENDNOTES
[1] See, for example, Jonathan McLaughlin (2017), “North Korea Nuclear Milestones – 1962-2017“, The Wisconsin Project, dated September 29, 2017, and available as https://www.wisconsinproject.org/north-korea-nuclear-milestones/. Other sources refer to a nuclear cooperation agreement signed by the DPRK and Russia in 1959, predated by nuclear prospecting by both the Japanese during World War II and by the Russians as early as 1946.
IV. NAUTILUS INVITES YOUR RESPONSE
The Nautilus Asia Peace and Security Network invites your responses to this report. Please send responses to: nautilus@nautilus.org. Responses will be considered for redistribution to the network only if they include the author’s name, affiliation, and explicit consent