by LIU Xuegang
October 16, 2012
Nautilus invites your contributions to this forum, including any responses to this report.
CONTENTS
I. Introduction
II. Report by LIU Xuegang
III. References
IV. Nautilus invites your responses
I. Introduction
Liu Xuegang writes, “Experience with spent fuel management is limited in China. No authorized roadmap or clear decision on the back end of nuclear fuel cycle has yet been developed and approved. Thanks to the present relatively small quantity of spent fuel in storage at China’s nuclear plants, it appears that there will be no critical pressure on the development of spent fuel transportation, interim storage, large-scale reprocessing and final disposal infrastructure for a number of years. The difficulty and uncertainty of development of nuclear power and nuclear fuel cycle facilities, however, have been well-proved worldwide in the past. China’s strategy of spent fuel management policy should be determined soon, and should be based on a comprehensive and scientific planning process that allows consideration of all reasonable options, issues, and points of view.”
Xuegang Liu is a Doctor at the Nuclear Chemistry and Technology Division at the Institute of Nuclear and New Energy Technology, Tsinghua University, Beijing, P. R. China.
The views expressed in this report do not necessarily reflect the official policy or position of the Nautilus Institute. Readers should note that Nautilus seeks a diversity of views and opinions on significant topics in order to identify common ground.
China’s Nuclear Energy Development and Spent Fuel Management Plans
by LIU Xuegang
1. Nuclear energy in China
1.1 China’s Energy Development History (1990s to 2005)
Although China is one of the world’s five recognized nuclear-weapon states, the history of nuclear energy utilization in mainland China spans only the past 18 years. China’s program of nuclear power reactor construction started in the 1980s. Three reactor units with a total installed capacity of 2.1 gigawatts (GW) were placed in operation in 1994 in mainland China—two 944 MWe units at Daya Bay, near Shenzhen, and a 279 MWe unit at Qinshan. At that time, nuclear power accounted for only about 1% of national electricity generation. No further nuclear power stations were commissioned during the following eight years. Relative to that early period of commercial nuclear energy development, China’s current ambitious nuclear program is a dramatic departure. To understand the reasons behind the slow pace of China’s nuclear energy development before 2000s, a review of the evolution of China’s overall national energy policy is in order.
Since the national economic reforms of the late 1970s, China has experienced unprecedented economic growth. Market mechanisms have gradually overtaken the central planning system as the primary driver of changes in the national economy. Unlike, however, other sectors in which the market mechanism grew to play a dominant role in matching the supply of goods and services with demand, the electric utility industry, probably the last bastion of the centrally-planned economy, retained its old development patterns largely unchanged. This mismatch in economic planning between the electricity supply sector and the sources of electricity demand caused insufficient investment in electricity generation infrastructure. As a consequence, the increase of electricity generation capacity lagged behind the pace of economic growth for several years. Figure 1 shows the growth rates of China’s GDP, installed electricity generation capacity, and electricity generated from 1990 through 2005. Just after 2000, various factors, including an explosion in electricity demand caused by the combination of economic development and rising incomes, resulted in a nation-wide electricity crisis. The shortage of electricity soon spread to most provinces of China. In 2004, 24 out of 31 provinces experienced electricity shortages. The total economic loss during that period due to electricity shortages has been estimated to have been around one trillion RMB. The post-2000 power shortages, together with increasing environmental concerns related to fossil fuels consumption, served to convince the Chinese government that revisions to its previous energy policies were required. As a result, a number of research programs were carried out by various research groups to investigate the status and trends of key aspects of energy supply and demand in China, with the resulting information used to draw a roadmap of national energy development to help to inform policy decisions.

Figure 1: Annual growth rates in China’s GDP, installed generation capacity and electricity generation, 1990 to 2005[1]
The future demand for electricity in China has been estimated by various research groups, based mostly on analytical methods estimating electricity consumption per capita or per unit GDP, or by applying a constant annual growth rate. Representative forecasts of electricity consumption in 2020 in China by a several groups are provided in Table 1. Compared with the total electricity consumption in 2004 (2187 TWh), upon which most of these projections are based, electricity demand in 2020 is estimated to more than double. In term of installed electricity capacity in 2004 (442 GWe in 2004 [2]), the net required capacity increase was projected to total 400~ 650 GWe between 2004 and 2020.
|
Organization |
Date |
Electricity Demand |
|
Energy Information Agency |
2006 |
4,256 |
|
State Grid Corporation of China |
—- |
4,400 |
|
Development Research Center |
2004 |
5,226 |
|
China Development Bank |
2005 |
5,280-5,780 |
Table 1: Typical forecasts of electricity consumption in 2020 [3]
China has abundant energy resources. The country has the world’s third-largest coal reserves and massive hydroelectric resources. As a result, the majority of electricity produced in China is generated using coal-fired power plants and hydroelectric plants. Other energy sources—including nuclear, oil, gas and new energies—only power a small portion of total electricity generation in China. To evaluate the prospects for future electricity supplies in China, all energy sources must be taken into consideration.
- Coal
China produces and consumes more coal than any other nation. About 80% of electricity generation is from coal. In 2004 coal-fired electricity output was 1,807 TWh, accounting for 82.6% of total generation. China’s heavy reliance on coal for electricity generation is expected to remain unchanged for many years to come. Electricity generation will continue to be based on coal-fired thermal power. Large scale utilization of coal, however, results in severe environmental problems such as local air pollution, acid rain, and carbon dioxide emissions. As a result, the fraction of electricity generated from coal is expected to decrease in the future due to environmental concerns.
- Hydo
As a renewable energy resource, hydroelectric power is regarded as a preferred choice for China. Hydropower represented about 16% of electricity production in 2004, and was expected to have steady growth in the future. Presently, China is the by far the world leader in hydro power plant capacity with around 200 GW, and aims to double capacity to around 400 GW by 2020 [4]. The rate of growth of hydro generation, however, was estimated to be similar to the overall rate of electricity generation growth, meaning that the fraction of hydropower electricity will stay stable as about 16%.
- Oil, gas and new energies
Electricity production from oil and gas accounted for only about 2% and 1% respectively, of total generation as of 2004. Considering the fact that China’s oil and gas imports have been increasing from year to year, with domestic production exceeded more and more by domestic demand, experts believe that electricity generation from oil and gas will be limited and decreasing. Wind, solar and biomass energy, these so-called “new energy” sources, appear promising as a way of improving to China’s energy supply security. In terms of the share of electricity generation provided by these new energy sources, however, their contributions are expected to remain relatively small.
Between 2004 and 2020, the net growth of annual electricity consumption is estimated to be between 2,100 and 3,500 TWh. The energy sources described above are likely to be insufficient to meet this increase in consumption. The resulting gap in generation is expected to be around 350~650 TWh annually by 2020. As a result, nuclear power has become an inevitable choice to augment existing electricity generation resources, and was expected to play an increasingly important role in China’s energy structure.
1.2 Motives for nuclear development
The major motivations behind China’s ambitious nuclear power program are as follows:
- The primary reason for developing nuclear power in China is unquestionably due to its potential to fill the gap between projected electricity consumption and supply as described above. No other energy source seems to have the potential to provide sufficient electricity to meet the continuing explosive growth in consumption.
- Consideration of the generally good operational record of nuclear power plants worldwide provides the second motive for China’s nuclear extension. Before the Fukushima reactor accident in 2011, no severe nuclear events had taken place worldwide since the Chernobyl nuclear accident in 1986. The nuclear power plants currently operating in China have also shown a good history of commercial operation. As a result, nuclear power was regarded as a clean, safe and economical electricity source, and was accepted gradually by more and more people in China.
- The third motive for nuclear power development in China has been the remarkable benefits for local areas that typically accompany the construction of nuclear power plants. Generally, the capital cost for nuclear power plants is paid by the central government or by centrally controlled corporations. The construction or even the approval to construct a nuclear station means that a large amount of investment will come to the region where the nuclear station is located. As a result, the local economy is stimulated by the nuclear investment, resulting in more local employment, higher local and regional GDP growth, and other local economic benefits, all of which are applauded by local government officers. With these benefits in mind, more local governments have been proposing to build nuclear power plants as a route to boosting local prosperity and economic development. In turn, nuclear electricity plans at the national level were affected by this increasing enthusiasm for nuclear power plants at the local level, and projections for implementation of nuclear power development began to change.
1.3 China’s nuclear plan and its evolution
In 2004, the National Development and Reform Commission (NDRC) began to draw up guidelines for nuclear power development. The policy document entitled “The Mid-Long Term Development Program of Nuclear Power (2005-2020)” was announced on October 2007, in which NDRC laid out its official plans to increase its total nuclear capacity to 40 GWe, as well as having additional reactors with a total capacity of 18 GWe under construction, by 2020 (amounting to about 4% of China’s total electricity generation by that year). Different governmental sections, industry experts and official media proposed their own plans of nuclear development shortly thereafter. Selected major nuclear plans proposed published between 2007 and March of 2011 are listed in Table 2.
|
Time |
Organization |
In operation by 2020 (GWe) |
Under construction by 2020 (GWe) |
|
Oct. 2007 |
National Development and Reform Commission |
40 |
18 |
|
Mar. 2008 |
National Energy Administration |
>50 |
|
|
Jun. 2008 |
State Council |
86 |
16 |
|
Jun. 2010 |
[????] |
70-80 |
|
|
Jan. 2011 |
China Daily |
86 |
Table 2: Selected nuclear capacity expansion plans announced before March 2011.
It should be noted that in 2004 the total nuclear capacity in China was only 6.7 GWe. To fulfill the plans of nuclear development described above, more than 2 GWe of nuclear capacity would have needed to be commissioned annually in each of the next sixteen years. China’s nuclear policy after 2004 therefore entered a stage of “energetic development”. More than 16 provinces, regions and municipalities have announced their intention to build nuclear power plants under the 12th Five Year Plan (2011-2015). A number of nuclear projects have started up in recent years. As of 2011, the total nuclear capacity in China stood at 11.47 GWe, with a total of 26 units under construction.
Following the Fukushima Daiichi nuclear accident in Japan, China announced on 16 March 2011, that all nuclear plant approvals were being frozen, and that “full safety checks” of existing reactors would be conducted. Although Zhang Lijun, Vice Minister of Environmental Protection, has indicated that China’s overall nuclear energy strategy would continue, some commentators have suggested that additional safety-related costs and recent shifts in public opinion could cause a rethink of the planned rapid expansion of nuclear capacity in favor of an expanded renewable energy program [5]. In March 2011, Fujian province governor Huang Xiaojing commented “Fujian has three nuclear power plants, and that is enough. Projects that have not been completed must not be continued”.
In February 2012, the State Council approved a report on the nation’s nuclear safety that confirmed the country’s nuclear power plants are constructed and operated at the highest levels of safety [6]. Zhang Guobao, former chief of the China National Energy Bureau, made the statement that “China will continue with its nuclear power programs, and have possessed the technologies to guarantee their safe operation”. In March 2012, China Daily [7] reported that “China will soon resume the approval and construction of nuclear power plants, senior officials said during the plenary session of the Chinese People’s Political Consultative Conference (CPPCC) National Committee”.
In short, the near-term influences of the Fukushima nuclear accident on China’s nuclear plans have been (1) a pause in the approval of new plants and (2) the suspension of the start of construction of four approved units. The deeper impact of the Fukushima nuclear accident for China is to boost both policymakers’ and people’s awareness of nuclear risks. As a result of this increased awareness, decisions as to whether or not to build nuclear plants will be made on a more rational basis than before. In the long term, the adoption of a more scientific decision procedure and the strict administration of the nuclear industry will benefit China’s nuclear energy development. With the implementation of these new planning and administration procedures, nuclear power might be safer, although the growth rate of nuclear capacity may be somewhat reduced. As the consequence of the response to the Fukushima nuclear accident by the Chinese public and authorities, the nuclear power capacity target for China is now more likely to be 50 to 60 GWe (rather than 70 or 80 GWe) by 2020.
1.4 The present status of nuclear power
As of March 2012, China has 14 nuclear units in commercial operation with a total capacity of 11.47 GWe. The name, capacity, type, and start year of the operating commercial nuclear units in China are listed in Table 3, based on a number of public information sources.
|
Unit |
Net capacity /MWe |
Type |
First commercial operation |
|
Daya Bay 1&2 |
900*2 |
PWR (French M310) |
1994 |
|
Qinshan Phase I |
300 |
PWR (CNP-300) |
1994 |
|
Qinshan Phase II, 1 |
600 |
PWR (CNP-600) |
2002 |
|
Qinshan Phase III, 1 |
700 |
HWR (Candu 6) |
2002 |
|
Ling’ao Phase I, 1 |
1000 |
PWR (French M310) |
2002 |
|
Qinshan Phase III, 2 |
700 |
HWR (Candu 6) |
2003 |
|
Qinshan Phase II, 2 |
600 |
PWR (CNP-600) |
2004 |
|
Ling’ao Phase I, 2 |
1000 |
PWR (French M310) |
2004 |
|
Tianwan 1&2 |
1060*2 |
PWR (VVER) |
2007 |
|
Qinshan Phase II, 3 |
650 |
PWR (CNP-600) |
2010 |
|
Ling’ao Phase II, 1 |
1000 |
PWR (CPR-1000) |
2010 |
|
Ling’ao Phase II, 2 |
1000 |
PWR (CPR-1000) |
2011 |
|
Qinshan Phase II, 4 |
650 |
PWR (CNP-600) |
Apr. 10, 2012 |
Table 3: Information on Operating Nuclear Units in China
In addition, there are 26 nuclear units under construction with a total capacity of 26.2 GWe. Construction of these 26 units began during the 2007-2010 period, and will be completed as scheduled in 2012-2015. The Fukushima nuclear accident and subsequent safety checks have had little impact on these projects, and have resulted in no serious delays in their completion. Information on nuclear units under construction is provided in Table 4.
|
Name |
Type |
Capacity (MWe) net / gross |
Construction |
Expected completion |
|
Qinshan 2-4 |
CNP-600 |
610 / 650 |
28-Jan-07 |
28-Mar-12 |
|
CNP-600 |
610 / 650 |
25-Apr-10 |
2014 |
|
|
Changjiang 2 |
CNP-600 |
610 / 650 |
21-Nov-10 |
2015 |
|
1,000 / 1,087 |
30-Jul-10 |
2015 |
||
|
CPR-1000 |
1,000 / 1,087 |
26-Dec-08 |
Dec-13 |
|
|
Fangjiashan 2 |
CPR-1000 |
1,000 / 1,087 |
17-Jul-09 |
Oct-14 |
|
CPR-1000 |
1,000 / 1,087 |
21-Nov-08 |
Oct-13 |
|
|
Fuqing 2 |
CPR-1000 |
1,000 / 1,087 |
17-Jun-09 |
Aug-14 |
|
Fuqing 3 |
CPR-1000 |
1,000 / 1,087 |
31-Dec-10 |
Jul-15 |
|
1,000 / 1,250 |
24-Sep-09 |
May-14 |
||
|
Haiyang 2 |
AP1000 |
1,000 / 1,250 |
21-Jun-10 |
Mar-15 |
|
CPR-1000 |
1,000 / 1,080 |
18-Aug-07 |
Oct-12 |
|
|
Hongyanhe 2 |
CPR-1000 |
1,000 / 1,080 |
28-Mar-08 |
2013 |
|
Hongyanhe 3 |
CPR-1000 |
1,000 / 1,080 |
7-Mar-09 |
2014 |
|
Hongyanhe 4 |
CPR-1000 |
1,000 / 1,080 |
15-Aug-09 |
|
|
CPR-1000 |
1,000 / 1,087 |
18-Feb-08 |
Dec-12 |
|
|
Ningde 2 |
CPR-1000 |
1,000 / 1,080 |
12-Nov-08 |
2013 |
|
Ningde 3 |
CPR-1000 |
1,000 / 1,080 |
8-Jan-10 |
2014 |
|
Ningde 4 |
CPR-1000 |
1,000 / 1,080 |
29-Sep-10 |
2015 |
|
AP1000 |
1,000 / 1,115 |
19-Apr-09 |
Nov-13 |
|
|
Sanmen 2 |
AP1000 |
1,000 / 1,115 |
17-Dec-09 |
Sep-14 |
|
1,700 / 1,750 |
28-Oct-09 |
Dec-13 |
||
|
Taishan 2 |
EPR |
1,700 / 1,750 |
15-Apr-10 |
Nov-14 |
|
CPR-1000 |
1,000 / 1,087 |
16-Dec-08 |
Aug-13 |
|
|
Yangjiang 2 |
CPR-1000 |
1,000 / 1,087 |
4-Jun-09 |
2014 |
|
Yangjiang 3 |
CPR-1000 |
1,000 / 1,087 |
15-Nov-10 |
2015 |
|
Total capacity |
26,230 / 28,610 |
|||
Table 4: Information in Nuclear Units Under Construction [8]
Beyond these existing and under-construction units, approximately 14 planned nuclear projects with a total capacity of 28.6 GWe have been submitted to the central government’s National Development and Reform Commission (NDRC) for approval. The approvals process in China for new nuclear units has three stages [9]:
1. Sitting and feasibility study, with project approval from NDRC.
2. Construction, requiring first a construction permit and later a fuel loading permit from the National Nuclear Safety Administration (NNSA).
3. Commissioning, leading to awarding of an NNSA operating permit.
The preparation work for planned nuclear projects is underway at all of these sites, but approvals for the projects have been deferred until the safety checks are finished. Four previously approved projects, which were ready to start construction in 2011, have also been delayed.
The layout of China’s nuclear units is shown in Figure 2 [10].

Figure 2: Location of China’s nuclear units
1.5 Scenarios of nuclear development in China (2012 to 2035)
This study considers two nuclear expansion scenarios based on different estimates of how nuclear capacity in China might be added to in the future. Both scenarios assume that the current 26.2 GWe of units under construction will be commissioned without significant delays.
The first scenario is a low-growth scenario, which anticipates 50 and 100 GWe of total installed nuclear capacity in 2020 and 2035 respectively. In this scenario, about half of the currently planned nuclear units (12.3 GWe of 28.6 GWe) will come into commercial operation by 2020. The second scenario is a high-growth scenario, which anticipates more nuclear expansion in 2020 and 2035 with 60 and 150 GWe of installed capacity, respectively, in those years. Almost all planned nuclear units (22.3 GWe of 28.6 GWe) will come into operation by 2020 under this scenairo. As a rough estimate, the nuclear capacity growth between 2020 and 2035 in both scenarios is assumed to proceed at a constant rate. The growth of nuclear capacity under the two scenarios is depicted in Figure 3 and Table 5.
Figure 3 Two envisaged nuclear growth scenarios

Table 5: Nuclear installed capacity in given years
|
Year |
low case (GWe) |
high case (GWe) |
|
2011 |
11.5 |
11.5 |
|
2020 |
50 |
60 |
|
2025 |
66.7 |
90 |
|
2030 |
83.3 |
120 |
|
2035 |
100 |
150 |
2 Experience with and plans for spent fuel management in China
2.1 Calculation of spent fuel production
2.1.1 Description and calculations
Since the mass of spent fuel produced by operating reactors is ultimately essentially equal to the mass of fresh nuclear fuel loaded into the reactors, the mass of spent fuel discharged from reactors per year is obtained as:
![]()
Where:
Q: the thermal output of the reactor
M: the mass of discharge spent fuel per year (tHM)
Pe: the installed electric capacity (GWe)
CF: capacity factor
hth: thermal efficiency (GWe/GWth)
Bd: average burnup of discharged spent fuel (GWthd/tHM)
The above expression can be used to calculate the mass of spent fuel discharged from any given type of reactor as long as the parameters corresponding to the particular reactor type are used. Pressurized water reactors (PWRs), however, account for most of China’s commercial nuclear units. As a result, the expression above can be simplified by considering the installed electric capacity (Pe) and all other parameters to be consistent with those of PWRs. Only PWRs are taken into consideration in this study. hth is given as 0.33 for PWRs.
Pe is obtained by deduction of the capacity of China’s few HTR, FR and CANDU reactors from the anticipated nuclear total capacities by year depicted in Figure 3 and Table 5. The resulting Pe for PWRs in specific years is shown in Table 6.
Table 6: Modified Pe based on PWR capacity growth rates
|
Year |
low case (GWe) |
high case (GWe) |
|
|
2011 |
10.07 |
10.1 |
|
|
2020 |
47.4 |
56.6 |
|
|
2025 |
62.1 |
84.6 |
|
|
2030 |
76.7 |
112.6 |
|
|
2035 |
93.4 |
142.6 |
|
The rate of nuclear fuel burnup will vary with the fuel design and management schemes used. Burnup is typically specified as 33 GWd/tHM for calculation of spent fuel generated before 2004. The newly-built and planned PWRs (those placed in operation in and after 2004) might achieve a higher burnup of about 50 GWd/tHM approximately. The mass of accumulated spent fuel is calculated as the sum of the mass in two stages.
Tables 7 and 8 show historical statistics regarding capacity factors at China’s main commercial reactors. To simplify the calculations, 0.85 is used to represent the average future capacity factor for all reactors in this study.
Table 7: Capacity factors of China’s main commercial reactors [11]
|
|
2000 |
2001 |
2002 |
2003 |
|
Daya Bay 1 |
86.7% |
88.0% |
89.7% |
89.6% |
|
Daya Bay 2 |
88.0% |
90.9% |
82.0% |
84.5% |
|
Ling’ao Phase I-1 |
-- |
-- |
92.0% |
76.8% |
|
Ling’ao Phase I-2 |
-- |
-- |
85% |
|
|
Qinshan Phase I |
76.8% |
93.9% |
67.8% |
-- |
|
Qinshan Phase II-1 |
-- |
-- |
74.9% |
81.2% |
Table 8: Capacity factors of Daya Bay NPP (1&2) [12]
|
2004 |
2005 |
2006 |
2007 |
2008 |
2009 |
2010 |
2011 |
2012 |
|
87.8% |
100% |
80.3% |
91.2% |
99.8% |
91.2% |
89.1% |
100% |
99.9% |
2.1.2 Results of calculations
The estimated annual and accumulated spent fuel discharged from PWRs during specific years are presented in Tables 9 and 10.
Table 9: Anticipated annual discharge of spent fuel
|
year |
high case (tHM) |
low case (tHM) |
|
2012 |
238 |
238 |
|
2020 |
1064 |
891 |
|
2025 |
1591 |
1167 |
|
2030 |
2117 |
1443 |
|
2035 |
2681 |
1756 |
Table 10: Accumulated spent fuel discharge from PWRs
|
year |
high case /tHM |
low case /tHM |
|
2012 |
1767 |
1767 |
|
2020 |
8281 |
7732 |
|
2025 |
15257 |
13091 |
|
2030 |
24865 |
19829 |
|
2035 |
37144 |
27983 |
2.2 Experience with at-reactor storage of spent fuel in China
2.2.1 Spent fuel At-Reactor (AR) storage
Wet (pool type) storage is used at all PWR nuclear power plants in China. The first-built nuclear power plants, Daya Bay Phase I and Qinshan Phase I, which were connected to grid in 1994, began to encounter a shortage of spent fuel storage capacity. To solve the problem, high dense-pack storage and pool expansion were implemented. Some spent fuels in Daya Bay were delivered to a central storage pool in Gansu Province. The newly-constructed nuclear power plants and planned plants are designed with spent fuel pool storage capacity of over 20 years. Table 11 shows the current status of spent fuel AR storage at PWR nuclear plants [13].
Table 11: Current status of spent fuel AR storage in PWR nuclear plants
|
NPP name |
Storage method |
AR storage capacity /yr |
Estimated year of filled up |
|
Daya Bay 1&2 |
Wet storage |
10 |
2003 and 2004 |
|
Qinshan Phase I |
Dense-pack wet |
35 |
2025 |
|
Qinshan Phase II 1 & 2 |
Dense-pack wet |
20 |
2022 and 2024 |
|
Ling’ao Phase I |
Dense-pack wet |
20 |
2022 |
|
Qinshan Phase III 1 & 2 |
wet and dry storage |
40 |
2042 and 2043 |
|
Tianwan Phase I |
Dense-pack wet |
20 |
2026 and 2027 |
2.2.2 Spent fuel Away From Reactor (AFR) storage
In order to develop reprocessing technologies, a pilot-scale test reprocessing plant was built, with the project starting in the 1980s and plant completion in 2004 [14]. An interim spent fuel storage facility with total capacity of 550 tHM was also built as a supporting facility for the reprocessing plant. As of 2012, this site is the only central spent fuel storage facility in China. The rated capacity includes 500 tHM for spent fuel from commercial reactors and 50 tHM for spent fuel from research reactors. Reportedly, the capacity is to be enlarged by an additional 550 tHM. A 3000 tHM wet pool is an element of a planned future large-scale commercial reprocessing plant; this pool is also considered as an away-from-reactor storage facility [15].
2.3 Experience with spent fuel transportation
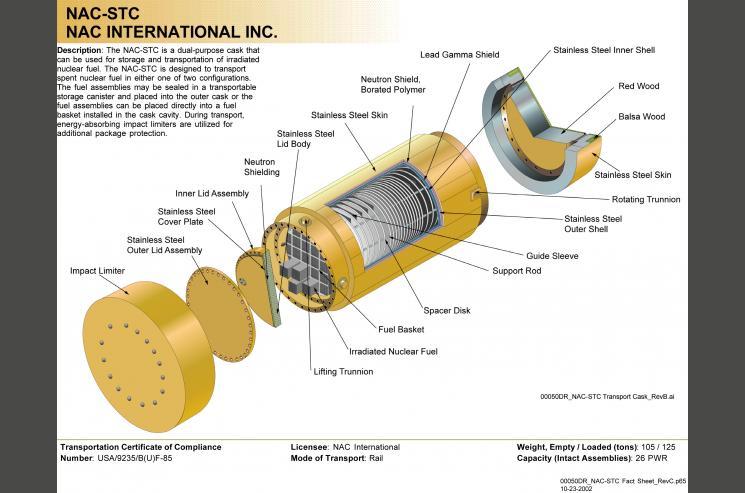
Spent fuel transportation plays a very important role in the nuclear fuel cycle. In 1995, China founded a company—the Everclean Environmental Engineering Corporation (CNNC EEEC) —to undertake providing spent fuel transportation services. To fulfill the demand for spent fuel transport from the Daya Bay NPP, in 2000 EEEC purchased from the American company NAC International two NAC-STC casks, which weigh up to 86t and can hold 26 (17×17) PWR spent fuel assemblies each. Figure 4 shows the structure of NAC-STC cask.
Figure 4: NAC-STC cask for spent fuel transport [16]

Table 12 indicates the main specifications of NAC-STC cask used to transport spent fuel.
Table 12: Main specifications of NAC-STC cask used in China [17]
|
Max. load per cask |
26 assembly |
|
Assembly type |
17*17 |
|
Initial max. U content |
464Kg /assembly |
|
Max. burnup |
38000 MWD/MTU |
|
Max. heart emission |
22.1KW/cask |
|
Initial enrichment of U-235 |
1.8 to 3.2 wt% |
In 2003 the first transport of spent fuel from Daya Bay Nuclear power plant to Lanzhou nuclear complex in Lanzhou took place—a journey in which the convoy travelled 3,720 km through six provinces and one autonomous region. The transport route approved by NNSA (see footnote 15) is as follows:
Shenzhen, Guangzhou, Changsha, Wuhan, Xinyang, Luohe, Zhengzhou Luoyang, Qindong, Xi’an, Xianyang, Lanzhou, Wuwei, Lanzhou nuclear complex.
Since 2003 EEEC has safely transported 390 assemblies (equal to 15 casks) of spent fuel from the Daya Bay NPP [18]. In the period of 2006-2010, 56 total cask transport events took place (that is, a total of 56 separate casks transfers between locations, or 56 “cask×time”), with total spent fuel movements of more than 210,000 cask × km [19].
2.4 Experience with and plans for civil spent fuel reprocessing
China began construction of a reprocessing pilot plant at the Lanzhou nuclear complex in July 1997. This project was approved in July 1986. This plant had an initial production capacity of 50 tHM/a, which was designed to be expanded to 80-100 tHM/a. The primary purpose of this pilot reprocessing plant was for R&D of future reprocessing technologies for production of LWR-MOX and FBR fuel, and for reprocessing of spent fuels from research reactors [20]. In December 2010, the pilot plant finished hot tests with genuine spent fuel from a commercial reactor.
An additional, larger commercial reprocessing plant (800 to 1000 tHM/a) is planned to be commissioned around 2020. While preliminary work has already been under discussion, some significant problems have not yet been solved. In November 2007, an agreement was signed with the French firm AREVA to set up a 800tHM/a reprocessing plant. As of 2012, however, China is still negotiating with AREVA and the French government on the plant’s purchase. As it would likely take about 15 or more years to build such a large reprocessing plant, commissioning of the completed larger reprocessing plant would probably take place around 2025 at the earliest [13] [18].
2.5 Case study: nuclear park in Daya Bay
Because China has a vast domain and ambitious nuclear plans, it is difficult to analyze the site features relevant to potential radiological risk at China’s nuclear power plant one by one. Analysis or discussion on the security issue of China’s nuclear power plant needs to been simplified to some extent. In this study, the nuclear park in Daya Bay is selected as an example of China’s nuclear power plants. The main reasons for this selection are as follows:
- Daya Bay Phase I was in commercial operation in 1994. As one of the earliest nuclear power plants in China, Daya Bay has more experience of operation and management than other newly built reactors, which will benefit this study.
- Because Daya Bay is located near Hong Kong, it attracts more public attention than other nuclear plants in China. More information and details are available on Daya Bay than on any other nuclear plant in China. For example, that amount of information available to inform the investigation of radiological risk issues for the Qinshan nuclear power plants is quite limited.
- In this study, the Daya Bay NPP is not treated as an isolated nuclear plant. Daya Bay unit 1 & 2, along with Ling’ao Phase I & II which is only 1.2 km away, are regarded as an integrated nuclear park for study purposes. This integration makes the study more realistic.
2.5.1 Location
The Daya Bay nuclear power plants are located at 22.7 N and 114.36 E, in the coastal area of Daya Bay, 7 km to the east of Dapeng Cove, near the city of Shenzhen in Guangdong province. The distance to the center of Shenzhen from Day Bay is about 45 km, and the plant is about 50km from the Jiansha Zui area of Hong Kong. The relative position of major cities around Daya Bay is show in Figure 5 [21].

Figure 5: Relative position of major cities around the Daya Bay NPP
In the region within an 80 km radius around the Daya Bay NPP, the total population was 10.6 million as of 2001. At a rough estimate, the population had grown to around 11.0 million by 2011. The average concentration of population in this area is 547 persons/km2. Figure 6 shows the location of surrounding inhabited areas within 5km from the Daya Bay site.

Figure 6: the location of surrounding inhabited areas around Day Bay within a 5 km radius [22]
2.5.2 Reactors in Daya Bay
In the Daya Bay nuclear park, five reactors are in operation with a total capacity of about 5.8 GWe. The details of these reactors are shown in Table 13. In addition to these existing plants, Lingao 5 & 6 are planned to be built about 1/2 km east of Lingao 3 & 4.
Table 13: details of operational reactors in Daya Bay nuclear park [23]
|
Daya Bay |
Lingao Units 1 and 2 |
Lingao Unit 3 and 4 |
|
|
Unit Capacity |
2×984MWe (PWR) |
2×990MWe (PWR) |
2X1080MWe (PWR) |
|
Design Life |
40 years |
40 years |
40 years |
|
Construction Duration |
81 Months |
67.5 Months |
58 Months |
|
Project Costs |
4.072 billion USD |
3.7 billion USD |
< 3.5 Billion USD |
|
Nuclear Island equipment supply |
FRAMATOME |
FRAMATOME |
Dongfang |
|
Conventional Island equipment supply |
GEC-ALSTHOM |
ALSTOM |
Dongfang |
|
Lingao 1 and 2 were based on the Daya Bay design, but with upgrades and increased self-reliance in equipment provision. 11% of the Nuclear Island, 23% of the Conventional Island and 50% of the balance of plant equipment were made in China. Lingao 3 & 4 use an upgraded design and have been built with 50% & 70% self-reliance (equipment from Chinese companies) respectively. Lingao 3 & 4 have digital controls and protection installed on their reactors, as well as DCS (Data communication system) on the Conventional Island, and their turbines /generator sets have been changed to the half-speed (1500rpm) standard. |
|||
2.5.3 Weather data
In a recent study, You-Shao Wang describes the Daya Bay region as follows:
“Located in a subtropical region, Daya Bay’s annual mean air temperature is 22°C. The coldest months are January and February, with a monthly mean air temperature of 15°C, and the hottest months are July and August, with a monthly mean air temperature of 28°C. The minimum sea surface temperature occurs in winter (15°C) and the maxima in summer and fall (30°C). No major rivers discharge into Daya Bay, and most of its water originates from the South China Sea. There are three small rivers (Nanchong River, Longqi River and Pengcheng River) that discharge into Dapeng Cove. The Pearl River is to west of Daya Bay which has a diverse subtropical habitats including coral reefs, mangroves, rocky and sandy shores, mudflats, etc. The coral reefs and mangroves have special resource values and ecological benefits and are very important to the sustainable social and economical development in these subtropical coastal areas. Coral reefs and mangrove areas have important relationships to the regulation and optimization of the subtropical marine environments and have become the subject of much international attention in recent years” [24].
The typical wind directions and speeds at Daya Bay are as shown in Figure 7 and 8 respectively [25].
Figure 7 Wind direction by season and on an annual average basis at measurement heights of 10 and 80 meters at the Daya Bay NPP

Figure 8: Wind speed in Jan., Apr., Jul. and Oct. in Daya Bay NPP

3 Scenario analysis of spent fuel management
3.1 Assumptions and calculation
In this study, scenarios of spent fuel management spanning the time period 2011 to 2035 in China are discussed. Based on China’s current reprocessing status and plans, three scenarios are proposed.
- As a reference, scenario A is based on the assumption that no large-scale commercial reprocessing plant in operation. The reprocessing capacity in China will stay at a constant level of 40 tHM/a from 2012 though 2035.
- Scenario B is a less-reprocessing scenario with the assumption that (1) the existing pilot reprocessing plant with its capacity of 40 tHM/a will operate from 2012 to 2025; (2) the extension of the existing pilot reprocessing plant will be completed in 2026 and from then on the pilot reprocessing plant will operate with a total capacity of 80 tHM/a; (3) the planned large-scale commercial reprocessing plant will be put into operation in 2030 with a capacity of 800 tHM/a. The growth of annual reprocessing capacity in Scenario B is shown in Figure 9.
Figure 9: Growth of annual reprocessing capacity in Scenario B

- Scenario C is a more-reprocessing scenario, incorporating the assumptions that (1) the pilot reprocessing plant with an effective average capacity of 50 tHM/a will operate from 2012 to 2020; (2) the expanded pilot reprocessing plant will be finished in 2021 and from then on will operate at a total capacity of 80 tHM/a; (3) the large-scale commercial reprocessing plant will put into operation in 2026 with the capacity of 800 tHM/a. The growth of annual reprocessing capacity in scenario C is shown in Figure 10.
Figure 10: Growth of annual reprocessing capacity in Scenario C

The composition of spent nuclear fuel is calculated with ORIGEN 2 code. All spent fuels is assumed to be stored for ten years before reprocessing. The decay of nuclides in reprocessing flows (products or wastes) will be neglected. The calculated results of the composition of typical PWR spent fuel at two different levels of burnup are shown in Table 14.
Table 14: Mass composition of element in typical PWR spent fuel
|
uranium |
U-235 |
Pu |
MA |
FPs* |
|
|
33 GWd/tU |
9.56E5 |
7.97E3 |
8.68E3 |
1.03E3 |
2.82E4 |
|
50 GWd/tU |
9.34E5 |
6.68E3 |
1.23E4 |
1.88E3 |
4.26E4 |
*: Refers to non-volatile fission products
3.2 Results and discussion
3.2.1 Spent fuel generation and its impact
The accumulated mass of spent fuel, as implied by the combination of the reprocessing scenarios above and the two different scenarios of nuclear capacity growth presented in section 1.5 of this paper, is shown in Table 15.
Table 15: Accumulated mass of spent fuel under different nuclear spent-fuel management and capacity expansion scenarios

Based on the assumptions presented above, the accumulated mass of spent fuel in China by 2035 will be at most about 31744 tHM. Compared with the loading capacity of the unfinished, and now cancled, Yucca Mountain spent fuel repository in the United States (with capacity equivalent to 70000 tHM of spent fuel), the amount of nuclear spent fuel that might be produced by China through 2035 is relatively small. This implies that there will be no urgent demand for a permanent repository site to dispose of spent fuel in China over the next 20 years.
The calculated results for 2025 in the different scenarios are very similar, because in all of the scenarios it is assumed that no commercial large-scale reprocessing plant is commissioned by that time. The pilot test plant reprocessing plants, with its capacity of 40 or 80 tHM/a, has little impact in terms of reduction of the stockpile of spent fuel. The large differences among the results in 2035 underline the importance and high efficiency of the large-scale of reprocessing plant in reducing spent fuel inventories.
The current spent fuel transport ability in China is a maximum of 135 tHM per year, based on the transportation experience during 2006 to 2010. Before 2025, the pilot reprocessing plant is the only facility that can possibly operate. Due to its small annual capacity (40 or 80 tHM/a), the current transport capacity is able to provide enough spent fuel for reprocessing at the pilot facility. The at reactor wet storage pools in Qinshan Phase I & II and Ling’ao nuclear power plants, however, will be almost full by 2022 to 2025. Some of the spent fuel in the Qinshan wet storage pool may be delivered to a central wet storage facility. Moreover, the Fukushima accident has increased the concerns about highly dense pack storage of spent fuel in spent fuel pools in nuclear power plants. As a result, the governmental administration sections responsible for nuclear reactor safety oversight in China may implement new regulations that will require spent fuel to be transported off of reactor sites more frequently and earlier. All of the above factors will boost the development of spent fuel transportation in China.
3.2.2 Separated Pu accumulation and its impact
The only factor that determines the size of the initial stockpiles of separated plutonium is the reprocessing capacity. Table 16 shows the estimated amount of Pu resulting from the reprocessing activities included in scenarios B and C.
Table 16: Estimated amount of Pu separated by scenario
|
2012 |
2020 |
2025 |
2035 |
|
|
Scenario B: less-reprocessing |
0.35 tPu |
3.12 tPu |
5.21 tPu |
176.2 tPu |
|
Scenario C: more-reprocessing |
0.43 tPu |
3.91 tPu |
7.38 tPu |
602.7 tPu |
At present, discussions on the utilization of separated Pu are ongoing in China. For example, some experts prefer to recycle separated Pu in thermal reactors to save natural uranium, while others advocate interim storage and breeding of Pu in fast reactors. But no one can deny the fact that R&D work on plutonium utilization in China has just started and is in its preliminary stage. It is too early to analyze the impact of Pu on China’s nuclear fuel cycle. In this study, as a consequence, only the influence on the China’s first envisaged fast reactor is considered regarding the loading and annual consumption of Pu as a reactor fuel.
It is assumed that 4t of Pu is required for the first loading of fuel in fast reactors per GWe. The annual consumption of Pu is 2.8 t in each fuel reloading. Compared with the amount of separated Pu calculated in Table 16, the operation of first fast reactor will be no earlier than 2020 due to a lack of accumulated Pu.
3.2.3 Conditioned waste and its impact on repository
Based on the results above (see Table 15) that the total mass of discharged spent fuel in 2035 will be no more than 31744 tHM, the construction of a repository site in China is not an urgent priority.
The stockpile of spent fuel can be reduced to 27494 tHM with the help of reprocessing. As a byproduct, high level liquid waste is produced from reprocessing plants. Generally, high level liquid waste will be vitrified in glass and sent to a disposal site. One of the benefits of reprocessing is the reduction of the final waste volume that must be placed in geological disposal facilities. Based on a study byAREVA, the final volume is about 0.5 m3 per ton of spent fuel after reprocessing, accounting for 1/4 of initial volume of spent fuel. However, due to the high density of Cs-137 and Sr-90 in the vitrified waste, it generates much more heat than un-reprocessed spent fuel, resulting in a requirement for more space for heat exchange in repositories, which in turn may reduce the benefit of volume reduction through reprocessing, especially in the near term.
4 Conclusion
Due to its large population and rapid economic growth, electricity demand in China continues to grow at a high rate. Compared with the total electricity production in 2011, annual electricity generation is estimated to double by 2020. The growth of electricity supplies from fossil fuels is insufficient to meet the expected growth in electricity consumption. Nuclear power thus becomes an inevitable choice in China’s energy structure, and is very likely to play an increasingly important role.
After the shock of the Fukushima nuclear accident, the development of China’s nuclear sector has slowed somewhat. Based on the statistic of nuclear projects (under construction, proved or planned), the most likely projection of nuclear installed capacity is estimated to be 50-60 GWe in 2020.
Experience with spent fuel management is limited in China. No authorized roadmap or clear decision on the back end of nuclear fuel cycle has yet been developed and approved. Thanks to the present relatively small quantity of spent fuel in storage at China’s nuclear plants, it appears that there will be no critical pressure on the development of spent fuel transportation, interim storage, large-scale reprocessing and final disposal infrastructure for a number of years. The difficulty and uncertainty of development of nuclear power and nuclear fuel cycle facilities, however, have been well-proved worldwide in the past. China’s strategy of spent fuel management policy should be determined soon, and should be based on a comprehensive and scientific planning process that allows consideration of all reasonable options, issues, and points of view.
[2] State Power Information Center, (http://www.sp.com.cn/).
[3] Fredrich Kahrl, David Roland-Holst. China’s Carbon Challenge: Insights from the Electric Power Sector, 2006. http://areweb.berkeley.edu/~dwrh/CERES_Web/Docs/CCC_110106.pdf
[4] http://www.greenworldinvestor.com/2011/03/29/list -of-worlds-largest-hydroelectricity-plants-and-countries- china – leading-in-building-hydroelectric-stations/
[8] http://en.wikipedia.org/wiki/Nuclear_power_in_the_People’s_Republic_of_China#Major_nuclear_power_plants _under_construction
[10] Due to some minor mistakes in Figure 2, readers are advised to cite this figure with caution without first contacting the author regarding possible amendments and corrections.
[11] LIU X. G. et al. Preliminary study on China’s nuclear fuel cycle scenarios before 2020, Chinese J. Nul. Sci. & Tech. 2005
[13] Yun ZHOU. China’s Spent Nuclear Fuel Management: Current Practice and Future Strategy. March, 2011, available as http://www.cissm.umd.edu/papers/files/china_spent_fuel_management_and_reprocessing_draftfeb_2011.pdf.
[14] Zhang T X, Wang J, Wu T, et al. “The active commissioning process for a power reactor spent fuel reprocessing pilot plant in China”. Chinese Sci Bull, 2011, 56, doi: 10.1007/s11434-011-4600-2.
[15] Yun ZHAO, China’s Spent Nuclear Fuel Management: Current Practice and Future Strategy, 2011 (ibid).
[22] Wenchao JI, “Calculation of the Concentration of Radioactive Airborne Effluents Under Normal Operation from Daya Bay Nuclear Power Plant”, Radiation Protection;2007-06. In Chinese.
[23] Unknown, CPR1000 Design, Safety Performance and Operability, 2011
[24] You-Shao WANG. “Effect of the Operating Nuclear Power Plant on Marine Ecology And Environment – A Case Study of Daya Bay in China”, Available as http://cdn.intechweb.org/pdfs/19677.pdf.
[25] Rong WANG., Analysis on the surface layer meteorological characteristics from the observed data of 80 meter tower in Guangdong Daya Bay. Master Degree Dissertation, Zhongshan University, China. In Chinese.
IV. Nautilus invites your responses
The Nautilus Peace and Security Network invites your responses to this report. Please leave a comment below or send your response to: napsnet@nautilus.org. Comments will only be posted if they include the author’s name and affiliation
China copied the german Castor container for HLW
China is going to copy the DBHD repository plan too