David F. von Hippel and Peter Hayes
1 April 2013
Nautilus Institute
This paper was prepared with support from the Hanyang University Energy, Governance and Security (EGS) Center as EGS Working Paper Number 2014-04, available as http://www.egskorea.org/common/download.asp?downfile=2014-04_Working_Paper.pdf&path=board
Abstract
The term “energy security” has typically meant little more than securing access to sufficient quantities of fossil fuels at reasonable prices. A broader concept of energy security is needed to adequately consider the full costs and benefits of potential energy policies designed to cope with not only fuel sufficiency and price, but also complex challenges ranging from climate change, to local energy-related pollution, to the social, political, and radiological fallout of the Fukushima nuclear power plant accident in 2011, to cite just a few examples. This paper updates the authors’ concept of a comprehensive energy security assessment framework that includes not only energy supply and economic considerations, but also technological, environmental, social/political/cultural, and international/military security dimensions of energy security. We apply this concept to an assessment of selected energy sector redevelopment “paths”—essentially, quantitative descriptions of energy futures—for North Korea, comparing the relative quantitative and qualitative costs and benefits from each of these energy security dimensions from both the perspective of the DPRK and from the perspective of the broader Northeast Asia (and interested parties) region. We conclude with an exploration of the energy policies that our energy security assessment identifies as “robust”, that is, useful across the full range of energy security dimensions.
1 Introduction
However one defines the term “energy security”, it is clear that the Democratic People’s Republic of Korea (DPRK) suffers from the lack of it. In a series of dizzying policy cycles dating back to at least 1990, when the dissolution of the Soviet Union left the DPRK suddenly without its major patron and trading partner, North Korea’s search for improvements in its energy security (among other policy goals) has manifested itself in a variety of postures and actions toward its neighbors and the international community in general that have at times vexed, and at times encouraged, the consortium of nations seeking engagement with the DPRK. The DPRK’s most recent actions in the ongoing international dispute regarding its nuclear weapons program—the launching of a rocket similar to a long-range missile in December, 2012[1], the test detonation of a nuclear device in February, 2013[2], and the DPRK’s March, 2013 announcements that it is pulling out of the armistice agreement with the Republic of Korea and threatening US military bases with artillery[3] being recent seminal examples—have kept North Korean issues in the public eye. Lacking sufficient supplies of petroleum products and electricity to redevelop its economy, or even to provide basic humanitarian services for all of its population, North Korea’s leadership uses threat and provocation as a means of both securing domestic political support from key groups and to try and obtain concessions from the international community. As such, although addressing the DPRK’s energy security problems is not sufficient for solving the North Korean nuclear weapons impasse, it is a necessary element of reaching agreement on the issue. Energy security has typically, to those involved in making energy policy, meant mostly securing access to oil and other fossil fuels. Increasingly global, diverse energy markets, new fuels and power sources, new energy exporters and importers, and increasingly transnational problems resulting from energy transformation and use, however, have rendered old energy security rationales less salient, and other issues, including climate change and other environmental, economic, and international policy and security considerations, are becoming increasingly important. This ongoing evolution in the implicit and explicit meaning of energy security was accelerated by the Fukushima accident in March of 2011, when the Sendai earthquake triggered a tsunami that, in addition to causing tragic loss of life along the northeast coast of Honshu, triggered a series of event that ultimately lead to the effective destruction of the Fukushima Dai-ichi nuclear power plant units number 1 through 4, with accompanying massive radiation releases. Consideration of the Fukushima accident has caused policymakers in Northeast Asia and beyond to reflect on the meaning of energy security, and on the effectiveness of policies, such as promotion of nuclear power, heretofore intended to make nations more energy secure[4]. In this paper we explore some of the measures and policies that the DPRK, together with the members of the international community that would seek to engage the DPRK on nuclear weapons and related issues, might seek to redevelop the North Korean economy, and, further, how those redevelopment approaches might compare when judged against a comprehensive suite of energy efficiency criteria. By way of background, sections 2 and 3 of this paper provide, respectively, a review and update of the comprehensive energy security framework that we and our co-authors have described in previous publications, and a description of the history of North Korean “energy insecurity”. Section 4 of this paper presents several paths for the future evolution of the DPRK economy and energy sector, including quantitative results for energy flows, pollutant emissions, and costs. Section 5 provides our analysis of how the candidate DPRK future paths compare against a range of comprehensive energy security criteria, viewed from the perspective of both North Korea’s leadership and from the perspective of the DPRK’s neighbors and the international community. Section 6 provides our conclusions as to what types of policies might be pursued by North Korea and the international community that would be likely to move the DPRK and the Northeast Asia region towards a more energy secure future, seeking approaches that would be “robust” in terms both of offering positive outcomes under a range of conditions, and also providing perceived benefits to different policy actors.
2 Energy Security, Broadly Construed
For policymakers in East Asia and globally, the term energy security has been interpreted mostly to mean assuring access to fuel oil, coal, and natural gas. This concept is, occasionally broadened to consider the benefits of other types of domestic energy supplies such as renewable energy and—though its status as a “domestic” resource may often be arguable—nuclear power[5]. This supply-based focus has as its cornerstones reducing vulnerability to foreign threats or pressure on oil supplies, preventing a supply crisis from occurring[6], and minimizing the economic and military impact of a supply crisis once it has occurred. Current national and international energy policies, however, have been facing many new challenges, and have at their disposal new tools that need to be considered as key components of new energy security concepts. The conventional energy security concept has therefore become less salient to policy formation due to increasingly global, diverse energy markets combined with emerging, energy-related local, regional, national, and transnational issues, including climate change, local air pollution, acid rain, and water quantity and quality issues. With the March Fukushima 2011 accident as a riveting cautionary example, policymakers around Northeast Asia and beyond are realizing that there are multiple facets to energy security that must be considered. In order to be of use today, a policy-oriented rationale for energy security must encompass not only energy supply and cost but also environmental, economic, technological, social, and national and international security considerations. As a consequence, a more comprehensive operating definition of energy security is needed, along with a practical framework for analysis of which future energy plans, paths, or scenarios (less deterministic sketches of possible energy futures) are likely to yield greater energy security in that broader sense. Work done in the late 1990s as a part of the Nautilus Institute’s “Pacific Asia Regional Energy Security” (PARES) project developed a broader definition of energy security, and described an initial analytical framework designed to help to compare the energy security characteristics—both positive and negative—of different quantitative energy paths as developed using quantitative energy planning software, as well as qualitative analytical tools. This framework has been elaborated and adapted over the years for use in a variety of countries and contexts, many of them in East Asia[7]. The remainder of this section provides the broader energy security definition proposed and used by the authors and a summary presentation of a framework for analysis of the relative energy security costs and benefits of different energy sector decisions that is used later in this paper[8].
2.1 Challenges for Comprehensive Energy Security
In this second decade of the twenty-first century, national energy policies are facing challenges on multiple fronts, and new developments are threatening to turn some of the traditional relationships between energy user and supplier nations in new and interesting directions. The substance of these challenges needs to be incorporated and applied in a comprehensive concept of energy security. Indeed, energy security policies in various countries are now arguably showing trends of “convergence” rather than “divergence”, despite the basic differences in national situations and historical approaches to energy security. This convergence does not eliminate regional and national differences, of course, but it is an encouraging sign with regard to minimizing the potential conflict that may come from differences in energy security approaches, as reflected in the different energy policies that countries adopt. Some of the major challenges facing policymakers, and requiring the application of a broader energy security concept, include the following. Environment Perhaps the most serious challenge to traditional (supply-security-oriented) energy policy thinking is the need to protect the environment. If environmental problems are to be solved, energy policies will have to be reformulated. Local, national, and international environmental issues—ranging from local air and water pollution to global greenhouse gas concentrations— affect development and deployment of energy sector policies. International environmental problems arguably present the greatest impetus for change in energy policies, while at the same time offering some of the most difficult challenges. Two international environmental problems inherently linked with energy consumption, and in particular, fossil fuel consumption, are acid rain—still a problem in East Asia although the advent of scrubbers on many new power plants has helped[9]— and global climate change[10]. Trans-boundary air pollution even has trans-Pacific elements that have only in the last 15 or so years started to be fully appreciated[11]. The climate change issue in particular requires a much longer time perspective than business and governments usually are equipped to address, as well as the need for global coordination of energy and other policies. Other environmental issues, such as radioactive waste management, also require long-term perspectives. Technology Risks associated with development and deployment of advanced technologies challenge current energy policy thinking. Excessive reliance on some technologies can leave countries vulnerable to consequences unforeseen when energy policies were formulated. Conventional thinking understates such risks and tends to see them as short-term, not long-term. Risks include nuclear accidents such as those at Three Mile Island in the United States, Chernobyl in the former Soviet Union, and Fukushima, natural disasters with impacts on energy infrastructure (such as Hurricane Katrina’s impacts on oil and gas production, or the impact of the July, 2007 earthquake near Niigata, Japan on the seven-unit Kashiwazaki-Kariwa nuclear plant), or the failure of R&D efforts—such as the synthetic fuel, fast breeder reactor, and solar thermal programs in the U.S. during the 1970s and 1980s—to perform as expected. Technological risks can be transnational, as evidenced by the accident at Chernobyl, where the release of radioactivity affected several nations in Europe. Also, markets for advanced technologies are becoming global—witness the planned export of nuclear reactors to a number of countries in Asia[12]. As the world moves rapidly moving toward a “technology intensive” energy society, a new energy security concept must address the various domestic and international risks associated with advanced technologies. Managing Energy Demand as an Energy Policy Option Conventional energy policy seeks to assure supply while assuming that demand is given. This notion has been changing since the mid-1980s, when the concept of demand side management (DSM) was first incorporated into energy planning. Now, management of energy demand is almost on an equal footing with management of supply in many nations, and is recognized as a key tool in the achievement of climate change mitigation and other environmental goals. Still, most national energy policies tend to see the need for energy services—the services provided by energy use (a liter of water heated, or an hour of light by which to read, for example—as the same as the need for fuel supplies, though the same energy service can often be provided in a number of different ways and with widely varying amounts of different energy resources. Management of energy demand as a means to make energy services more widely available has its own attendant risks and uncertainties, and a broader concept of energy security must be equipped to include those factors as well as the non-traditional nature of planning to increase available energy services by reducing energy demand. Social-Cultural Factors Not in my backyard (NIMBY) and environmental justice concerns are becoming global phenomena, making it increasingly difficult, time-consuming, and costly to site “nuisance facilities” such as large power plants, waste treatment and disposal facilities. Opposition to plant siting has elevated the importance of local politics in energy policy planning, including the concept of discussions of compensation for communities hosting (or potentially hosting) energy-related facilities that pose local environmental or health risks. At the local, national, and international scales, public confidence is another social factor influencing energy policy. Once lost, public confidence is hard to recover, as witnessed by the considerable, if only, at this stage, early efforts by the Japanese governments to make the nuclear policymaking process more transparent (for instance by holding roundtable discussions), though a Commission tasked with reviewing the Fukushima accident found continuing problems with transparency in decisionmaking by the nuclear utilities and nuclear establishment in Japan[13]. Accounting for social-cultural factors and increasing public confidence in energy choices are therefore central components of a broader concept of energy security. International Relations-Military New dimensions in international relations and new military risks are challenging traditional energy policy-making. The end of the Cold War has brought in its wake a new level of uncertainty in international politics. Although the risk of a world war has been drastically reduced, the threat of regional conflicts has increased, as demonstrated by, just to name just a recent few, ongoing, heated rhetoric in long-simmering territorial disputes in East Asia, including between China and Japan[14], and, of course, the above-mentioned recent actions and threats by North Korea, coupled with the related actions/reactions by its neighbors and the international community. The brave new world of post-Cold War international relations must be accounted for in a new, comprehensive concept of energy security.
2.2 Comprehensive Concept of Energy Security
The above five key components—environment, technology, management of energy demand, social and cultural factors, and post-Cold War international relations—are central additions to the traditional supply-side point of view in a Comprehensive Energy Security Concept, which we continue to define as follows: A nation-state is energy secure to the degree that fuel and energy services are available to ensure: a) survival of the nation, b) protection of national welfare, and c) minimization of risks associated with supply and use of fuel and energy services. The six dimensions of energy security include energy supply, economic, technological, environmental, social and cultural, and military/security dimensions. Energy policies must address the domestic and international (regional and global) implications of each of these dimensions. What distinguishes this energy security definition is its emphasis on the imperative to consider extra-territorial implications of the provision of energy and energy services while recognizing the complexity of implementing national energy security policies and measuring national energy security. The definition is also designed to include emerging concepts of environmental security, which include the effects of the state of the environment on human security and military security, and the effects of security institutions on the environment and on prospects for international environmental cooperation[15].
2.3 Testing the Relative Energy Security Benefits of Different Policy Approaches
The energy security definition above, with its six dimensions, forms the basis for our preferred approach to evaluating the relative energy security costs and benefits of different energy policy initiatives, including the suites of energy policies included in the DPRK energy paths presented later in this paper. In summary, the steps that we apply in evaluating the relative energy security attributes of candidate energy paths (or scenarios) are as follows:
- Define objective and subjective measures of energy (and environmental) security to be evaluated.
- Collect data and develop candidate energy paths/scenarios that yield roughly consistent energy services, but illustrate policies different enough to illuminate the policy choices being explored.
- Test the relative performance of paths/scenarios for each energy security measure included in the analysis.
- Incorporate elements of risk.
- Compare path/scenario results.
- Eliminate paths that lead to clearly suboptimal or unacceptable results, and iterate the analysis as necessary to reach clear conclusions.
Table 1 provides a listing of the dimensions of the comprehensive definition of energy security provided above, and of some of the various measures and attributes of a given energy scenario or path that can pertain to each energy security dimension. It should be emphasized that this is at best a short list of potential attributes, and the any given analysis might use a subset of these and/or additional possible yardsticks not listed here. Table 1: Examples of Dimensions and Measures/Attributes of Energy Security
| Dimension of Energy Security | Measures/Attributes | Interpretation |
| Energy Supply | Total Energy Demand and Primary Energy Use | Higher = indicator of other impacts |
| Fraction of Primary Energy as Imports | Lower = preferred | |
| Diversification Index (by fuel type, primary energy) | Lower index value (indicating greater diversity) preferred[16] | |
| Diversification Index (by supplier, key fuel types) | Lower index value preferred (see above) | |
| Stocks as a fraction of imports (key fuels) | Higher = greater resilience to supply interruption | |
| Economic | Total Energy System Internal Costs | Lower = preferred |
| Total Fuel Costs | Lower = preferred | |
| Import Fuel Costs | Lower = preferred | |
| Economic Impact of Fuel Price Increase (as fraction of GNP), or Impact on Employment (fractional and/or by industry) | Lower = preferred | |
| Technological | Diversification Indices for key industries (such as power generation) by technology type | Lower = preferred |
| Diversity of R&D Spending | Qualitative—Higher preferred | |
| Reliance on Proven Technologies | Qualitative—Higher preferred | |
| Technological Adaptability (including, for example, adaptability to a changing climate) | Qualitative—Higher preferred |
Table 1 (continued): Examples of Dimensions and Measures/Attributes of Energy Security
| Dimension of Energy Security | Measures/Attributes | Interpretation |
| Environmental | GHGemissions (tonnes CO2, CH4) | Lower = preferred |
| Acid gas emissions (tonnes SOx, NOx) | Lower = preferred | |
| Local Air Pollutants (tonnes particulates, hydrocarbons, others) | Lower = preferred | |
| Other air and water pollutants (including marine oil pollution) | Lower = preferred | |
| Solid Wastes (tonnes bottom ash, fly ash, scrubber sludge) | Lower = preferred (or at worst neutral, with safe re-use) | |
| Nuclear waste/spent fuel generation (tonnes or Curies, by type) | Lower = preferred, but qualitative component for waste isolation scheme | |
| Ecosystem and Aesthetic Impacts | Largely Qualitative—Lower preferred | |
| Exposure to Environmental Risk | Qualitative—Lower preferred | |
| Social and Cultural | Exposure to Risk of Social or Cultural Conflict over energy systems | Qualitative—Lower preferred |
| International Military/Security | Exposure to Military/Security Risks | Qualitative—Lower preferred |
| Relative level of spending on energy-related security arrangements | Lower = preferred |
3 Energy Security in North Korea: Recent History and Current Status
3.1 Changes Since 1990
Despite its professed “Juche,” or “self-reliance” philosophy, the DPRK has always been dependent on external powers for key infrastructure and fuel supplies in its energy sector. The United Nations Command bombing campaigns during the Korean War destroyed most of North Korea’s urban energy infrastructure and necessitated post-war reconstruction with Russian and Chinese assistance. Before 1990, thermal power plants and major factories in the DPRK were planned and built with significant involvement from the USSR; subsequently, North Korea became heavily reliant on oil imports and spare parts, as well as technical assistance, from Russia to keep these plants and factories functioning. Russian assistance, however, substantially deceased in 1990 with the collapse of the Soviet Union. The DPRK was obliged to respond to a sudden drop in the available energy supply by seeking supplies from other nations and energy rationing. Energy demand decreased in part due to lack of fuel, as well as the loss of Soviet markets for the DPRK goods produced in factories mostly designed by engineers from the USSR. The economic, if not social and political, landscape in the DPRK changed markedly during the 1990s. In the early 1990s, the DPRK government openly admitted the country’s failure to achieve the economic goals of its most recent seven-year plan[17]. Although little data have been available from inside the DPRK, information from outside observers of the country indicates that the North Korean economy was at best stagnating, and most probably in considerable decline, through the mid-1990s[18]. This economic decline has been both a result and a cause of substantial changes in energy demand and supply in DPRK over the last decade. Observers of the DPRK economy have suggested that at least a modest improvement took place in the years around 2000—ROK sources, for example, estimated that the DPRK economy grew approximately 6 percent in 1999, and another 1.3 percent in 2000[19]. A more recent estimate by the Bank of Korea showed the DPRK economy (as measured by GDP) growing at 0.4 percent in 2000, and by amounts varying from 1.2 to 3.8 percent annually from 2001 through 2005, followed by a period of slow decline (-0.5 to -1.2 percent/yr) in all years from 2006 through 2010 except 2008, when growth of 3.1 percent was estimated. In aggregate, these figures, though estimates at best, mean essentially zero overall growth in the DPRK economy from 2006 through 2010[20]. Other observers, however, tended to argue that most of any economic upturn in the DPRK economy in the years 2000 through 2005 appears to have been driven by food and other aid from abroad, inputs that have diminished over the last few years[21]. Among the energy-sector changes on the supply side in the DPRK since 1990 have been:
- A vast drop in imports of fuels (particularly crude oil and refined products, but coal and coke as well) from the Soviet Union and Russia. An index of these imports declined from a value of over 140 in 1987 to 8.7 in 1993, and crude oil imports from Russia in 1993 were on the order of one-tenth what they were in 1990[22], and have fallen to practically zero since, though more modest supplies of refined oil products continue to be imported into the DPRK from Russia, and there have been recent, though not yet verified, reports of some crude oil imports from Russia.
- Although a decline in coal exports to China was recorded between 1988 and 1993, with the value of those exports receding in 1993 to approximately a tenth what they were in 1990[23], recent years have seen the exports of coal and other raw mineral products (largely iron and steel scrap and metals ores) to China increase dramatically, with coal exports to China reaching 2.8 million tonnes in 2005 and 4.6 million tonnes in 2010, followed by a vast increase to 11.2 million tonnes in 2011[24]. This is one manifestation of a recent increase in investment in the DPRK by Chinese businesses, particularly in the raw materials sectors, but also, to some degree, in manufacturing[25].
Oil import restrictions have reduced the availability of refined products in the DPRK. These problems arose partly (if indirectly) from economic sanctions related to the nuclear proliferation issue, and partly from North Korea’s inability to pay for oil imports with hard currency. This lack of fuel, particularly for the transport sector, has probably contributed to the country’s economic malaise since 1990. Another factor contributing to the decline in the country’s economic fortunes has been the inability (again, partly due to lack of foreign exchange, and partly due to Western economic sanctions) to obtain key spare parts for factories, including factories built with foreign assistance and/or technology in the 1970s[26]. Also, as mentioned above, there has been, in the years since 1990, a virtual halt in economic aid, technical assistance and barter trade on concessional or favorable terms from Russia and other Eastern European nations. This reduction, coupled with a sharp decline in similar types of assistance from China (including, in the years between 1995 and 2000, a more than 50 percent reduction in crude oil shipments to the DPRK), had resulted in a total estimated loss of aid to the DPRK economy of more than $ US 1 billion per year[27] by the mid-1990s. The DPRK’s trade deficit as of 2000 stood at $US 856.88 million[28], remained at near one billion dollars through 2004[29], and was over one billion dollars in 2009 and 2010[30], despite increasingly lucrative exports to China. The economic difficulties mentioned above have been exacerbated by an untimely combination of climatic events. The early 1990s saw a series of poor grain harvests in the DPRK. Compounding these difficulties, 1995 and 1996 brought severe flooding to many areas of the DPRK, washing away topsoil from areas at higher elevation, and burying many areas of crucial low-lying farmland in tens of centimeters of silt or sand[31]. An additional blow to DPRK agricultural production was dealt by a tidal wave, caused by a typhoon at sea, that swept over and heavily damaged a long dike on the west coast of the DPRK in September of 1997, inundating hundreds of thousands of hectares of rice fields. The combined effects of flooding and poor harvests—even before the damage from the tidal wave was factored in—were a food shortage severe enough to spur the DPRK government to take the unusual step of publicly requesting food aid from the international community. Additional floods and tidal waves in several areas of the country caused damage to agricultural areas in 2006, and left tens of thousands of residential homeless. This cycle of misery caused by flooding returned to the DPRK in the summers of 2007, 2010, and, most recently, 2011[32]. On the demand side, overall energy use per capita in the DPRK as of 1990 was relatively high, primarily due to inefficient use of fuels and reliance on coal. Coal is more difficult to use with high efficiency than oil products or gas. Based on our estimates, primary commercial energy[33] use in the DPRK in 1990 was approximately 70 GJ per capita, approximately three times the per capita commercial energy use in China in 1990, and somewhat over 50 percent of the 1990 per capita energy consumption in Japan (where 1990 GDP per-capita was some ten to twenty times higher than the DPRK). The industrial sector is the largest consumer of all commercial fuels—particularly coal—in the DPRK. The transport sector consumes a substantial fraction of the oil products used in the country. Most transport energy use is for freight transport; the use of personal transport in the DPRK is very limited. The residential sector is a large user of coal and (in rural areas, though more recently, reportedly, in urban and peri-urban areas as well) biomass fuels. The military sector (by our estimates) consumes an important share of the refined oil products used in the country. The public/commercial and services sectors in the DPRK consume much smaller shares of fuels supplies in the DPRK than they do in industrialized countries, due primarily to the minimal development of the commercial sector in North Korea. Wood and crop wastes are used as fuels in the agricultural sector, and probably in some industrial subsectors as well. Key demand-side energy-sector problems in the DPRK include:
- Inefficient and/or decaying infrastructure: Much of the energy-using infrastructure in the DPRK is reportedly (and visibly, to visitors to the country) antiquated and/or poorly maintained. Buildings apparently lack significant, and often any, insulation, and the heating circuits in residential and other buildings for the most part apparently cannot be controlled by residents. Industrial facilities are likewise either aging or based on outdated technology, and often (particularly in recent years) are operated at less-than-optimal capacities (from an energy-efficiency point of view).
- Suppressed and latent demand for energy services: Lack of fuels in many sectors of the North Korean economy has apparently caused demand for energy services to go unmet. Electricity outages are one obvious source of unmet demand, but there are also reports, for example, that portions of the DPRK fishing fleet have been idled for lack of diesel fuel. Residential heating is reportedly restricted in the winter (and some observers report that some public-sector and residential buildings have not received heat at all in recent years) to conserve fuel, resulting in uncomfortably cool inside temperatures.
The problem posed by suppressed and latent demand for energy services is that when and if supply constraints are removed there is likely to be a surge in energy (probably particularly electricity) use, as residents, industries, and other consumers of fuels increase their use of energy services toward desired levels[34].
- Lack of energy product markets: Compounding the risk of a surge in the use of energy services is the virtual lack of energy product markets in North Korea. Without fuel pricing reforms, there will be few incentives for households and other energy users to adopt energy efficiency measures or otherwise control their fuels consumption. Recent years have seen limited attempts by the North Korean government to reform markets for energy products. Some private markets exist for local products like firewood, and some commercial fuels have in recent years reportedly been traded “unofficially” (on the black market), but for the most part, energy commodity markets in the DPRK essentially do not exist[35]. Energy consumers are also unlikely, without a massive and well-coordinated program of education about energy use and energy efficiency, to have the technical know-how to choose and make good use of energy efficiencytechnologies, even when and if such technologies are made available.
The DPRK’s energy sector needs (and thus its energy security challenges) are vast, and at the same time, as indicated by the only partial listing of problems above, many of these needs are sufficiently interconnected as to be particularly daunting to address. North Korea’s energy sector needs include rebuilding/replacement of many of its power generation and almost all of its substation equipment, repair, replacement, and/or improvement of coal mine production equipment and safety systems, updating of oil refineries, improvement or replacement of most if its energy-using equipment, including coal-fired boilers, electric motors and drives, transport systems, and many other items, modernization of energy use throughout the country, rebuilding of the forest stocks, and a host of other needs. As one example of the interrelations of energy problems in the DPRK, renovating the coal mining sector is made more difficult because coal mines lack electricity due to electricity sector problems, and electricity generators in some cases have insufficient coal to supply power demand because of coal mine problems and problems with transporting coal to power plants. Many observers of North Korea, particularly in areas away from the major cities, report that official rations are far from sufficient to meet dietary requirements, that people are supplementing their rations with not only production of private gardens but wild foods, tree-bark, grass, and whatever other semi-edible materials they can obtain. Apart from the overriding human concerns associated with the food shortage, the slow starvation of the populace cannot help but decrease economic production still further, as poorly-fed people are less capable of work[36]. The flooding of 1995 and 1996 damaged an unknown number of irrigation dams and canals. Additional flooding in 1999 damaged both agricultural and industrial areas, as did flooding in more recent years. Cumulative damage to and “wearing out” of agricultural and other infrastructure, coupled with damage to farmlands (both related to climatic events and long-term degradation), means that it may be years before the DPRK is able to grow enough food to feed its populace again, even if the required agricultural inputs (fertilizer, machinery, and fuel for the machinery) do become more available.
3.2 Estimates of Current Energy Demand and Supply in the DPRK
Figure 1 compares estimated final energy demand by sector for the years 1990, 1996, 2000, 2005, and 2008-2010, and Figure 2 provides the same comparison of energy demand by the type of fuel[37]. In addition to the marked decrease in overall energy consumption, there are two notable features of these comparisons. First, compared to 1990, the residential sector in 2010 uses a larger share of the overall energy budget while the share of the industrial sector shrinks to a third of the total. This change is the combined result of continued reduction in fuel demand in the industrial sector, relatively constant use of wood and other biomass fuels in the residential sector, and reductions in the use of other residential fuels (notably coal and electricity) that are not as severe as the reductions experienced in the industrial sector. Second, for similar reasons, the importance of wood/biomass fuels to the energy budget as a whole is estimated to have increased dramatically over the course of the 1990s, persisting into the current decade, while the importance of commercial fuels has decreased. Increased use of wood and other stresses have resulted in significant deforestation and degradation of forest lands in the DPRK. 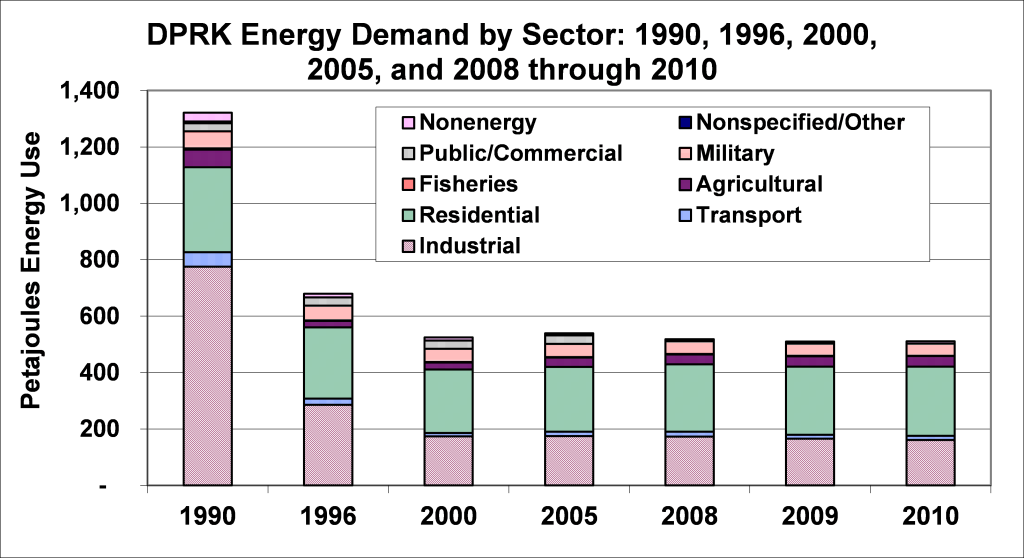 Figure 1: DPRK Energy Demand by Sector: 1990 through 2010
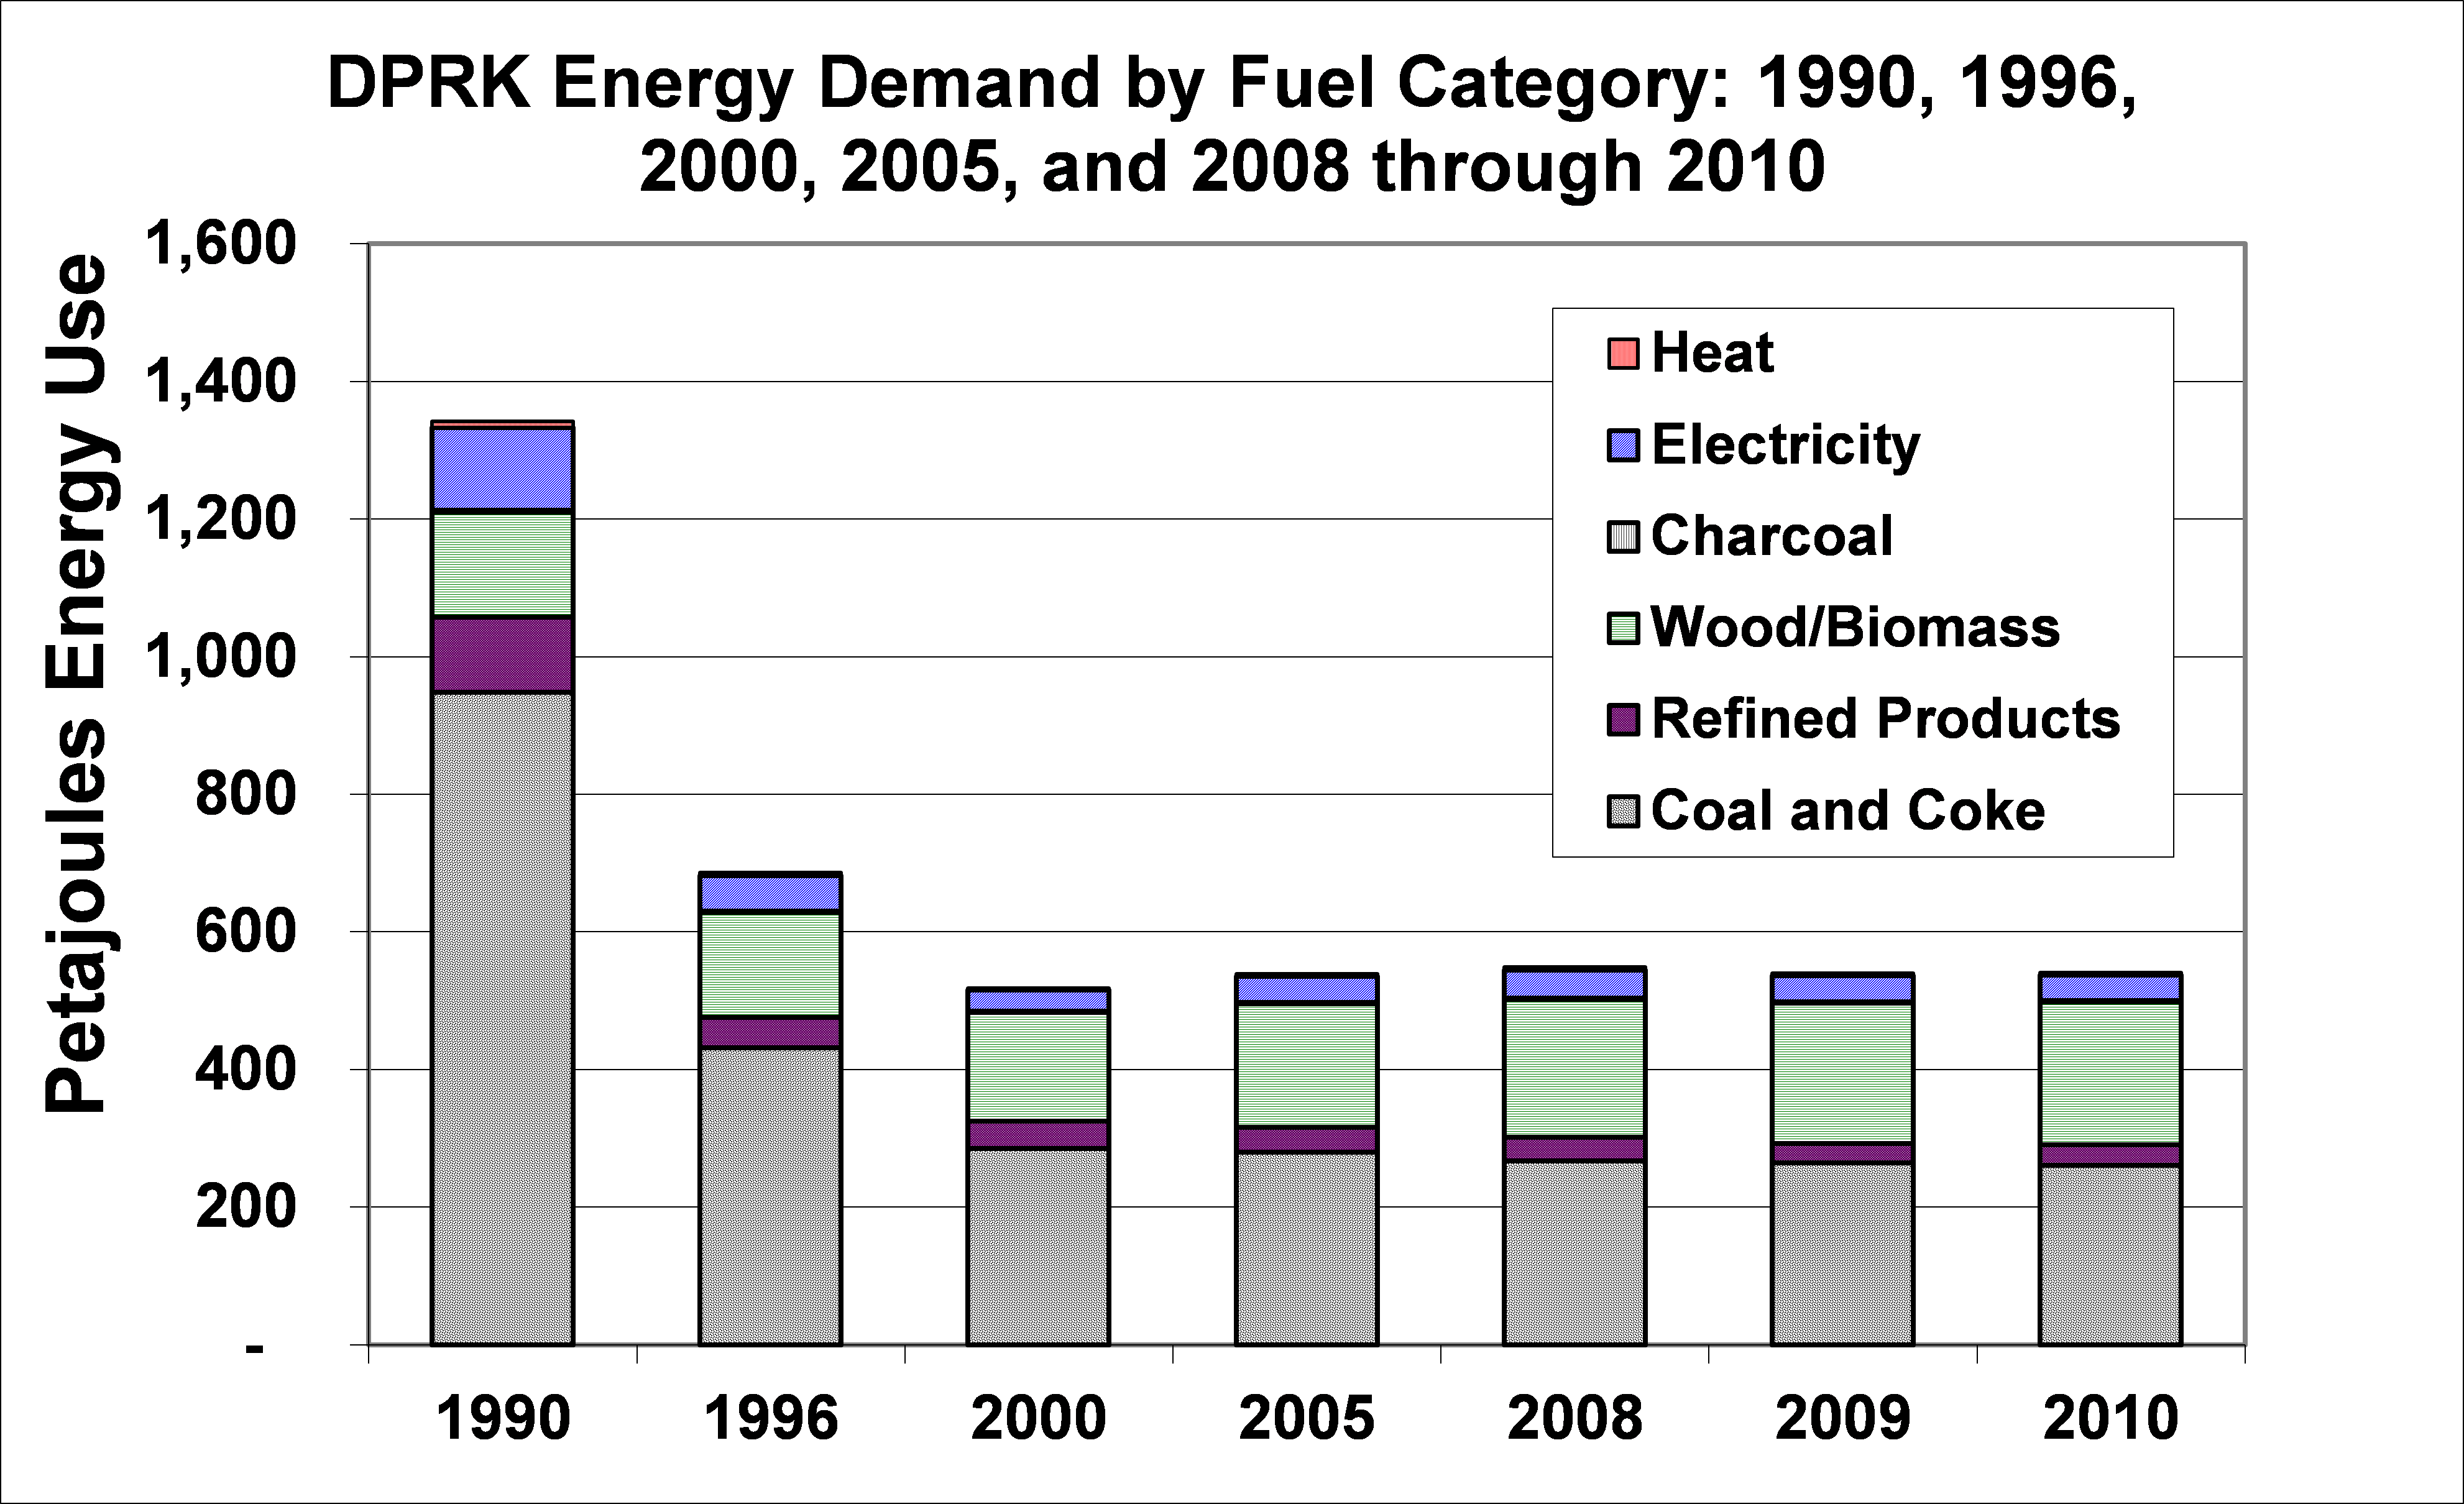 Figure 2: DPRK Energy Demand by Fuel: 1990 through 2010
The DPRK electricity sector is often a focus of interest, both for the impact that the sector has on the economy of the DPRK and on the daily lives of its citizens, because the status of the electricity sector had (and may again have) important political implications related to the former KEDO (Korean Peninsula Energy Development Organization) Light Water Reactor (LWR) project and electricity grid interconnection options[38]. Analysis of the current status of the DPRK electricity sector suggests that the thermal power generation system in the DPRK has been eroding significantly. In virtually all of the large power stations, only selected boilers and turbines are operating, and those that are still in use mostly operate at low efficiency and low capacity factors[39] due to maintenance problems and lack of fuel. As a consequence of the difficulties with thermal power plants, hydroelectric plants have shouldered the burden of power generation in the DPRK after 1996, as shown in Figure 3, but hydroelectric output is limited by maintenance problems and, equally importantly, the seasonal nature of river flows in the DPRK. The total estimated supply of electricity decreased substantially between 1990 (46 terawatt-hours, or TWh[40]) and 1996 (23 TWh), and it fell still further (by our estimate) by 2000 (to 13.3 TWh) before increasing somewhat to an estimated 16.6 TWh in 2005. Our estimate for electricity production in 2010 is somewhat lower than in 2005 at about 15.5 TWh. In the last few years, the DPRK’s imports of diesel- and gasoline-fueled electricity generators from China has increased dramatically, which we interpret as both an indicator of the poor condition of the DPRK’s electricity infrastructure and, on a perhaps more subtle level, the increasing ability of firms and individuals in the DPRK to take energy supply decisions into their own hands, a trend reflected in some of the energy paths described later in this paper.  Figure 3: Estimated Sources of Electricity Supply, 1990 through 2009
Table 2 presents our estimated summary energy supply-supply demand balance for the DPRK for the year 2010. The balance shows the significant fraction of DPRK energy demand supplied by wood and other biomass, particularly for the residential sector, though coal remains the top fuel for the economy overall. The military is the largest userof petroleum fuelsby our estimates, followed by the transportation sector. Coal remains by far the dominant fuel for the DPRK industries, and traditional heavy industries—iron and steel, cement, building materials (brick and glass manufacture), and other metals—remain the subsectors with the highest energy demand, though other industries (“non-specified”) may be becoming more important fuel users. In the residential sector, wood and other biomass are very significant fuels in the rural subsectors, and are used in the urban sector as well. Due to power supply limitations, per-capita electricity use in the residential sector in the DPRK is very low, with rural electricity use particularly small.
Table 1: Estimated Summary DPRK Energy Supply-Demand Balance for 2010 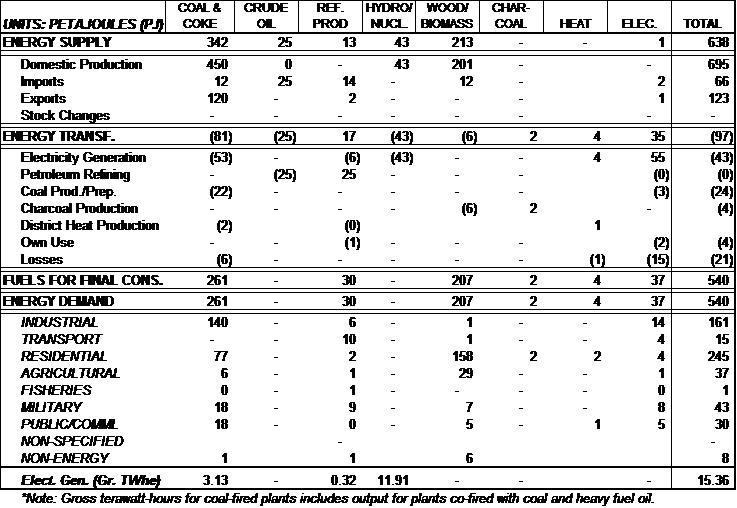
4 Future Energy Path Options for the DPRK
Despite a few outward, though often intermittent, signs of economic recovery in recent years—including more activity in the capital, increased trading with China, and a population that looks, in general, better nourished (to at least some visitors)—it is clear that the North Korean energy sector is a long way from good health. What does the near- and medium-term future hold for the DPRK, and what can be done by the international community, to improve the prospects of North Korean economic redevelopment that simultaneously eases tensions on the Peninsula and beyond and improves the lives of North Koreans? To address this two-part question, the section of this paper that follows first sketches a set of substantially different storylines (scenarios) for DPRK economic/energy sector redevelopment, then translates those scenarios into numbers (energy paths) to yield a more concrete sense of where the economy might go. The final two sections of the paper, respectively, compare the paths generated with respect to the energy security criteria, both qualitative and quantitative, defined above, and look for common lessons in the analytical results. There are essentially three different ways that the DPRK energy sector and economy could evolve from their current status. First, the economy could open, leading to economic redevelopment. This process, of course, could occur slowly or rapidly, and could take on very different characteristics, depending on how it is managed (or not managed). Second, the economy could fail to open substantially, leading to a continuation of recent trends of stagnation in the economy and in availability of energy supplies. Third, the Kim regime could collapse in one of many possible ways, leading, in most scenarios, to actual or de-facto economic integration with the ROK. We must emphasize that we do NOT think that DPRK regime collapse is likely in the near- or even medium-term. It is instructive to think through the implications of collapse scenarios, but beyond the scope of this paper—please see our previous work on the topic[41]. Variants of the economic redevelopment scenarios fall on the right hand side of Figure 4, while recent trends and collapse scenarios fall on the left side. 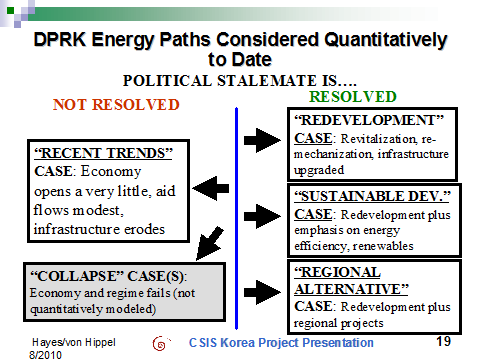 Figure 4: DPRK Energy Paths/Scenarios Considered
4.1 The DPRK under a Medium-Term “Redevelopment” Pathway
Below we describe, in a very qualitative way, what a medium-term “Redevelopment” path through 2035 might look like for the North Korean economy and, by extension, for the DPRK energy sector. This qualitative sketch is a first step to the estimation of the quantitative attributes of such a path—what the path might mean, for example, in terms of consumption of future terajoules of petroleum, tonnes of coal, and megawatts of power. First and foremost, the “Redevelopment” pathway implicitly assumes a modest breakthrough in relations with the ROK, and probably with the United States as well. With an eye toward recent trends in the DPRK economy, however, including the rise in the last few years of traders doing business with China[42], we speculate, for the “Redevelopment” path, that this breakthrough in relations is less than a profound embrace of the international community by DPRK leadership. Rather, it the result of a few significant actions—allowing IAEA[43] inspectors back into the country to monitor existing nuclear facilities, for example, re-committing to the armistice agreement, and starting peace talks—that are just enough, and just consistent enough, to encourage the international community to progressively relax some of the trade restrictions placed on the DPRK over the years. This relaxation results in some investment in the industrial and energy infrastructure in the DPRK from non-China outside parties, and allows trade with China (and investment in the DPRK by Chinese) to accelerate. Some, additional foreign development aid also starts under the Redevelopment path, but is limited by a relatively slow pace of rapprochement between the DPRK and the US and ROK, possibly due to a combination of DPRK reluctance to move too quickly (for internal reasons) and a lack of consistent consensus between the ROK and US on how to proceed with the DPRK. The “Redevelopment” path also assumes that the North Korean government essentially maintains its integrity, though its formal power and control over the economy consistently erodes as more and more business concerns, many of them controlled by a combination of DPRK officials and Chinese firms, set up and/or appropriate assets for manufacturing, mining, and selling goods to buyers within and outside the DPRK. Consistent with the above, a “Redevelopment” pathway for North Korea would likely be built upon the following assumptions:
- With some political and economic opening, coupled with small amounts of increased foreign aid, the North Korean economy starts to revive in earnest (for example, in 2014)—but the structure of the economy evolves along quite different patterns than those prevailing in 1990 in that the emphasis is tuned further toward producing raw materials and goods for China.
- Industrial production increases, particularly in the lighter industries; and there is increased demand for transport and consumer goods.
- There is an increase in household energy use, as improved supplies become available and incomes increase, with trends toward using more electricity, LPG, and kerosene in homes.
- There is a considerable increase in commercial sector activity, and a relatively small increase in military sector energy use, the latter due to the offsetting impacts of modernization (and increased per-soldier energy use) and some reduction in forces.
- Refurbishment of electric transmission and distribution infrastructure takes place, albeit slowly and in a piecemeal fashion, emphasizing and driven by improvements needed for new or expanding business ventures. To the extent that they can be financed primarily privately, these improvements may include refurbishment of existing hydro plants, building of new hydro capacity, the re-starting and expansion of the DPRK’s east coast refinery (in cooperation with Russia), and partial retirement of coal-fired electricity generating capacity.
- The DPRK continues to build its small domestic light water nuclear reactor (LWR), albeit under the watchful eye of the IAEA, completing its pilot unit (of capacity of about 30 MWe[44]) in 2017. Thereafter, it completes an additional 100 MWe of capacity every 4 years, and expands its uranium enrichment facilities sufficiently to fuel the expanding reactor fleet.
- Modest improvements in energy efficiency take place, but because there is little coordinated planning or regulation of the evolution and redevelopment of the energy sector, the emphasis is on very short-term returns, and thus attention on longer-term investments such as more efficient equipment takes a back seat. For example, as household incomes expand, appliances are purchased, but they tend to be either pre-owned units (from China, the ROK, or Japan, for example) or the least-efficient, most inexpensive new Chinese models. Similarly, investors in industrial infrastructure, mindful of a history of reversals in economic reform, choose less-expensive, and less-efficient, equipment, again possibly including older equipment decommissioned from Chinese factories, for installation in the DPRK. This posited trend in also consistent with the DPRK’s history, in the past decade and more, of importing used cars (for example, from Japan and China) and other transportation equipment (for example, retired subway cars from Germany).
4.2 Variants on the Redevelopment Path
In the context of collaborative research on regional energy security in Northeast Asia[45], Nautilus Institute has developed and evaluated alternative paths that provide the same energy services—that is, in effect, the same level of economic development—as the Redevelopment path described (in summary) above, but incorporate in an expanded way, relative to the Redevelopment path, features of energy efficiency and renewable energy, as well as strengthened regional cooperation in the energy area. The two main alternative paths evaluated are:
- The “Sustainable Development” Path. This path provides the same energy services as “Redevelopment” Path—with, for example, the same demographic assumptions, and the same levels of economic output—but applies energy efficiency, renewable energy, and other measures, in an aggressive fashion, including upgrading of industrial infrastructure to levels approaching high-efficiency international standards, a rapid phase-out of existing coal-fired power plants, addition of a shared (with the ROK) LNG (liquefied natural gas) terminal and of gas CC (combined cycle) generating plants using the gas from the LNG plant.
- The “Regional Alternative” Path. This path resembles the Sustainable Development path, but as a result of regional cooperation, efficiency improvement targets are reached two years earlier than in Sustainable Development path, and at costs that are 10 percent lower. In the fuel supply sector, a gas pipeline from the Russian Far East to the DPRK and the ROK begins operation in 2016, with 3 percent of the gas throughput of the pipeline used in North Korea initially, 10 percent by 2020, and 20 percent by 2030. The DPRK receives $50 million per year as “rent” for hosting the pipeline. Also, a larger LNG facility is installed than in the Redevelopment or Sustainable Development paths—and is again shared with the ROK. A power line from the Russian Far East through the DPRK to the ROK is also installed. Cooperation in renewable energy technologies yields earlier deployment of those technologies, and a 10 percent reduction in cost of wind and small hydro technologies relative to the redevelopment path. As in the Sustainable Development Path, the last of the DPRK’s existing coal-fired plants are retired by 2025.
In both the Sustainable Development and Regional Alternative pathways, a greater degree of formal rapprochement with the international community is both required and assumed than in the Redevelopment pathway. We would argue that only truly significant and demonstrably continuous progress with winding down the DPRK’s nuclear weapons program, coupled with real progress in peace talks with both the US and ROK, can offer the prospect of sufficient international cooperation and economic opening for the DPRK to rebuild its economy in a more coordinated fashion that builds in energy efficiency and other measures geared toward more sustainable economic development. Three additional paths, themselves variants on the paths above, were also explored. Each assumes that the nuclear reactors initially under construction by KEDO[46], or, should the existing work on the sites prove unrecoverable, new reactors on those sites, will be completed, and the bulk of the power from those reactors routed to the ROK until a unified or substantially joined Korean grid (including a rebuilt DPRK grid) can be developed. This “with nuclear” overlay is applied to the Sustainable Development and Regional Alternative paths. A third variant, “Regional Alternative Max Nuclear”, builds an additional two reactors in the North by 2030. One further scenario, the “Recent Trends” path, assumes that the DPRK remains largely a closed economy, but continues to trade with China and others in quantities such that it is able to maintain its economy at close to current levels, with possible modest improvements in some sectors. This assumes that the DPRK’s energy infrastructure, in particular its electricity generation and T&D infrastructure receives just enough investment to keep it from failing, but not enough to make significantly enhanced supplies of energy services available to the DPRK’s citizens, at least on average. The Recent Trends case serves as a counterpoint to the scenarios above, but is not strictly comparable to them, because it does not produce the same level of economic activity or energy services.
4.3 Results: Redevelopment Path
Selected results of the evaluation of the paths described above are provided below. The results were prepared with the Long-range Energy Alternatives Planning energy/environment software tool or LEAP[47]. Figure 5 shows final demand by fuel for the Redevelopment Path. Trends here of note after 2010 include the decrease in the use of biomass fuels, the increase in the use of electricity, and the introduction of more use of liquefied petroleum gas (LPG) and diesel fuel over time. Figure 6 shows final demand by sector, showing the increase, in future years, of consumption in the transport, public/commercial (commercial/institutional), and residential sectors relative to the industrial sector. Relative growth in residential sector energy use would appear greater were it not for the gradual phasing out of biomass use in households. Figure 7 shows the trends in demand by sector electricity under the Redevelopment path. Electricity use increases by approximately a factor of five between 2010 and 2035, as, particularly, households and public/institutional buildings have access to adequate supplies of electricity, and are able to purchase new electricity-using devices and enjoy higher levels of electricity-related energy services. Coal use increases rapidly between 2013 and 2020, as supply restrictions are lifted and existing basic industries are brought back on line to some extent, but growth in coal use declines after 2020 as households and industries begin switching to other fuels, and a transition away from heavy industry begins. There is an approximately five-fold increase in petroleum products use between 2010 and 2035, led by gasoline and diesel use in (mostly) the transportation sector, but also by the rise of the use of LPG, in particular, in the residential sectors, as LPG is substituted for less-convenient-to-use coal in cooking applications, the increase in diesel use in the agricultural sector as agriculture is re-mechanized, and the increase in the use of “non-energy” oil products, especially asphalt (for upgrading the DPRK’s road infrastructure), but also lubricants and other specialty products as well. 
Figure 5: Redevelopment Path Final Energy Use by Fuel
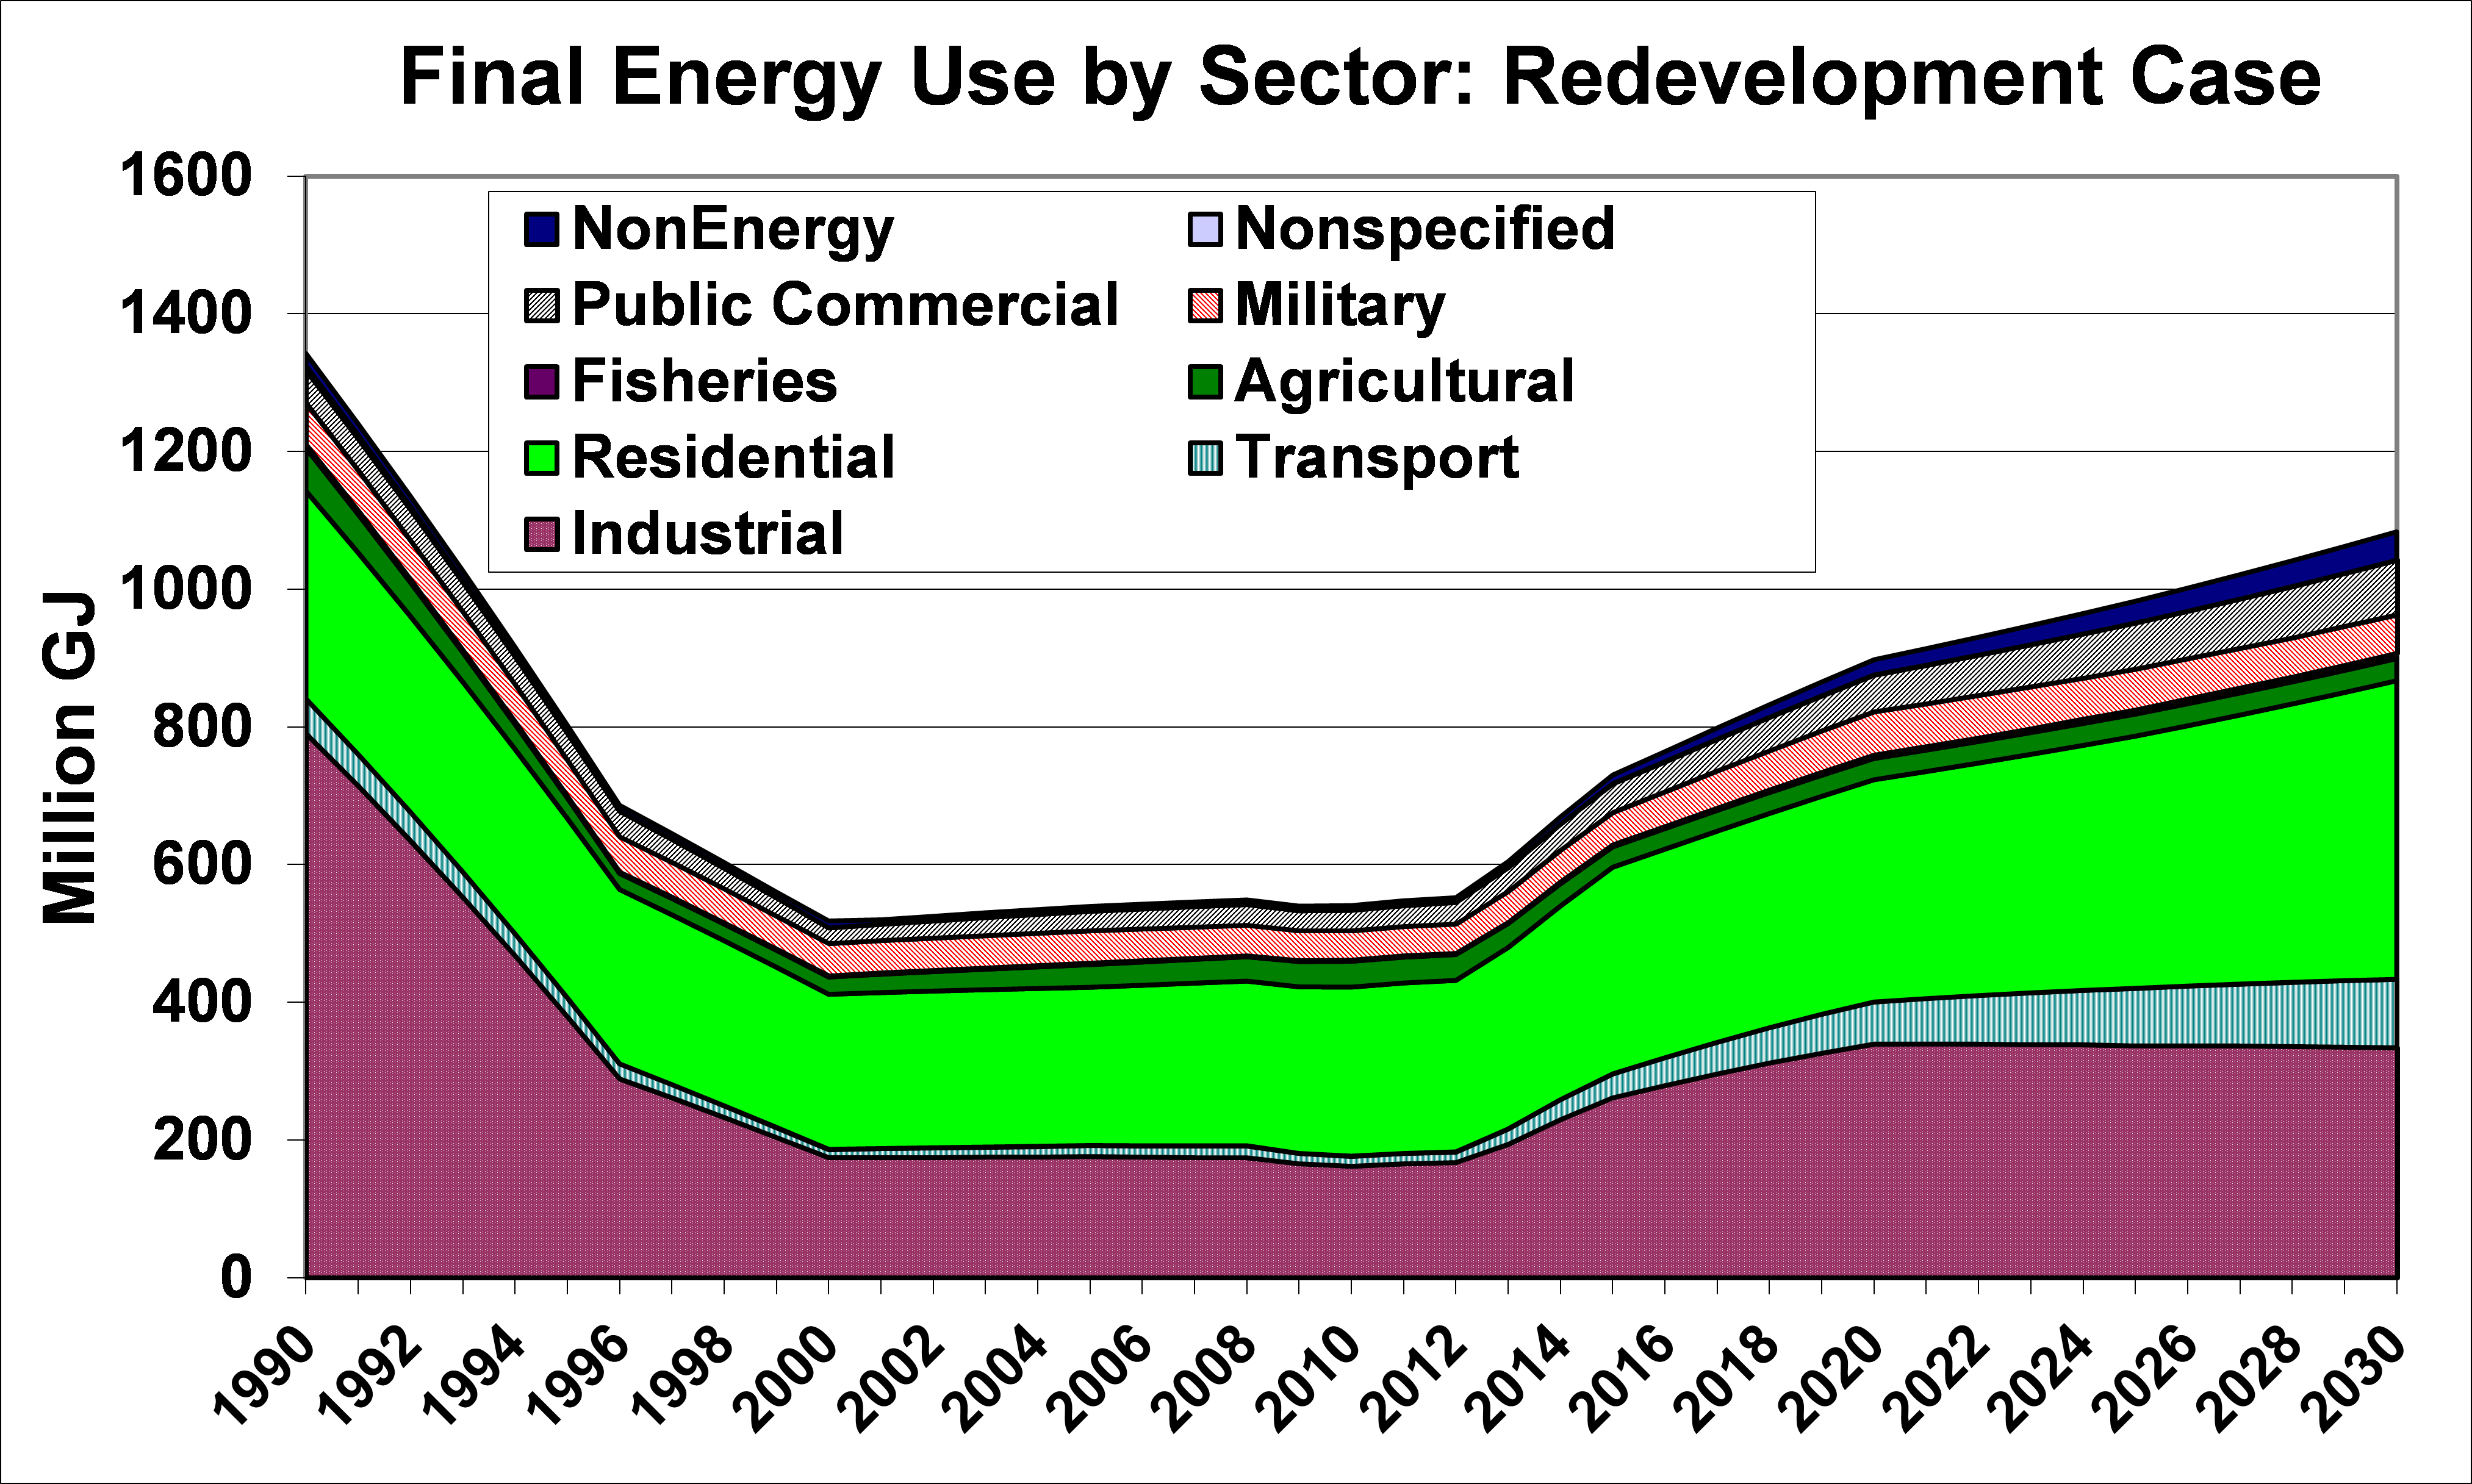
Figure 6: Redevelopment Path Final Energy Use by Sector
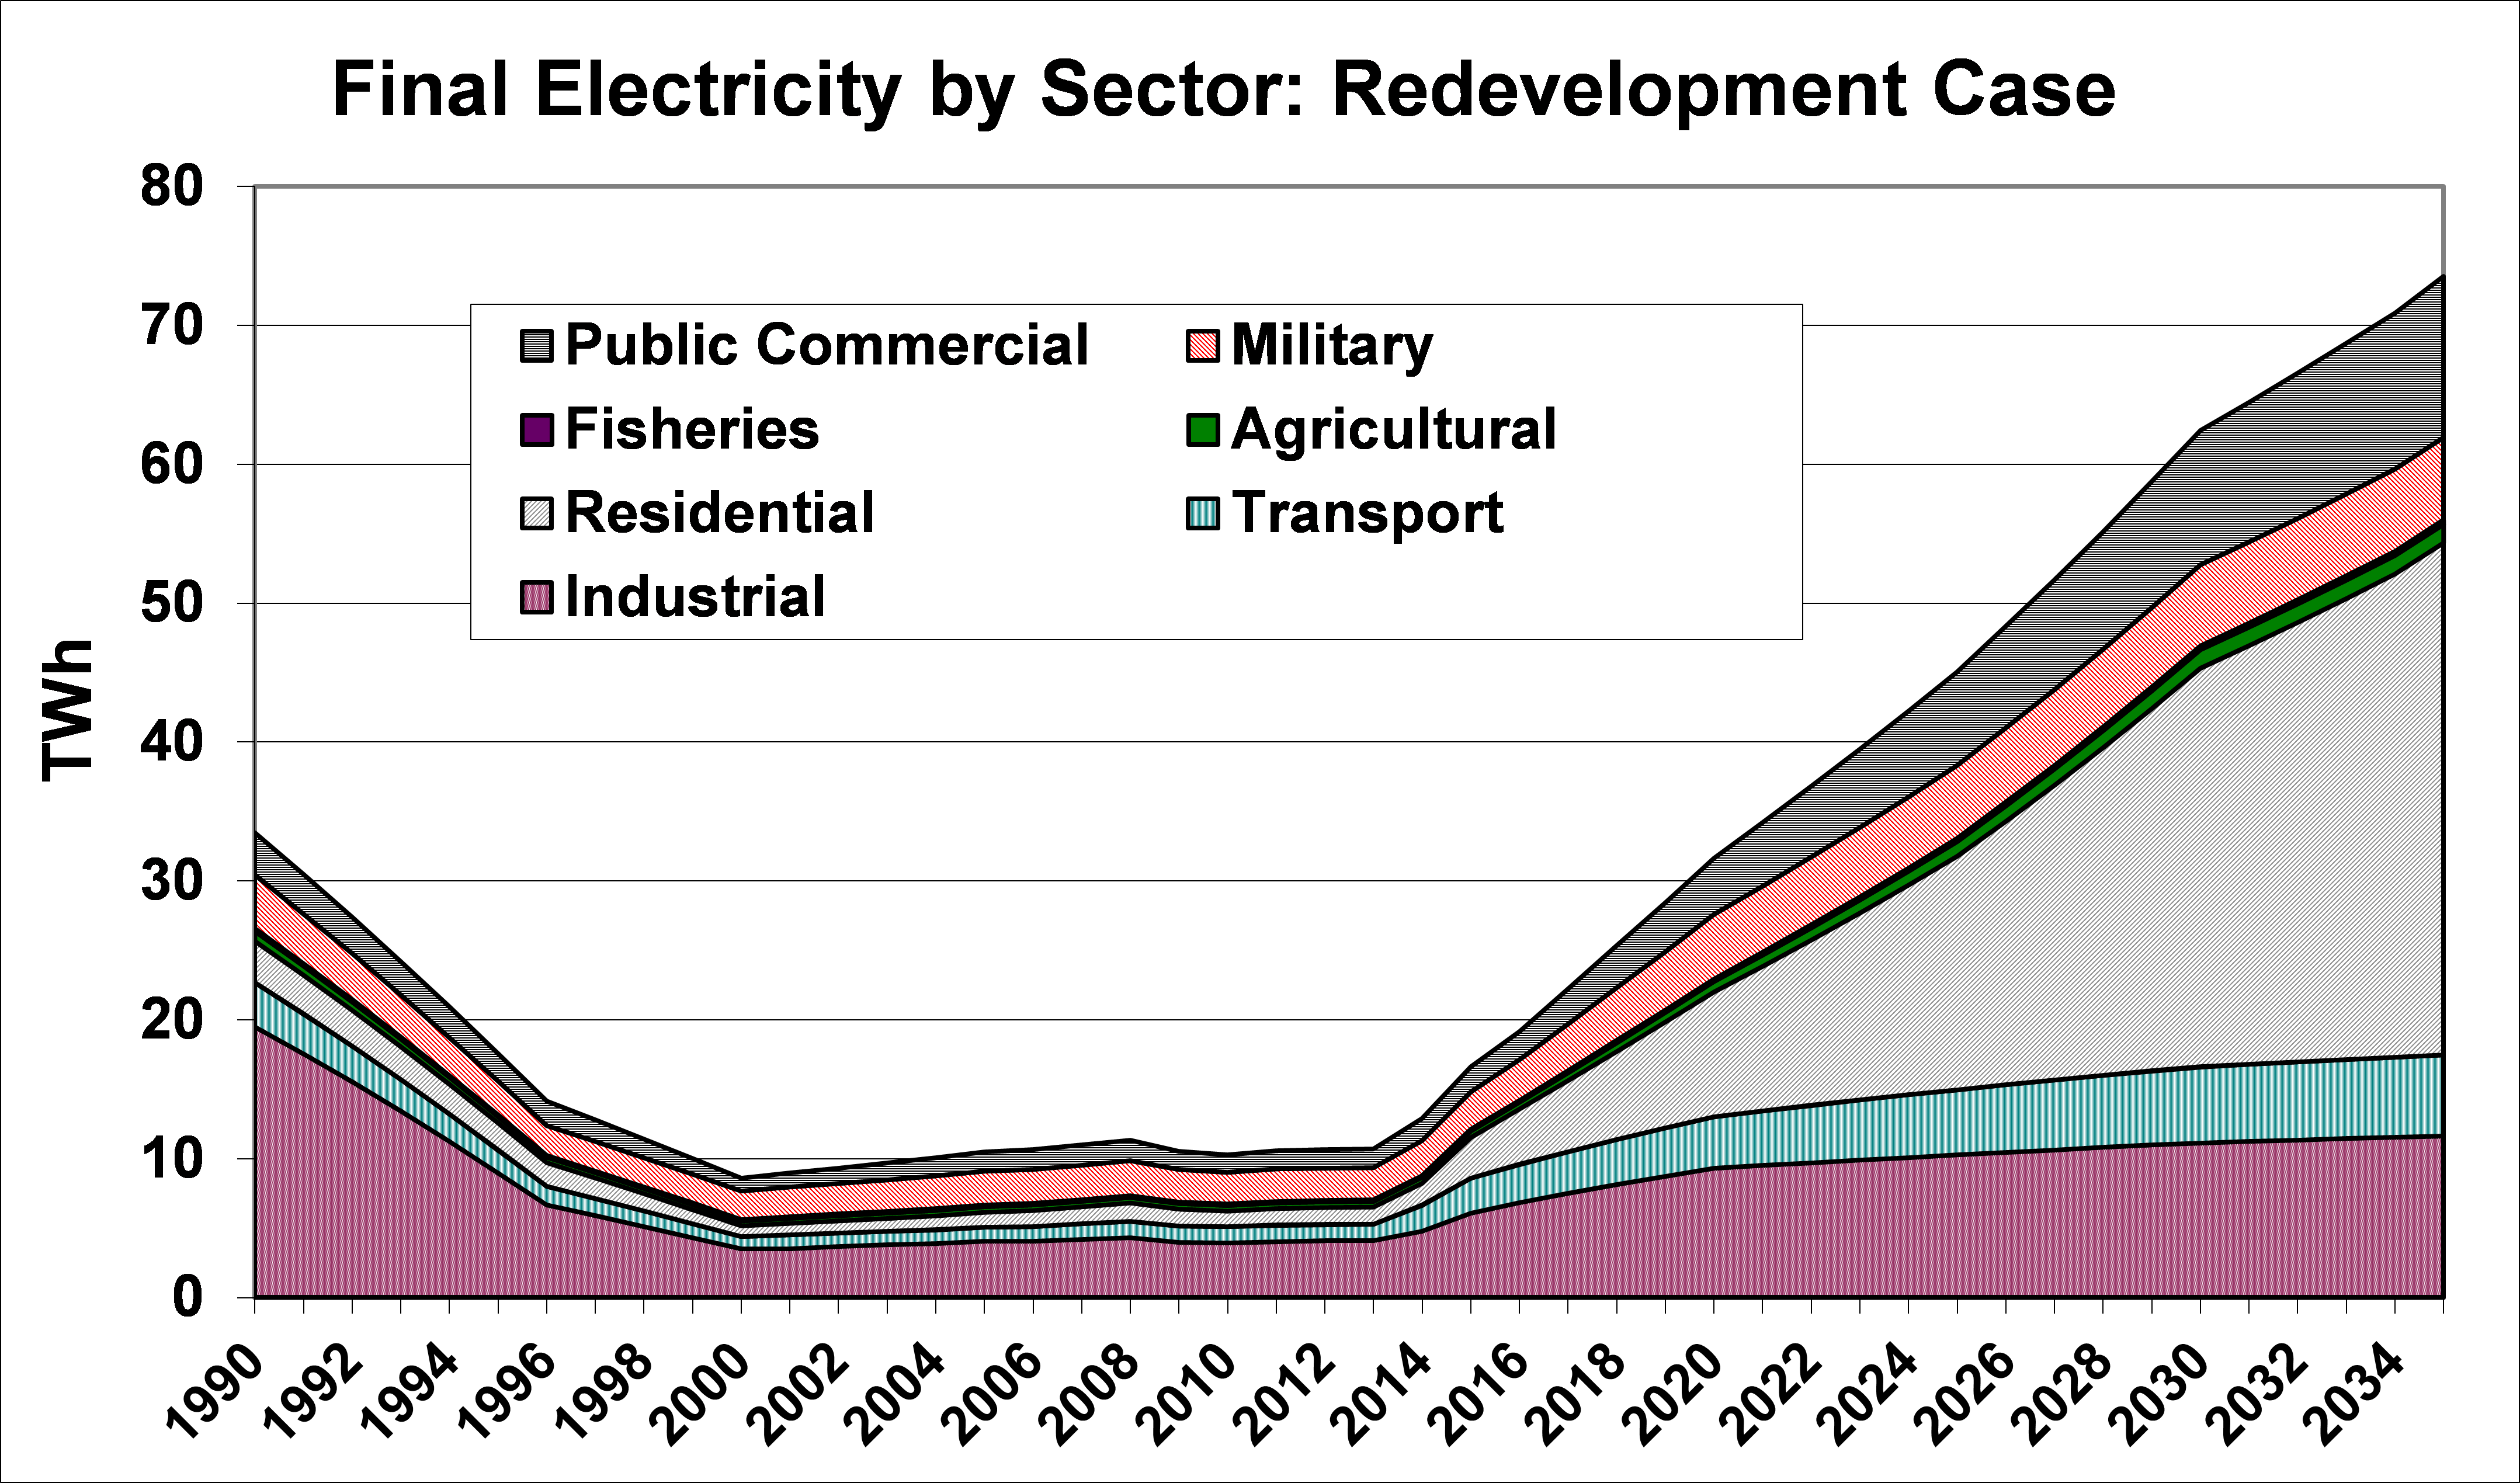
Figure 7: Redevelopment Electricity Use by Sector
Figures 8 and 9 show, respectively, the changing patterns of electricity generation capacity and of output by type of generator in the Redevelopment path. Other than hydroelectric generation, renewable energy plays only a small role in electricity production even as the economy redevelops. Existing and some new hydro remains a significant, though declining, portion of total capacity through 2035, but constitutes a smaller portion of output due to the limited capacity factor of hydro facilities (due to seasonal variations in water supply). As older coal plants are phased out, new coal plants and new gas combined cycle plants (fueled with diesel and LPG) are brought on line, constituting a significant share of capacity, and a larger share of electricity output, by 2035. 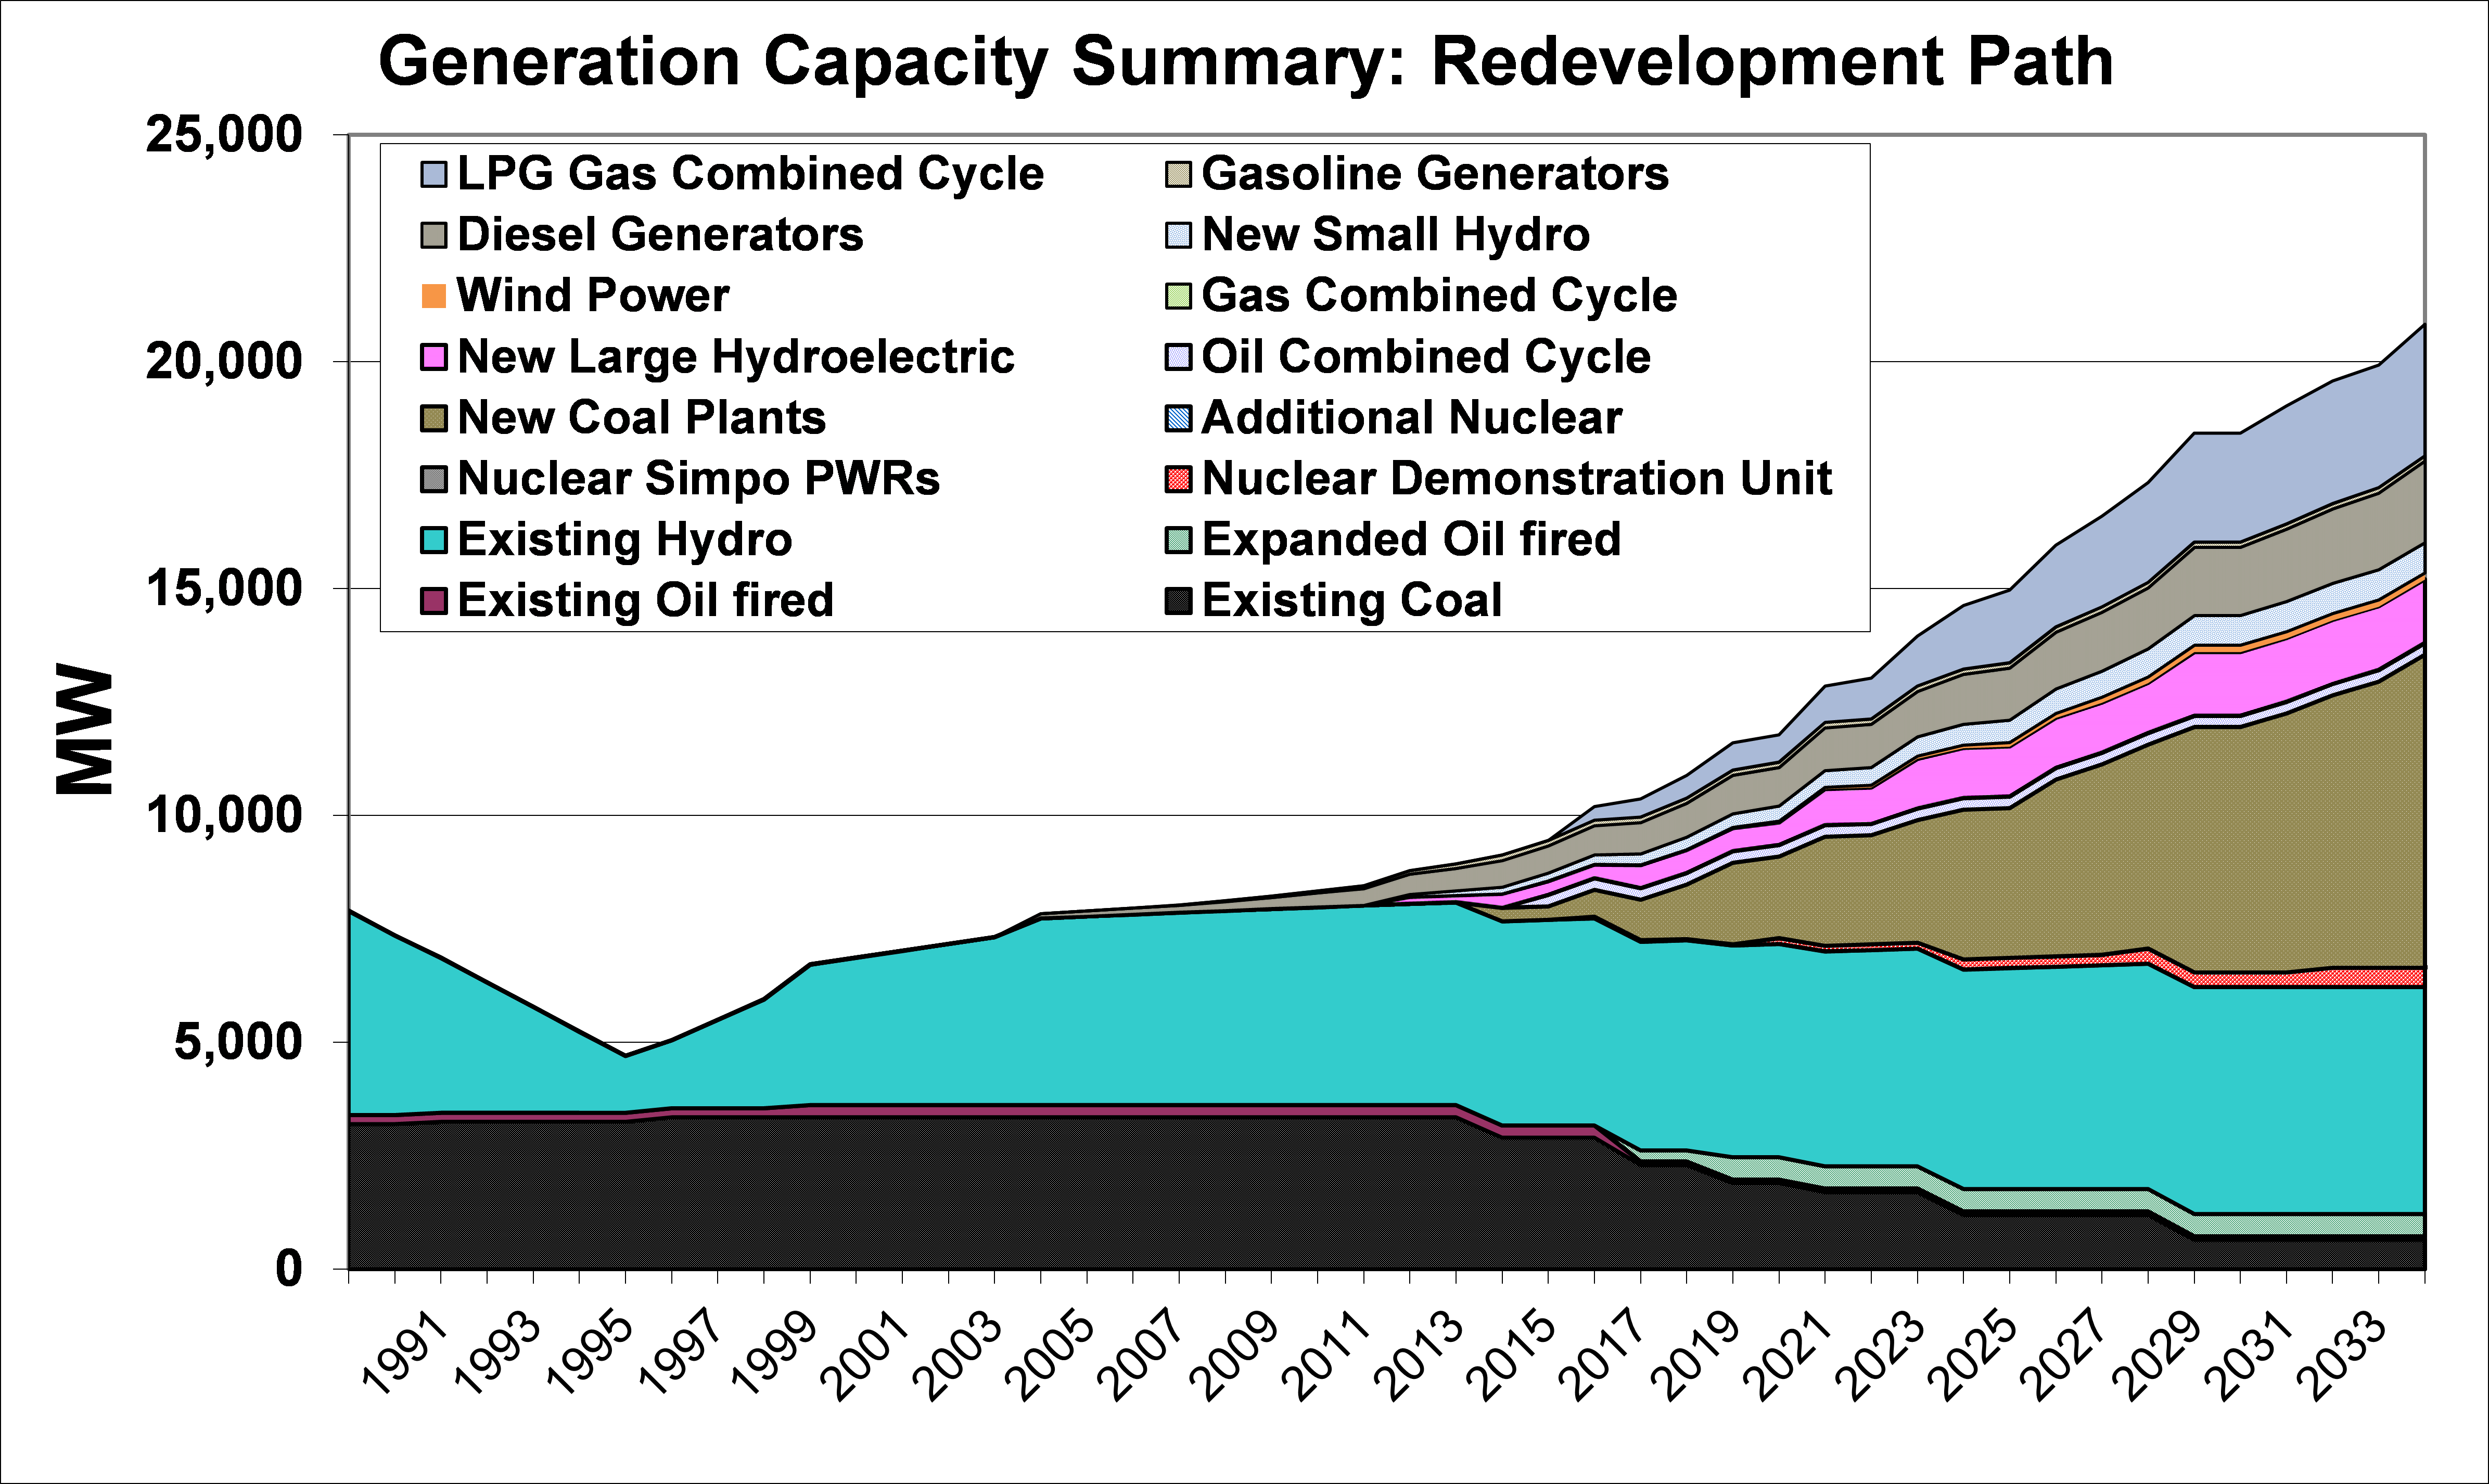
Figure 8: Trends in Generation Capacity by Type in the Redevelopment Path
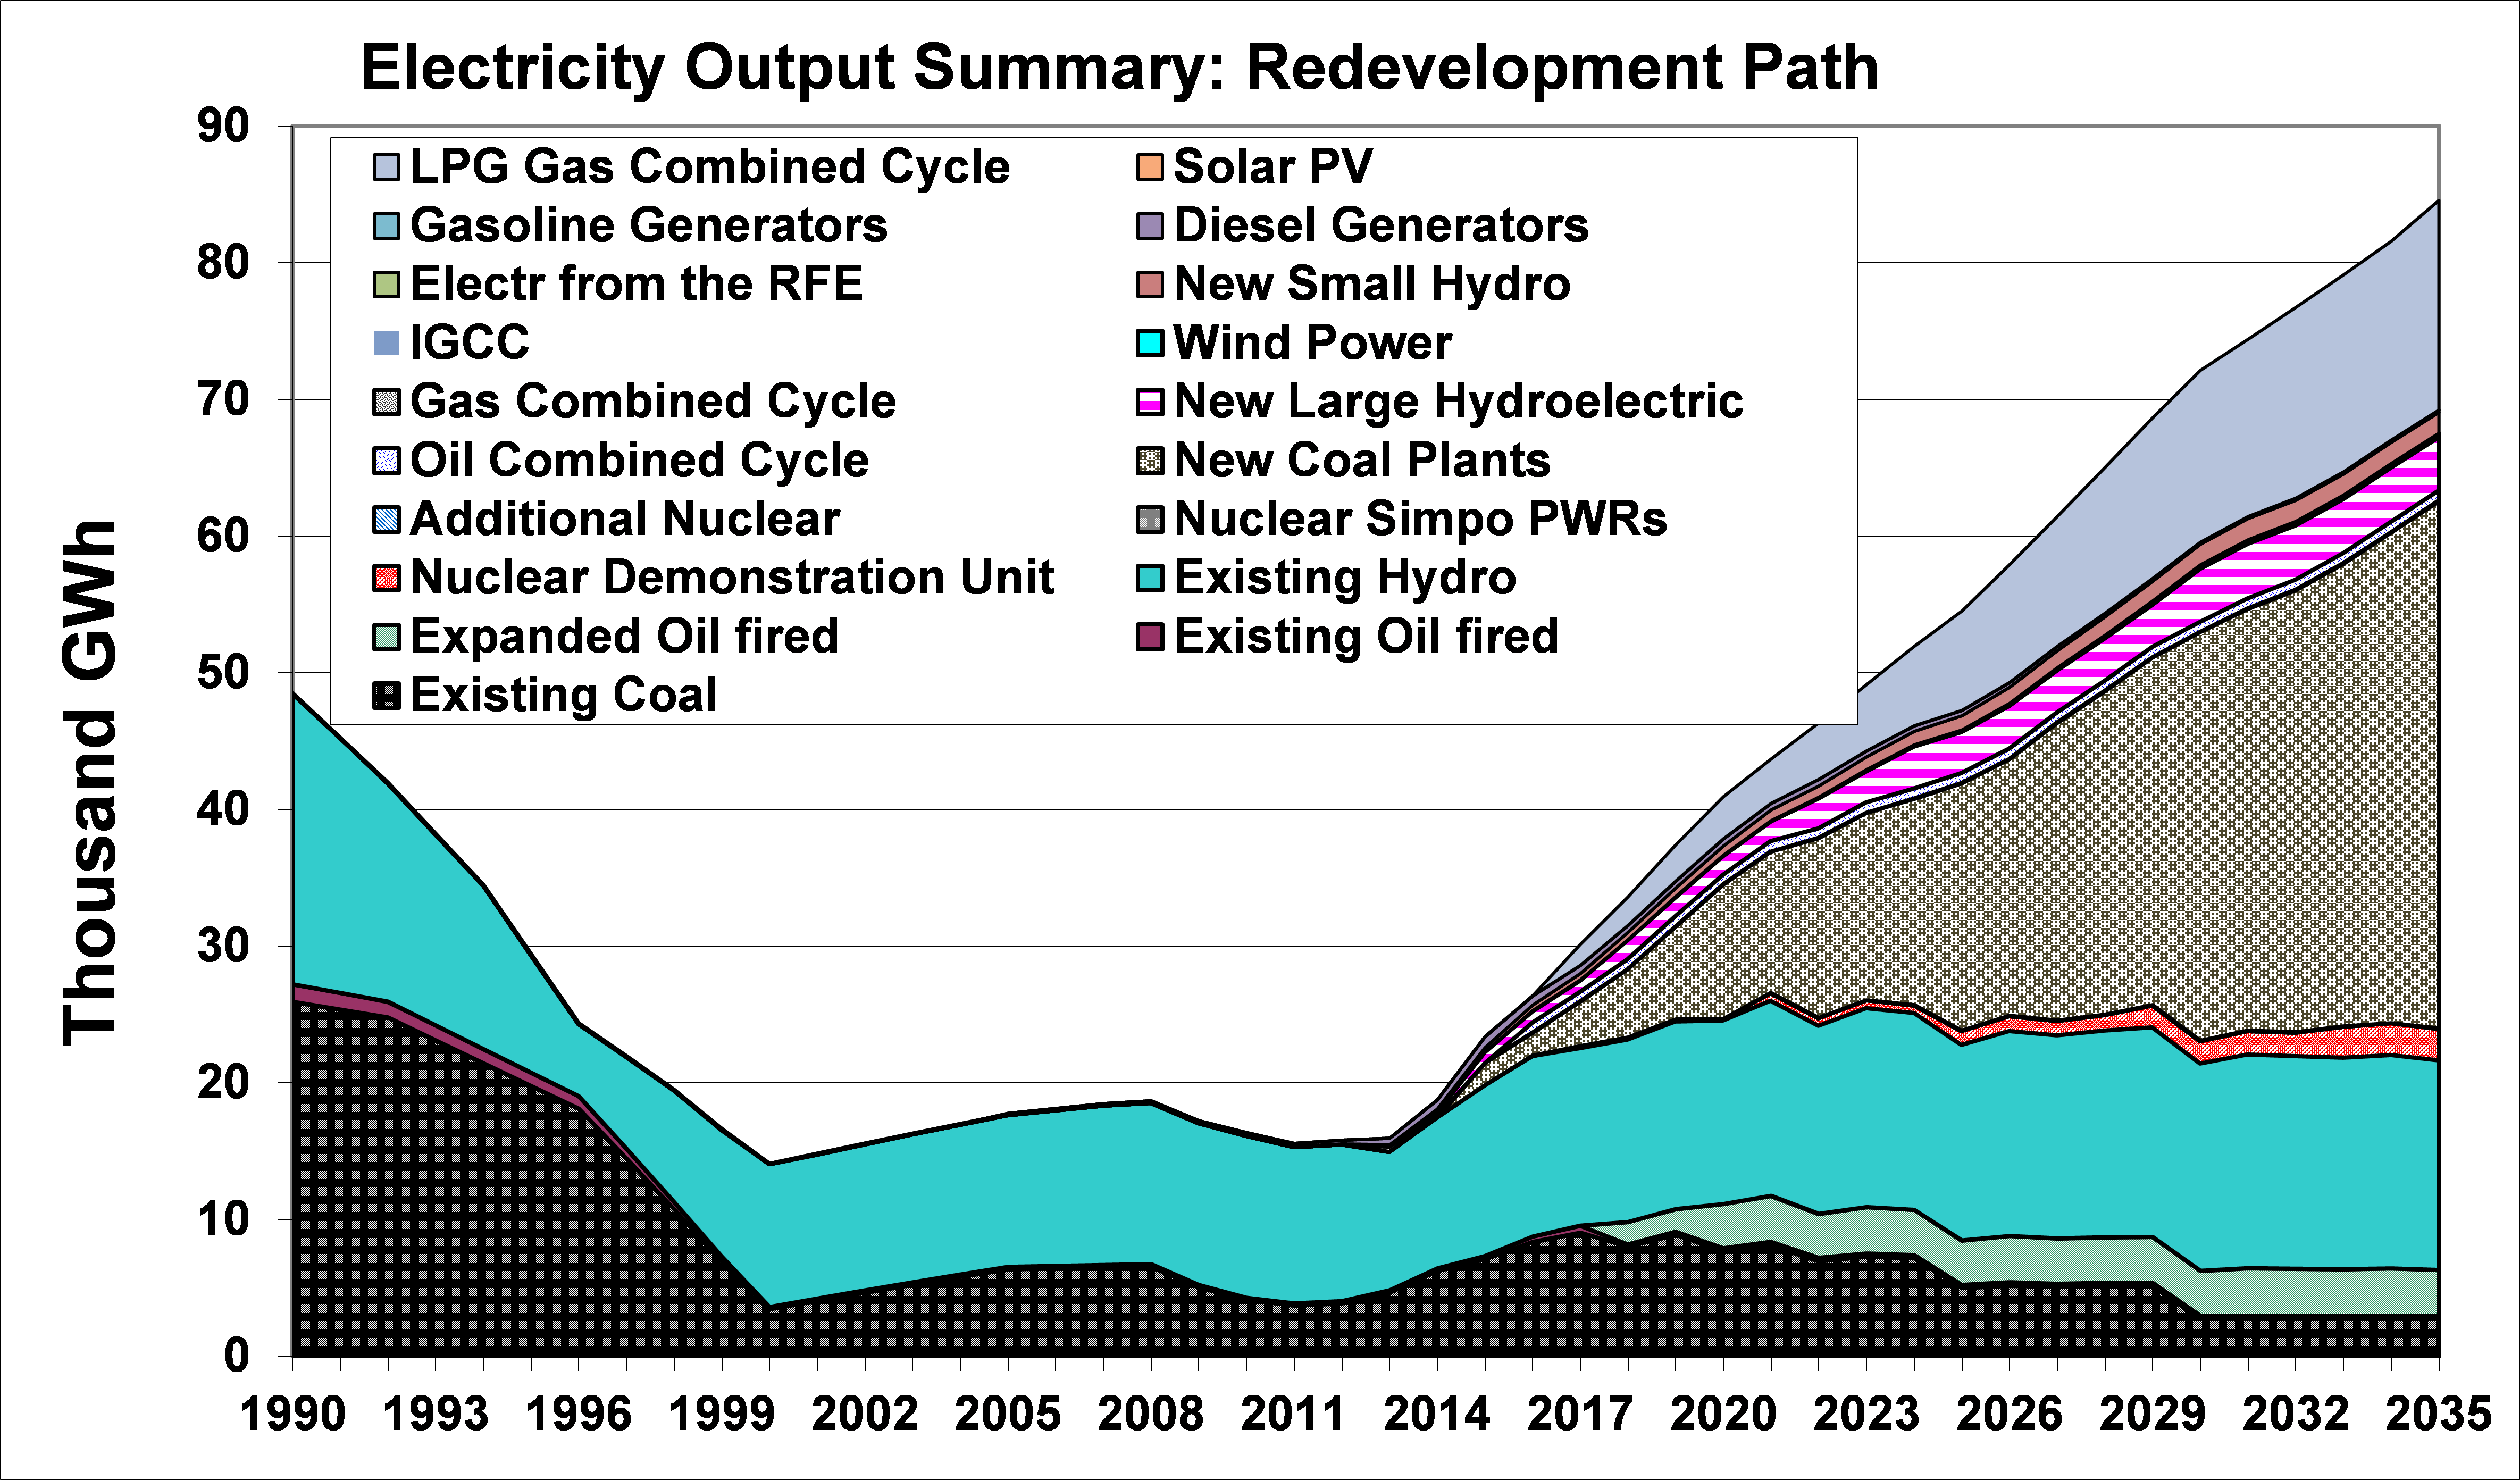
Figure 9: Trends in Generation Output by Type in the Redevelopment Path
4.4 Results and Path Comparisons, Sustainable Development and Regional Alternative Paths,
The “Sustainable Development” path is an illustration of the potential impacts of applying a selected set of demand-side energy efficiency measures, together with expanded deployment of renewable energy systems (in this case, renewable electricity generation options). As such, it is designed to provide the same “energy services” (lighting, heating, cooking, transport, and industrial output, for example) as the Redevelopment case, but in a different way. Figures 10 and 11 show final energy use by sector and fuel, respectively, in the Sustainable Development path. Here, overall energy use rises quickly after 2013, but then plateaus as the increased use of energy services is offset by the aggressive application of energy efficiency measures. In addition, there is a stronger transition to electricity and gas use than in the Redevelopment path, which also lowers energy use because gas can be burned more efficiently than coal of biomass. The direct use of solar energy, in the form of solar water heating, also plays a role by 2035. The pattern of energy demand by sector in the Regional Alternative case shows a very similar pattern of total energy demand to the Sustainable Development path, with a slight shift to lower overall use slightly earlier in time by the 2020s, based on the assumption that regional cooperation accelerates the deployment of energy efficiency and renewable energy measures in the DPRK. Figure 12 shows fuel use by sector in the Recent Trends case. This case is very different in concept than the Sustainable Development or Regional Alternative cases, as the Recent Trends case provides a standard of living and economic output by 2035 only slightly improved from that prevailing in 2010, but the overall energy consumed by 2035 is not very different than in the Sustainable Development case, mostly because the Recent Trends case continues to use inefficient demand-side devices, and continues to rely on coal and biomass, which provide less usable energy per unit of fuel consumed. 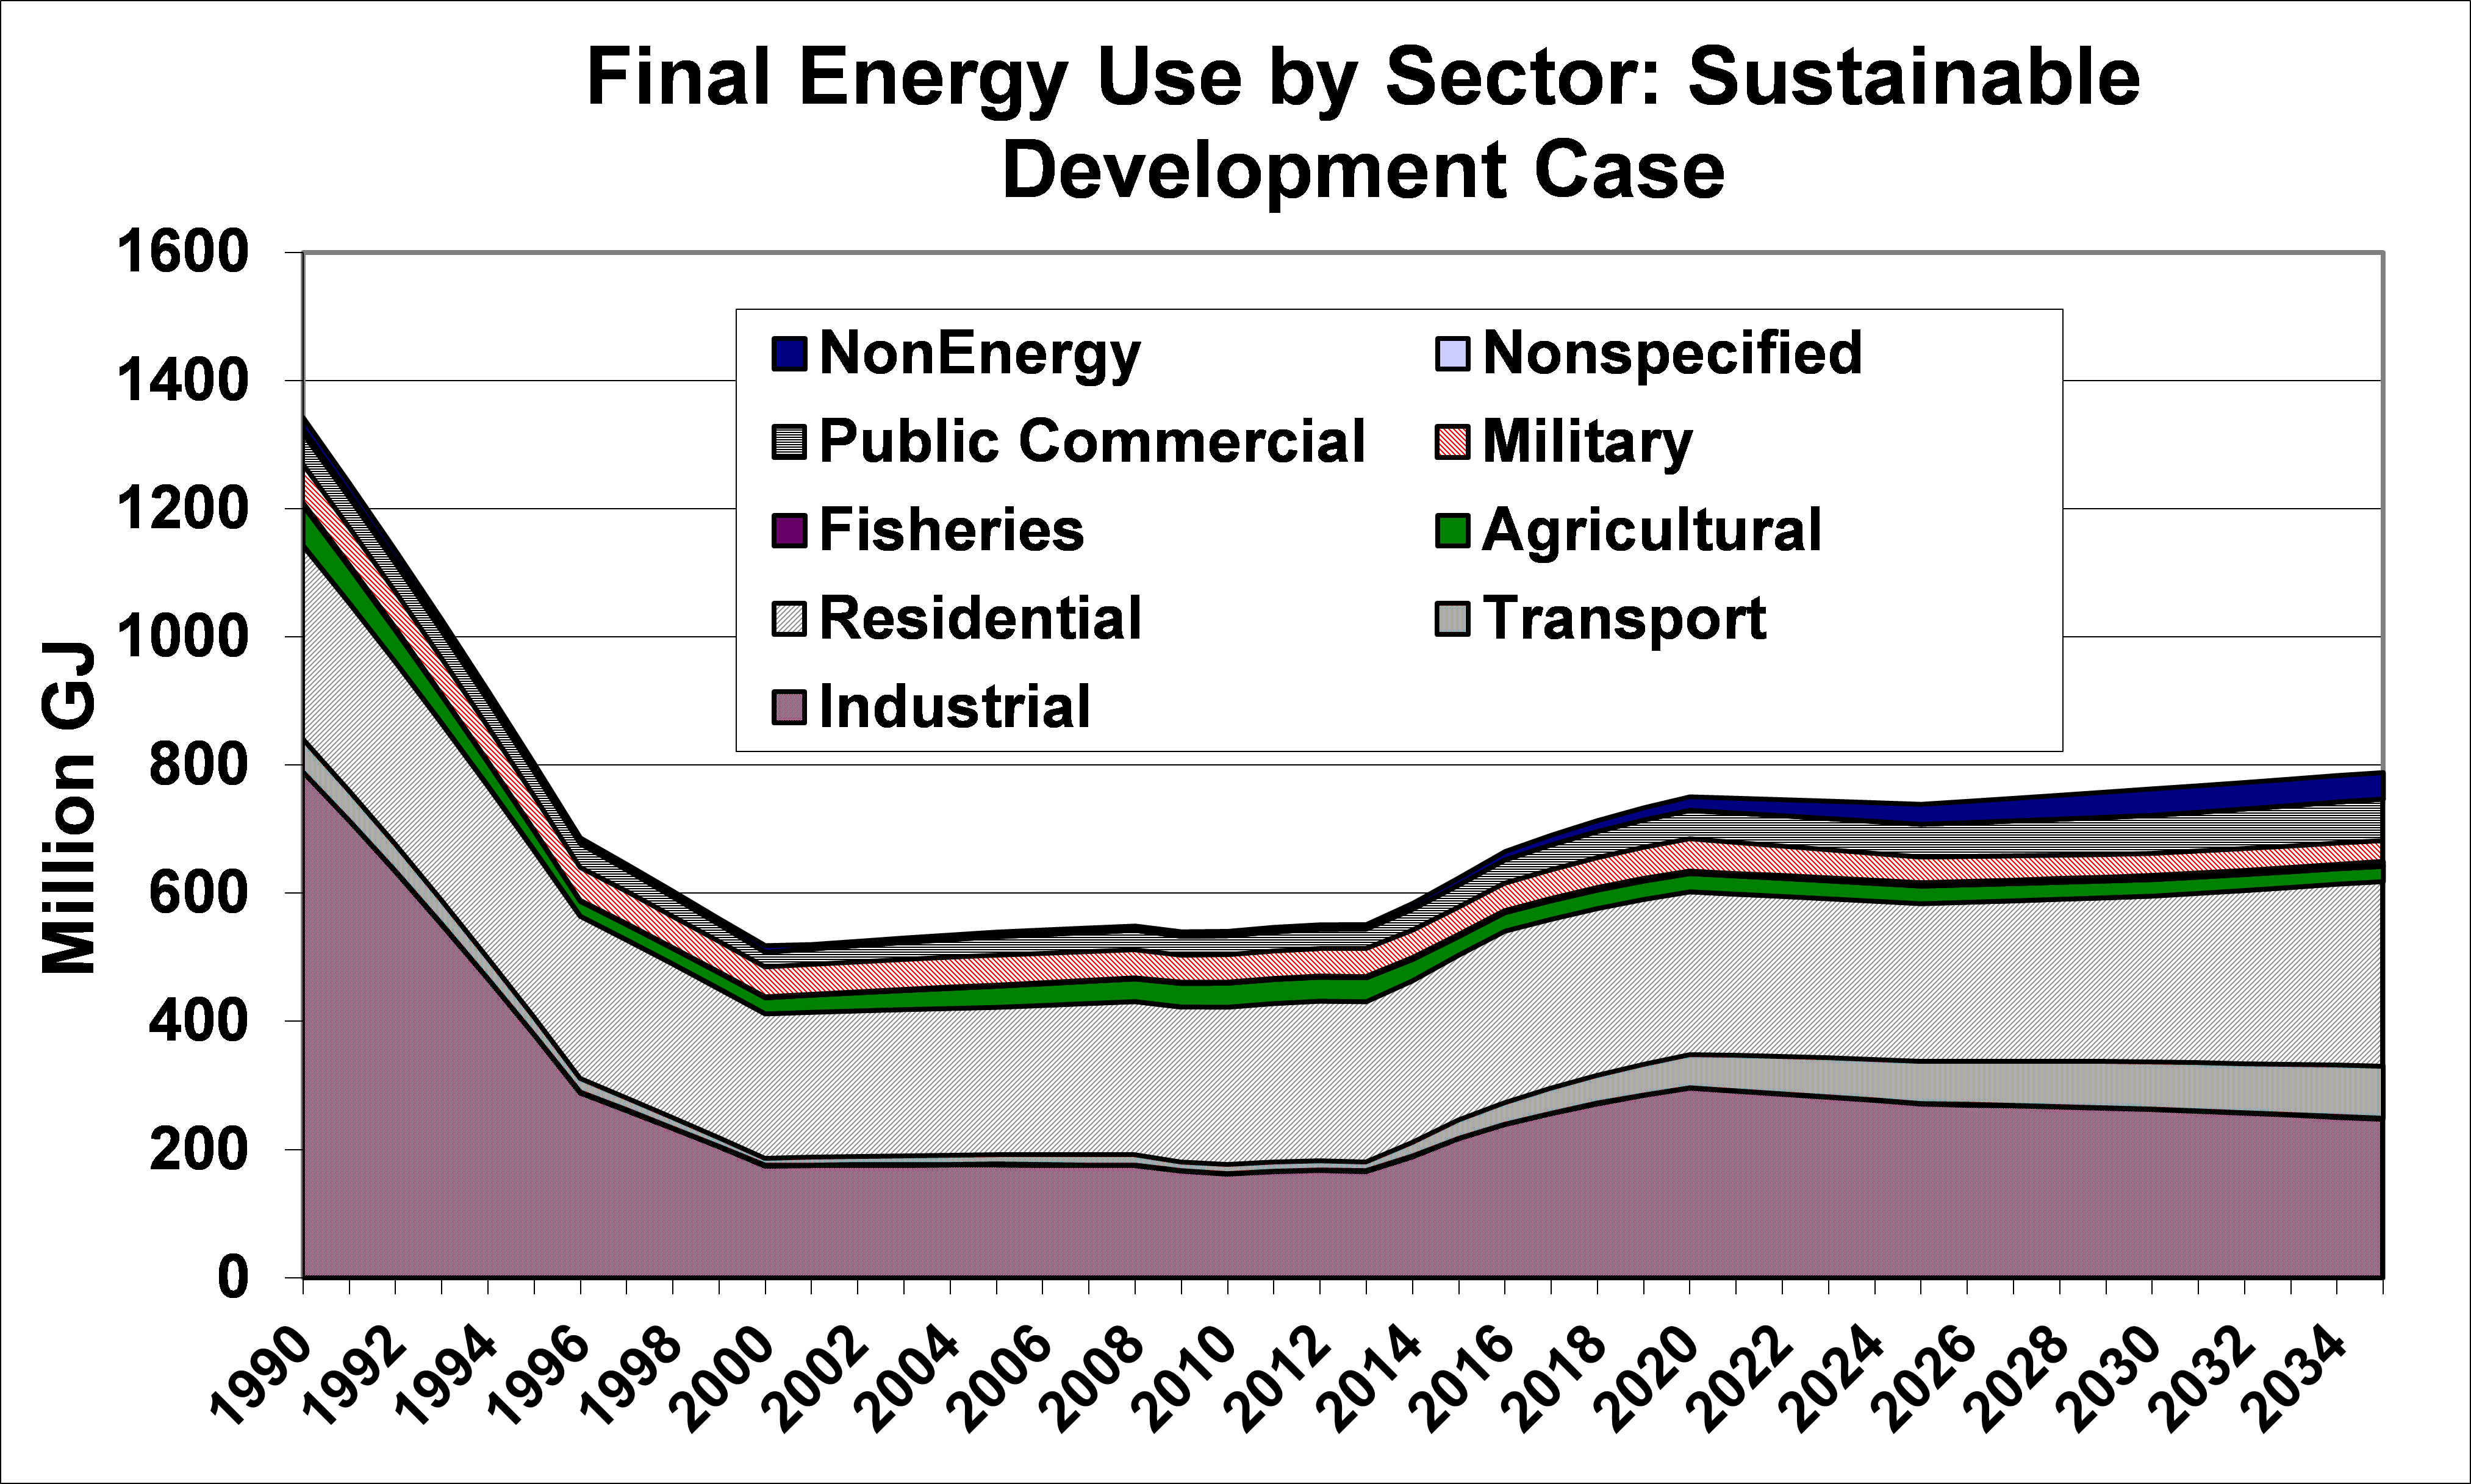
Figure 10: Sustainable Development Path Energy Use by Sector
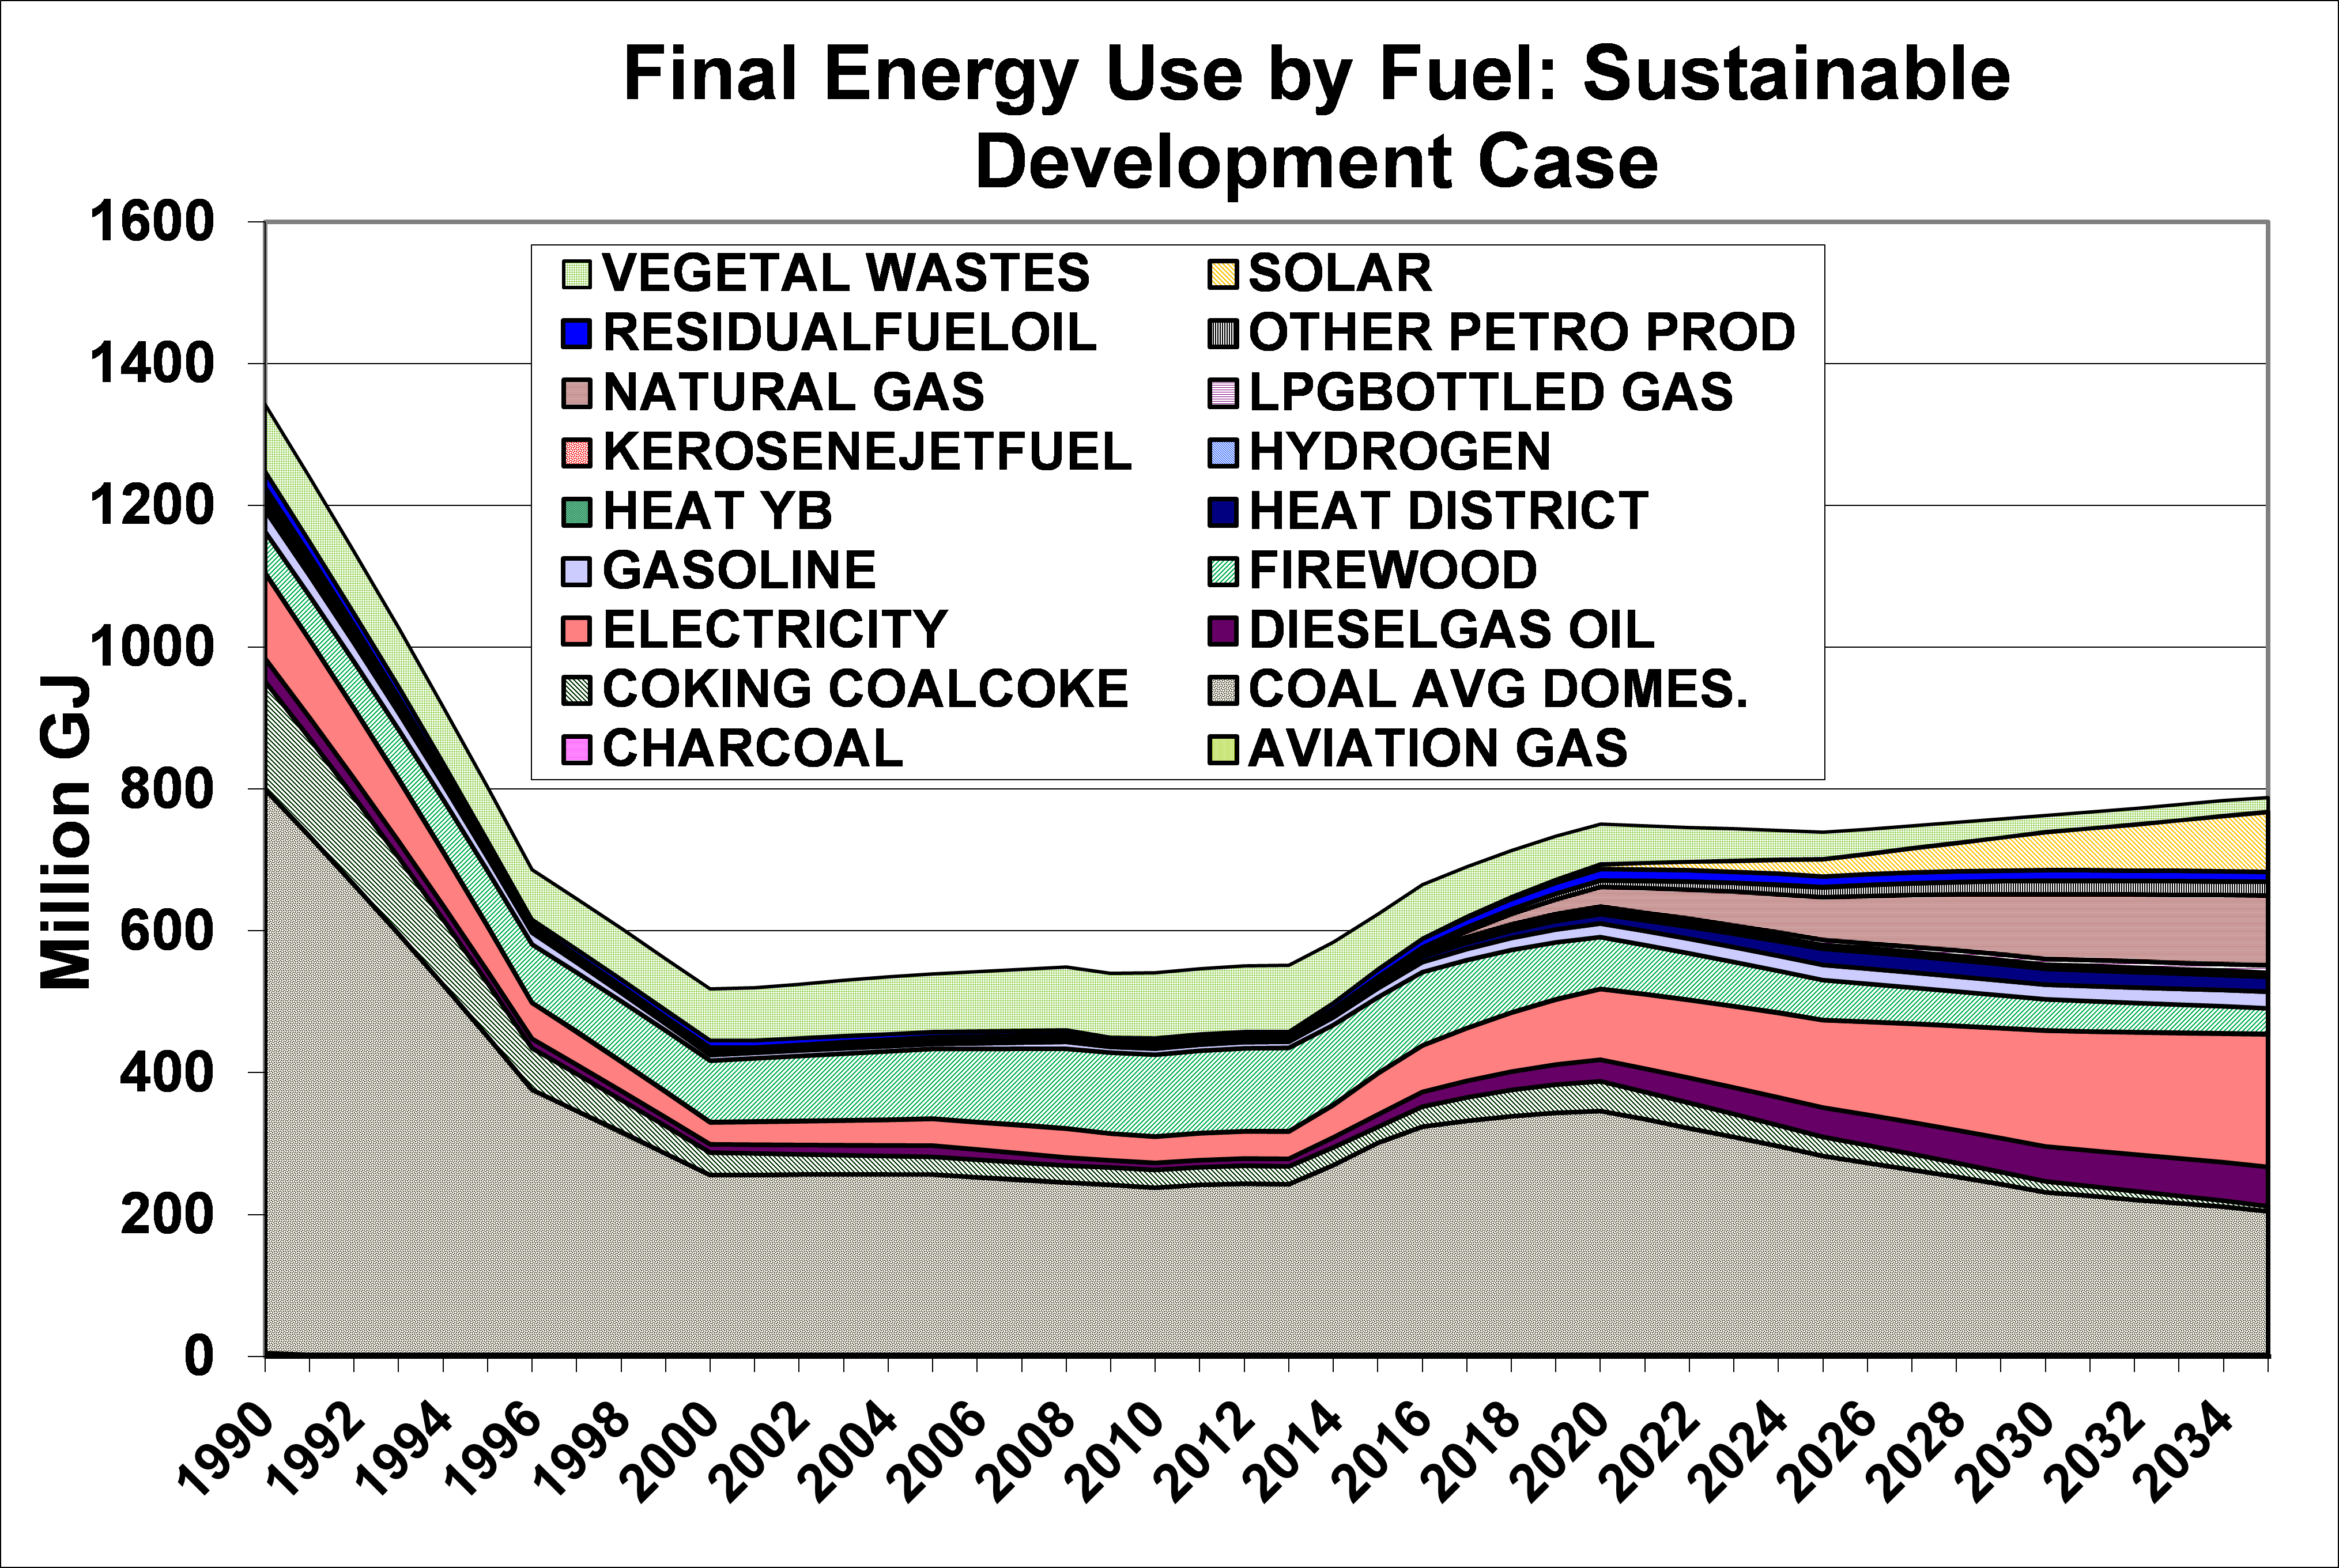
Figure 11: Sustainable Development Path Energy Use by Fuel
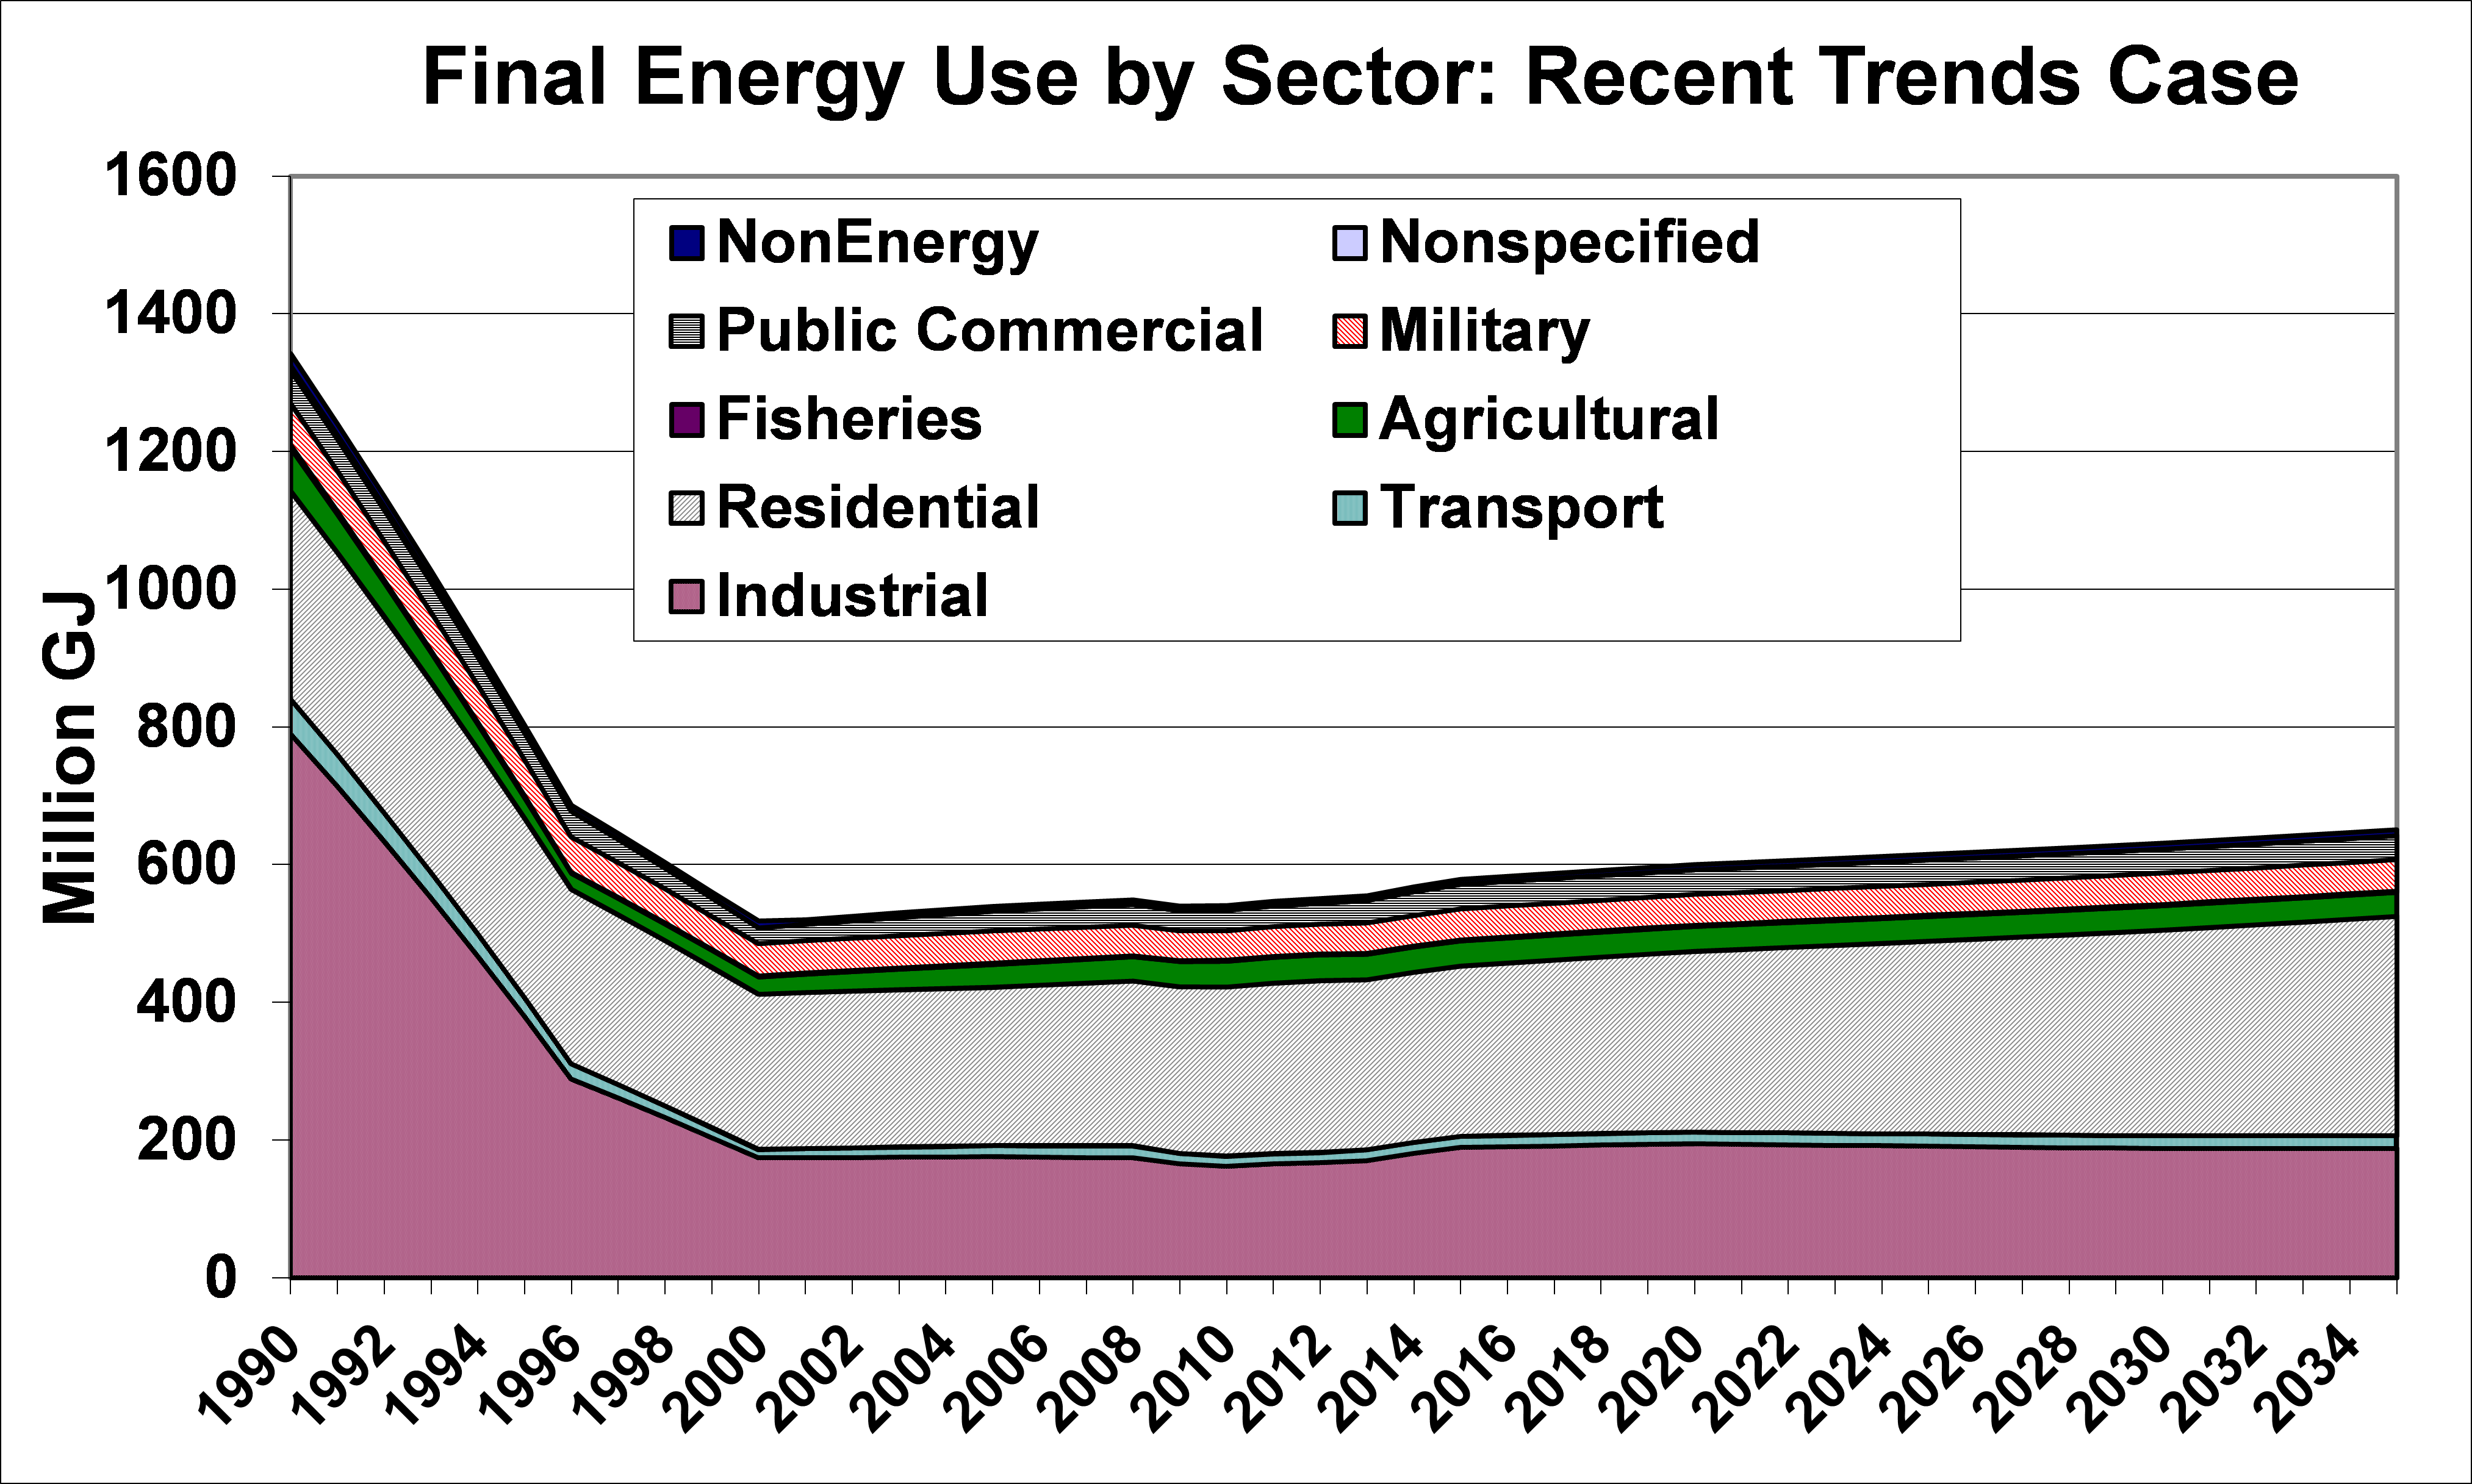
Figure 12: Energy Use by Sector, Recent Trends Path
Figures 13 and 14 provide summaries of the patterns of electricity generation capacity over time for the Sustainable Development and Regional Alternative paths. The Sustainable Development path provides a more diverse set of generation resources, by 2035, than the Redevelopment path, and despite including more renewable generation (wind and solar) that feature, by their nature, lower capacity factors than conventional generation, the overall requirement for capacity is nearly 3000 MW less, by 2035, then in the Redevelopment path, as a consequence of enhanced demand-side efficiency. The Sustainable Development path also features a more rapid phase-out of existing coal-fired power plants. The Regional Alternative path shows a similar pattern to the Sustainable Development path, but also includes power from a tie-line to the Russian Far East, though much of the power transmitted through that line would be destined for the ROK, not North Korean, grid. 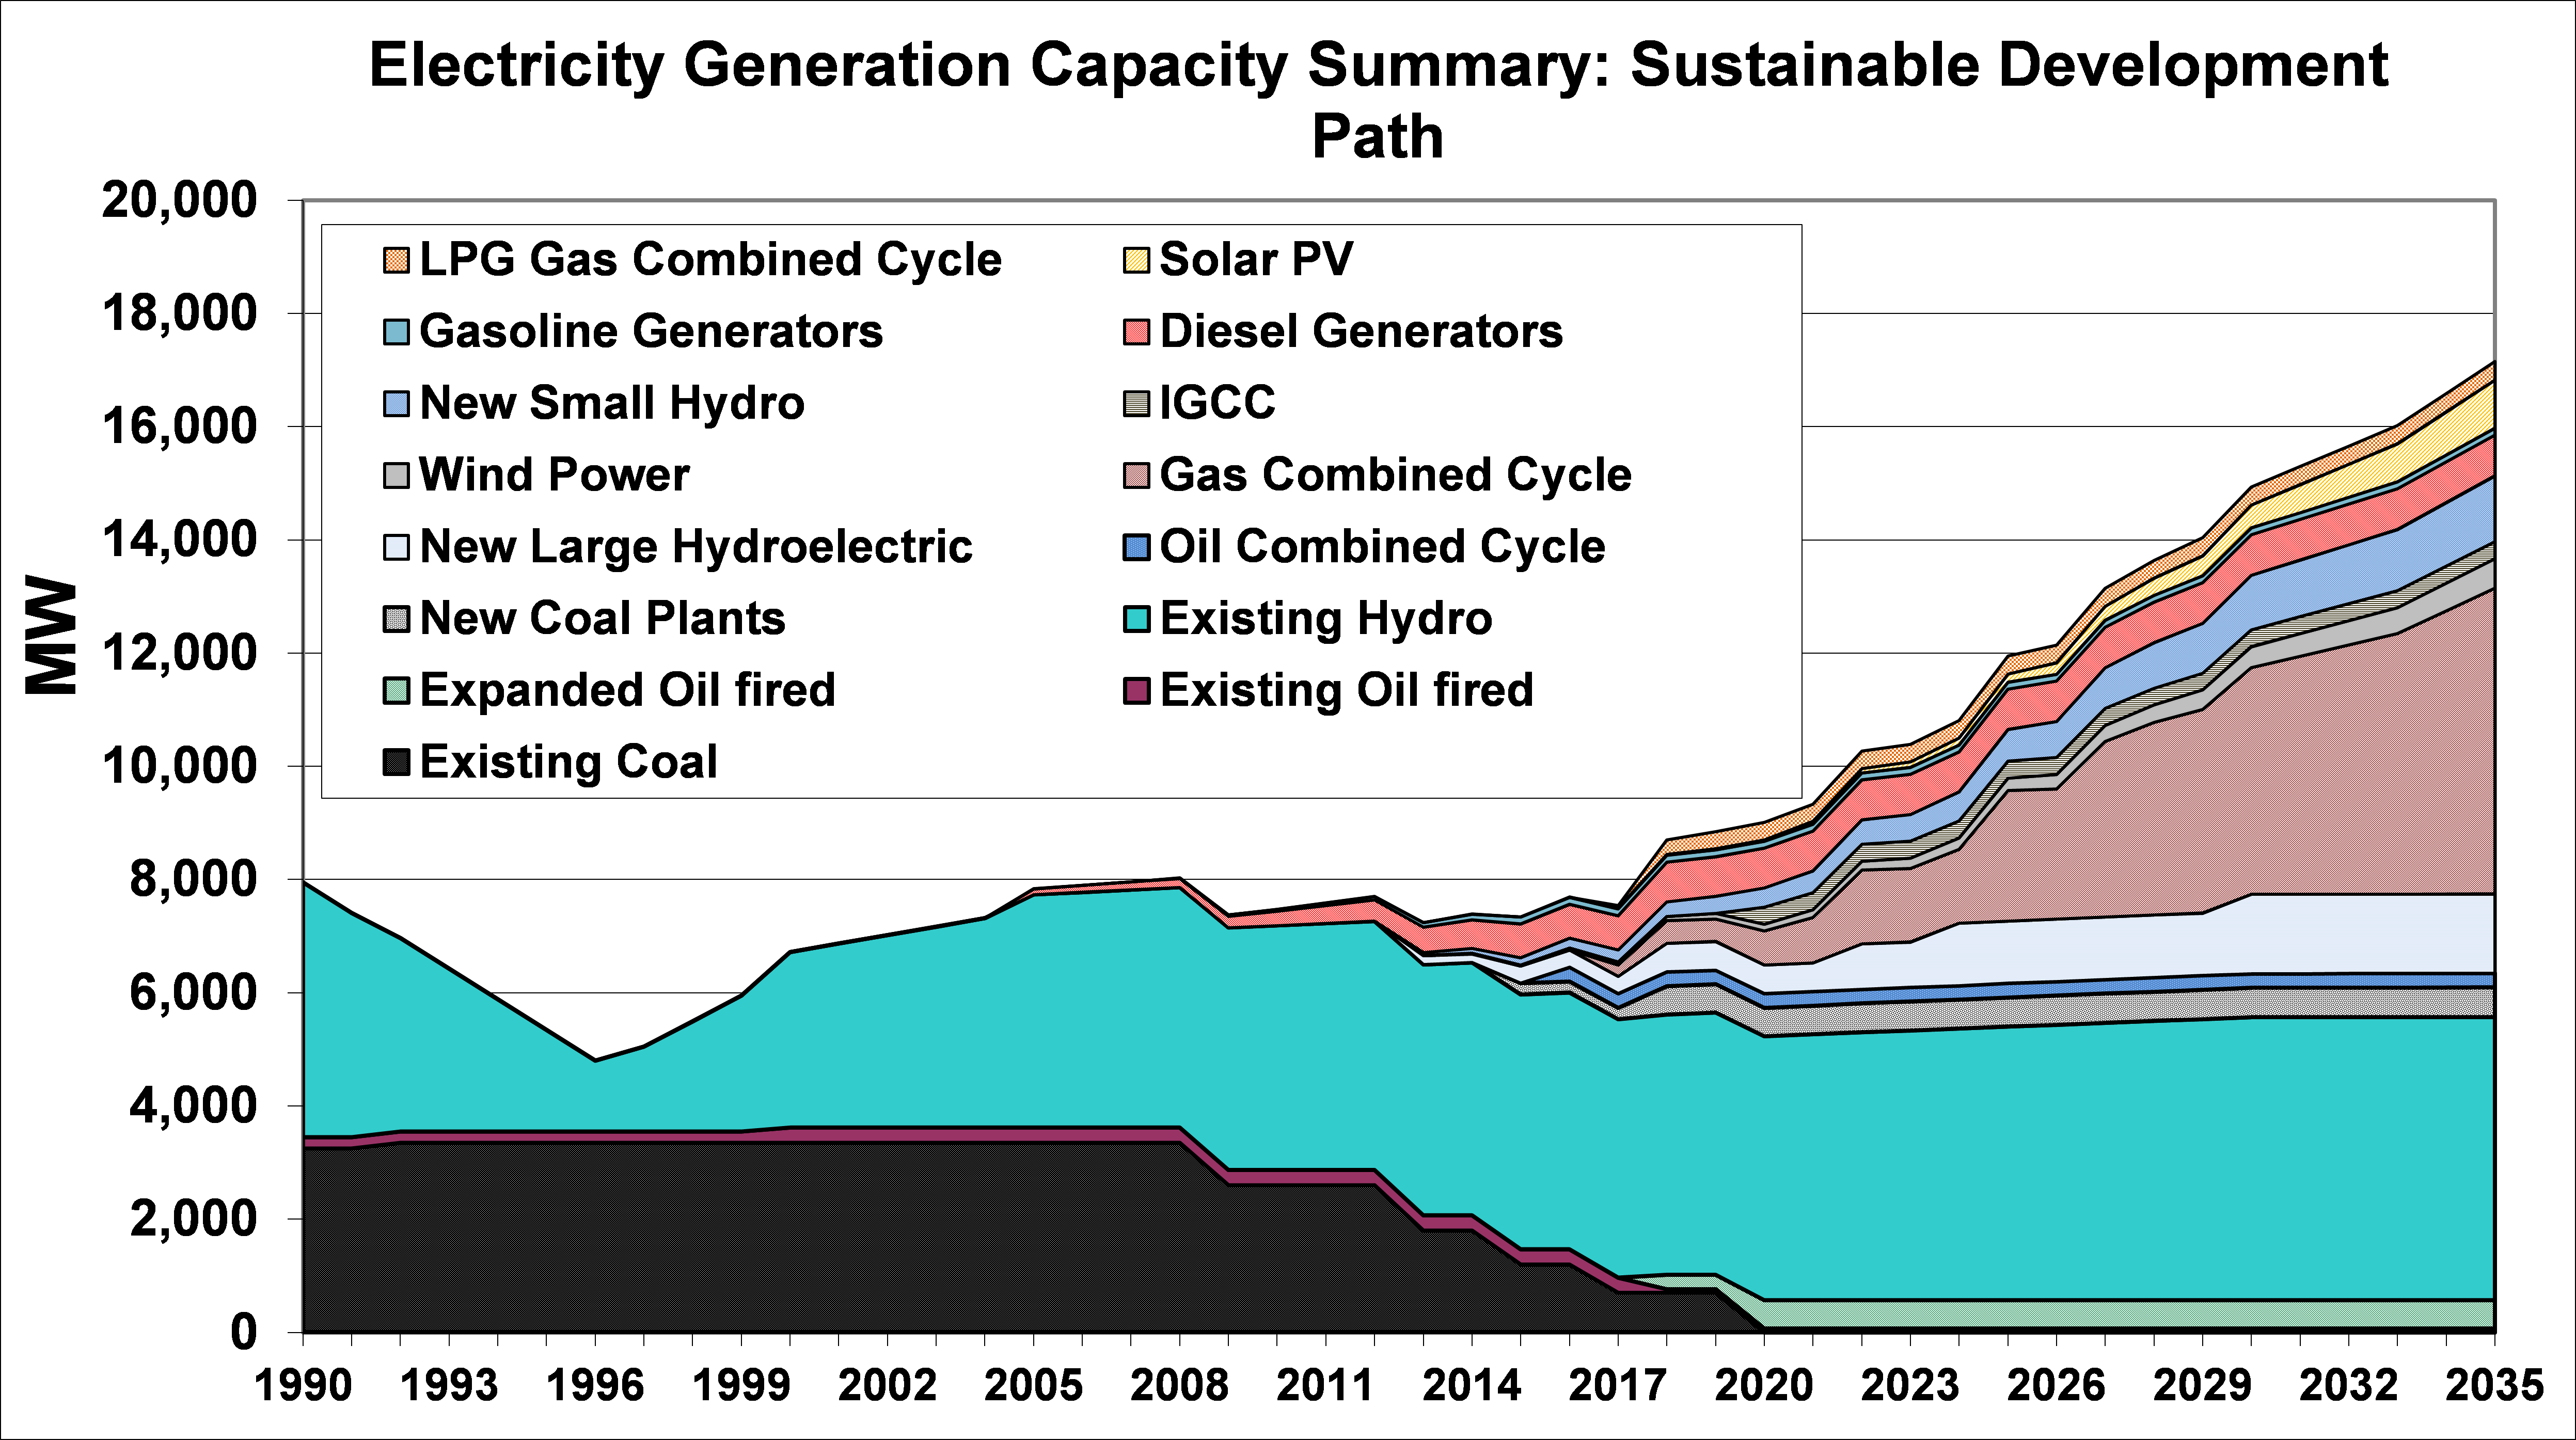
Figure 13: Trends in Electricity Generation Capacity Expansion, Sustainable Development Path
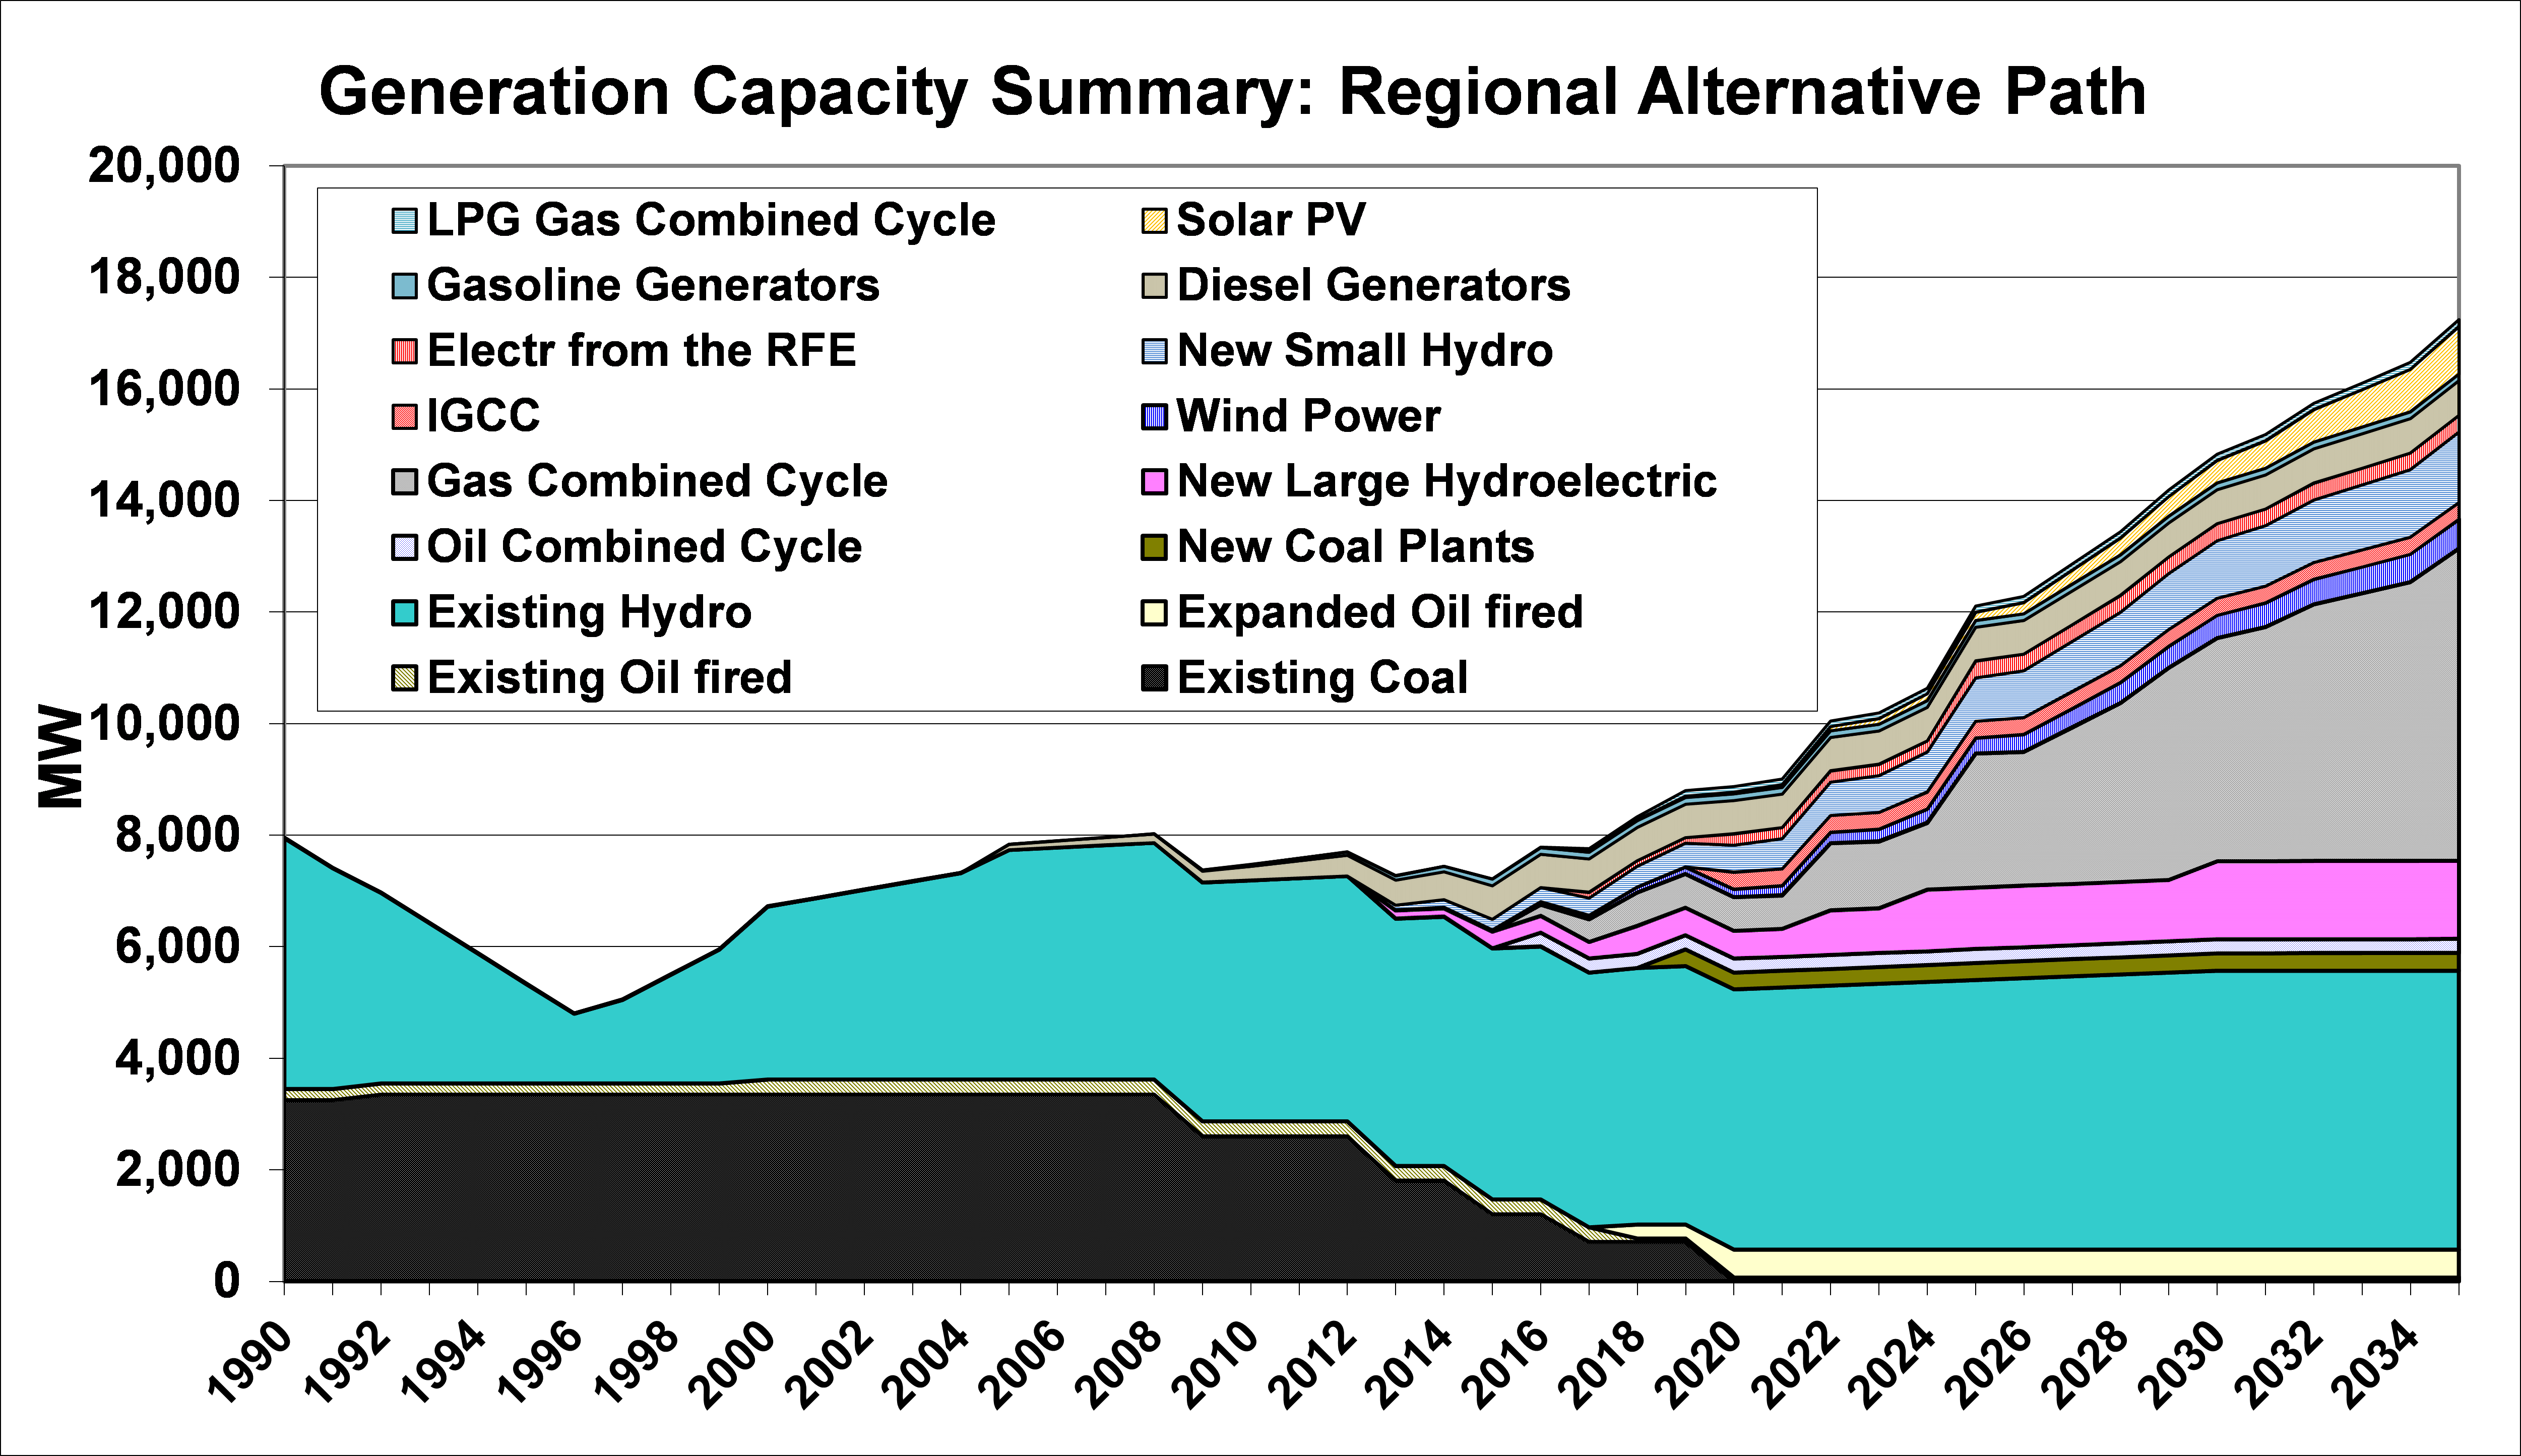
Figure 14: Trends in Electricity Generation Capacity Expansion, Regional Alternative Path
Figure 15 compares electricity use over time in the three main paths evaluated, as well as in the “Recent Trends” path[48]. Note that as a result of the aggressive implementation of energy efficiency measures, as noted above, the consumption of electricity (and thus the need for power generation facilities) is much less, by 2035, in the Sustainable Development and Regional Alternative paths, relative to the Redevelopment path. This difference is significant in terms of avoided costs of generation capacity and of fuels for generation, as noted below. 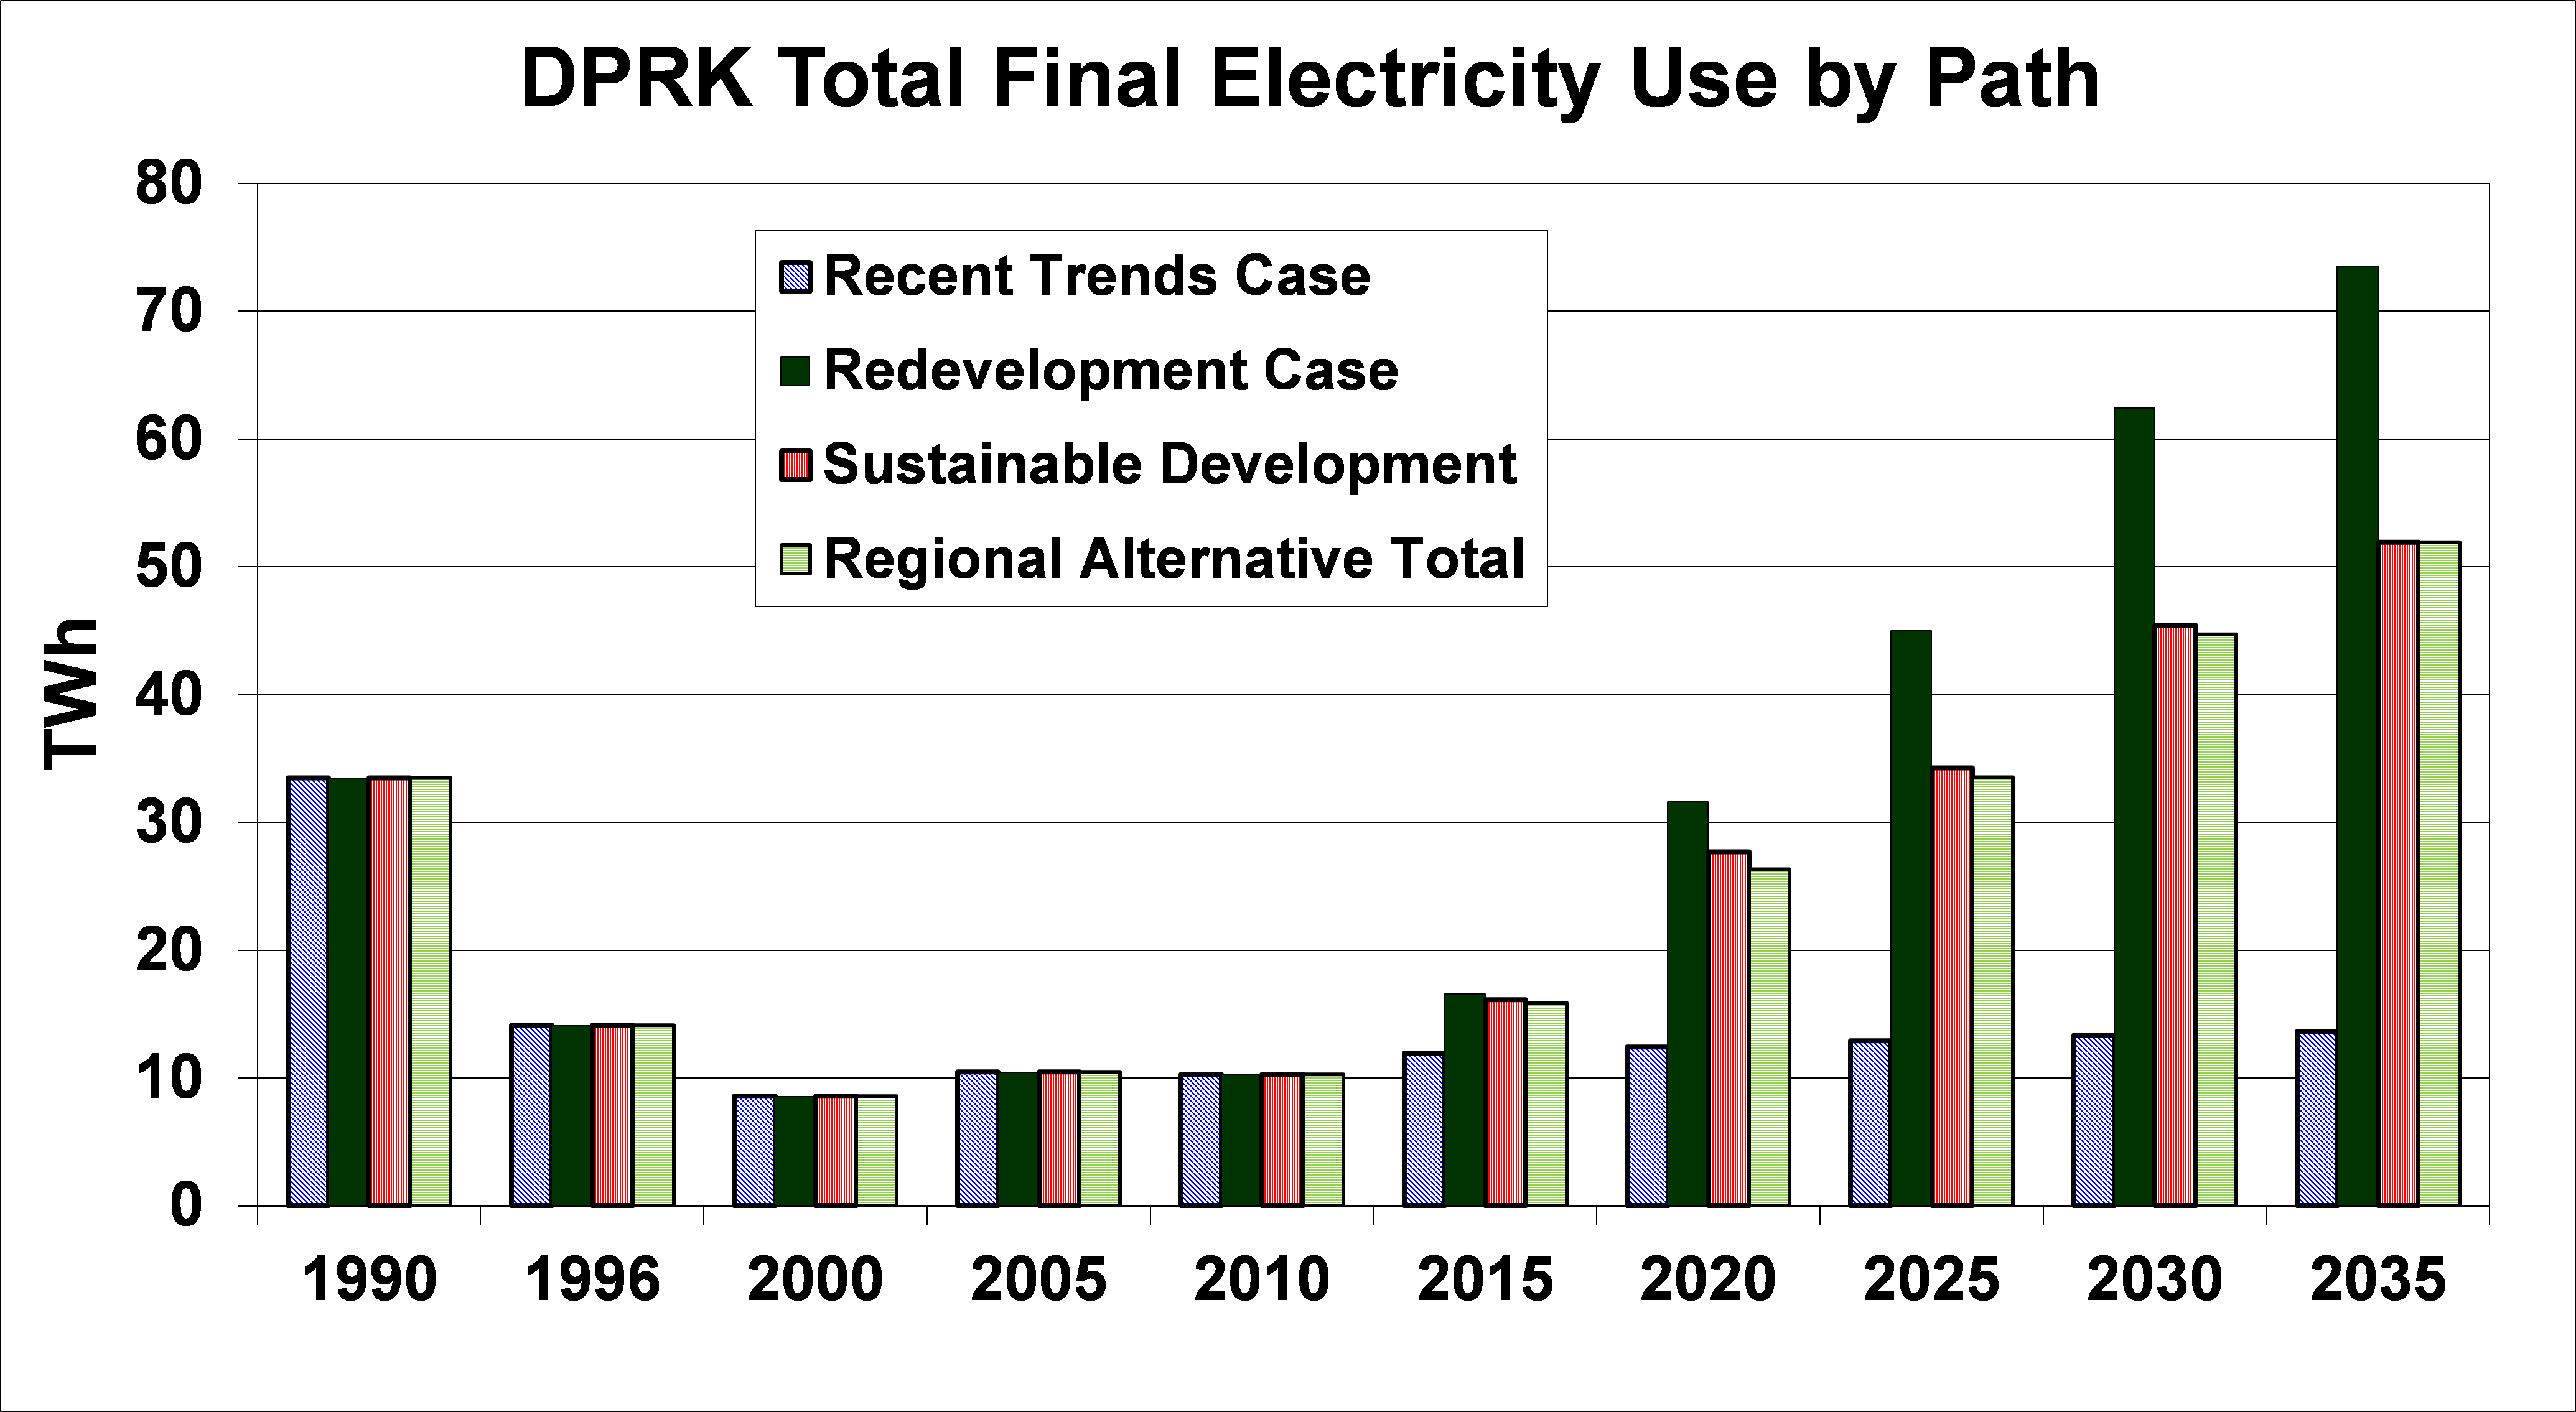
Figure 15: Final Electricity Use Comparison between Paths
The result of aggressive energy efficiency and renewable energy implementation in the Sustainable Development and Regional Alternative Paths is that air pollutant emissions (including carbon dioxide and other greenhouse gases, as shown in Figure 16) are much lower in those paths by 2035. Though costs on the demand side (for higher-efficiency equipment) are considerably higher than in the Sustainable Development path than in the Redevelopment path, offsetting savings in the transformation sector (mostly due to the reduced need for electricity generation capacity) and slightly higher costs in resources (the net of avoided fuel production and imports and use of higher-cost, cleaner fuels such as gas) mean that the Sustainable Development path is less expensive than the Redevelopment path, overall, even before any credits are taken for avoided environmental impacts, as shown in Figure 17. The Regional Alternative path, with somewhat lower costs for demand- and supply-side devices, and greater benefits for the DPRK of selling on natural gas from LNG or Russia that is re-exported to the ROK, offers even greater net benefits over the 2013-2035 time frame. 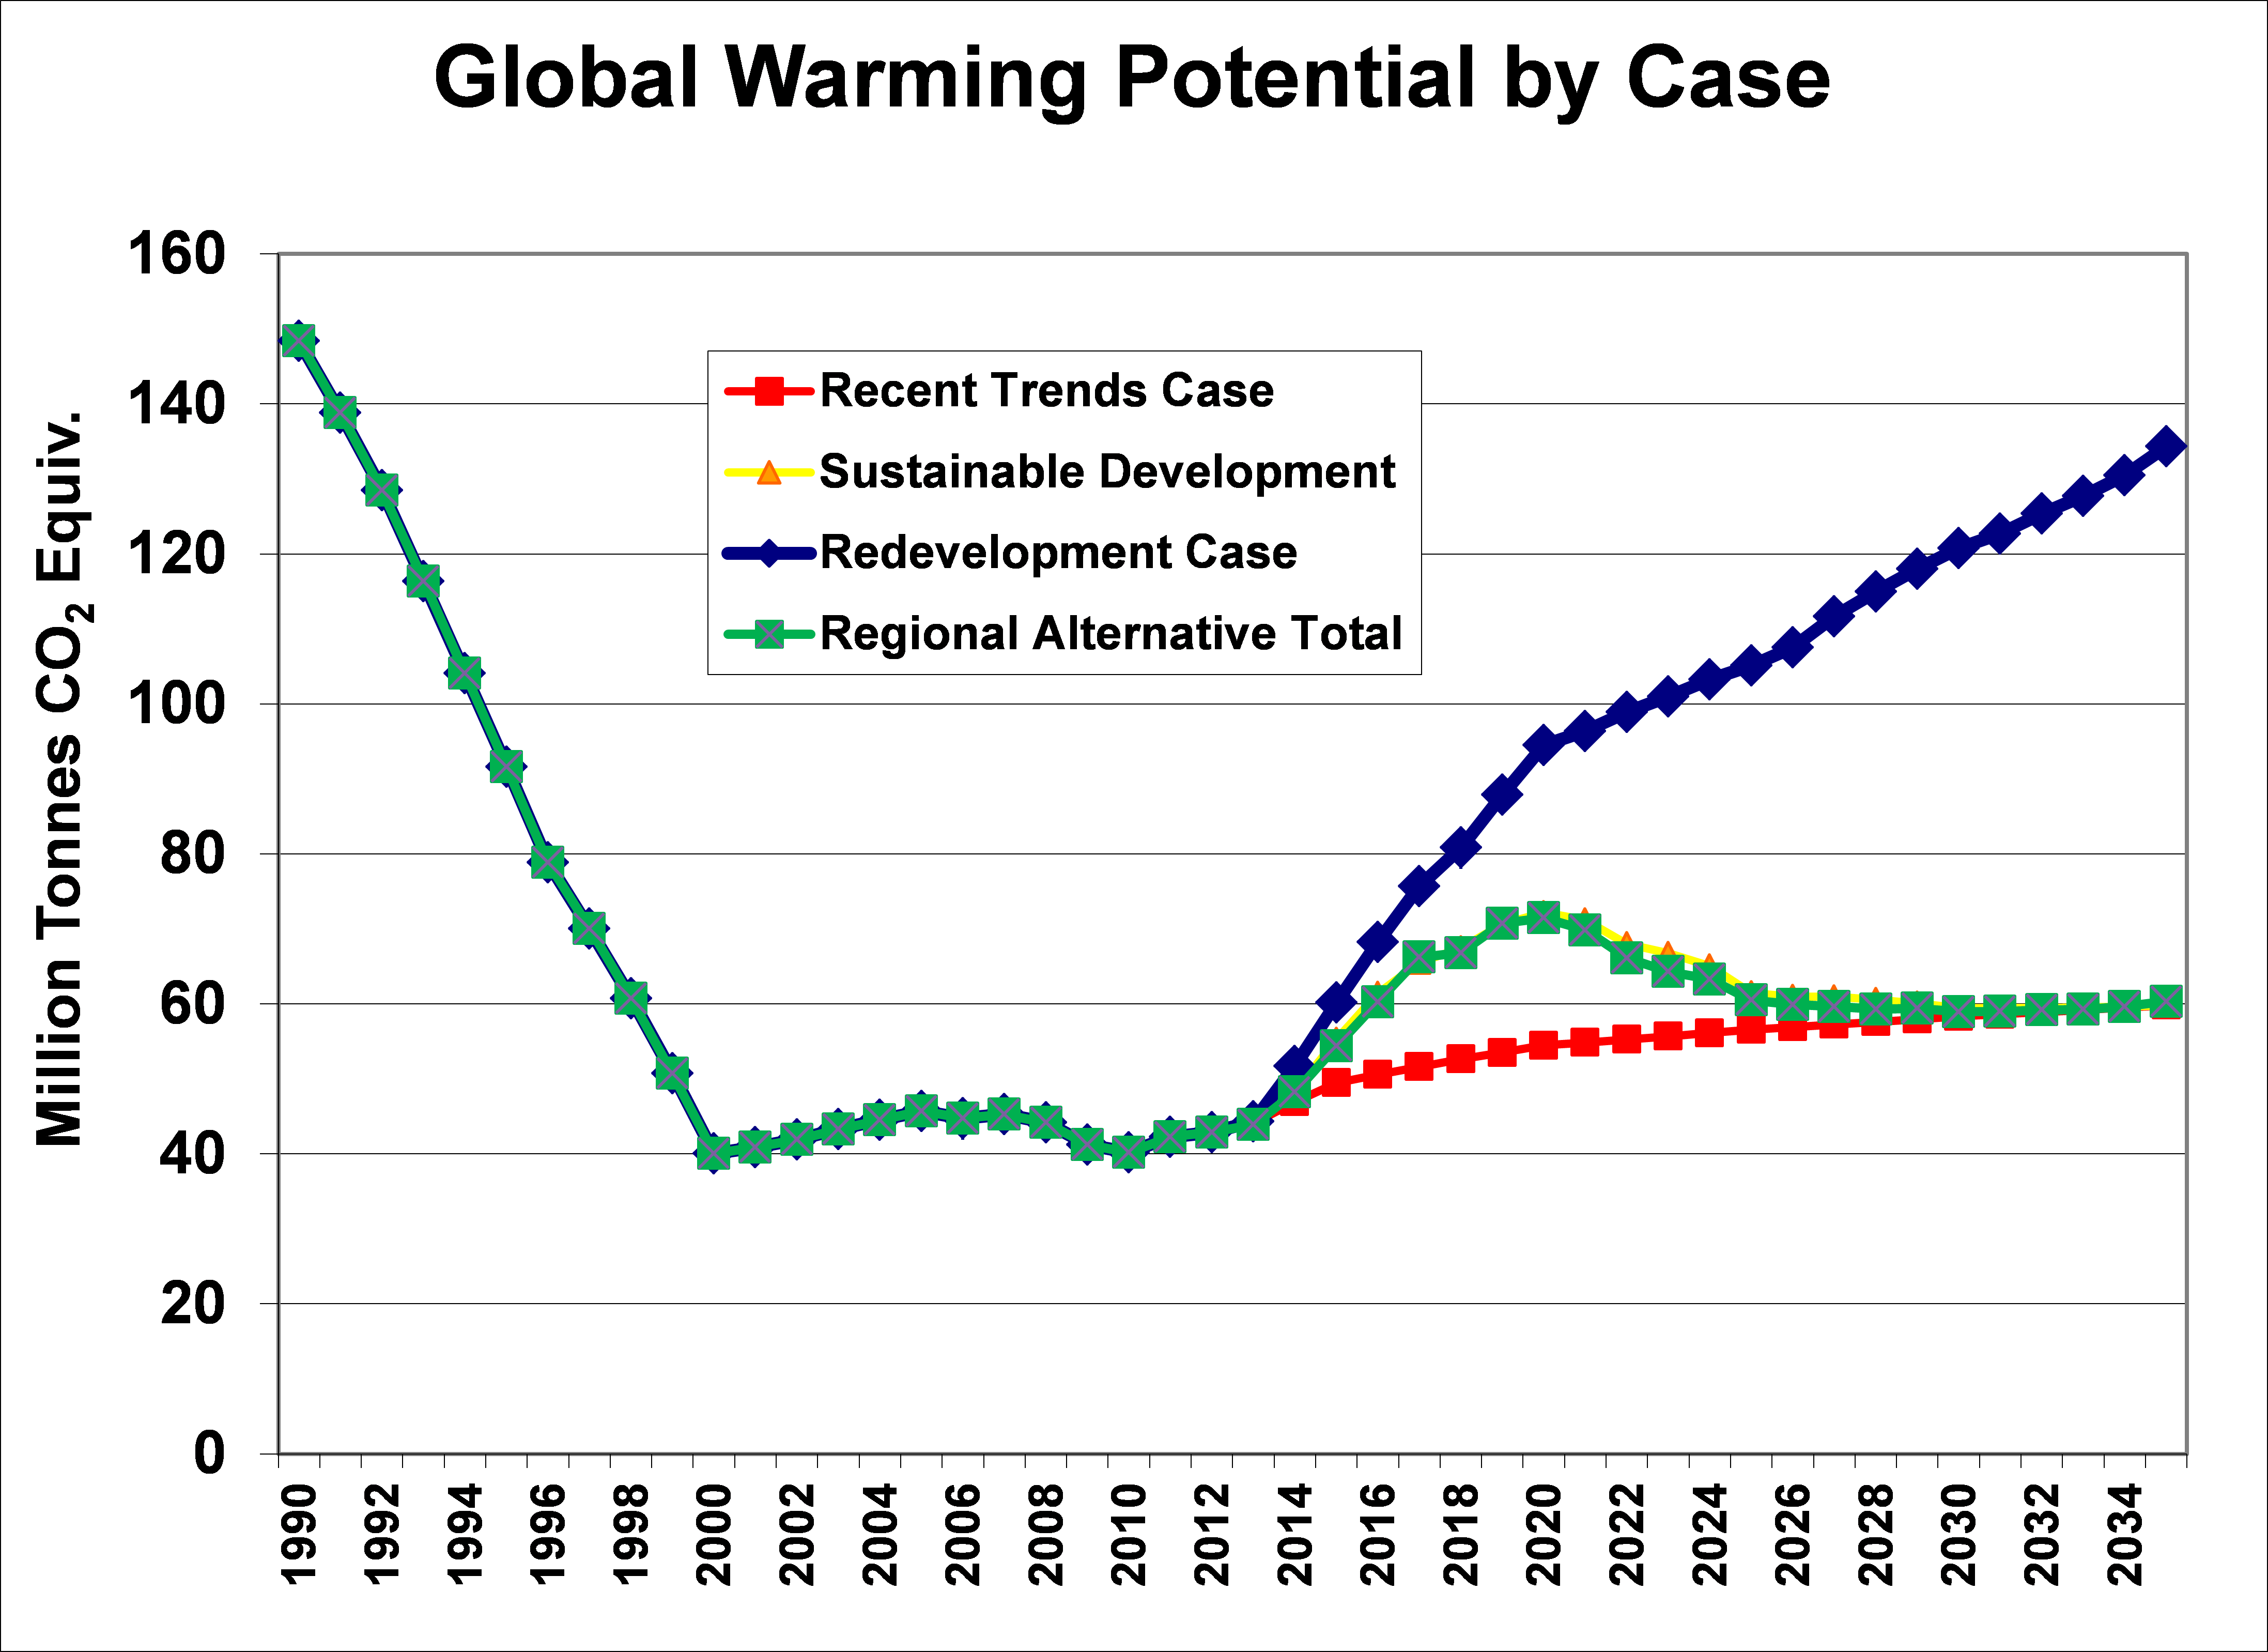
Figure 16[49]: Greenhouse Gas Emissions Comparison by Path
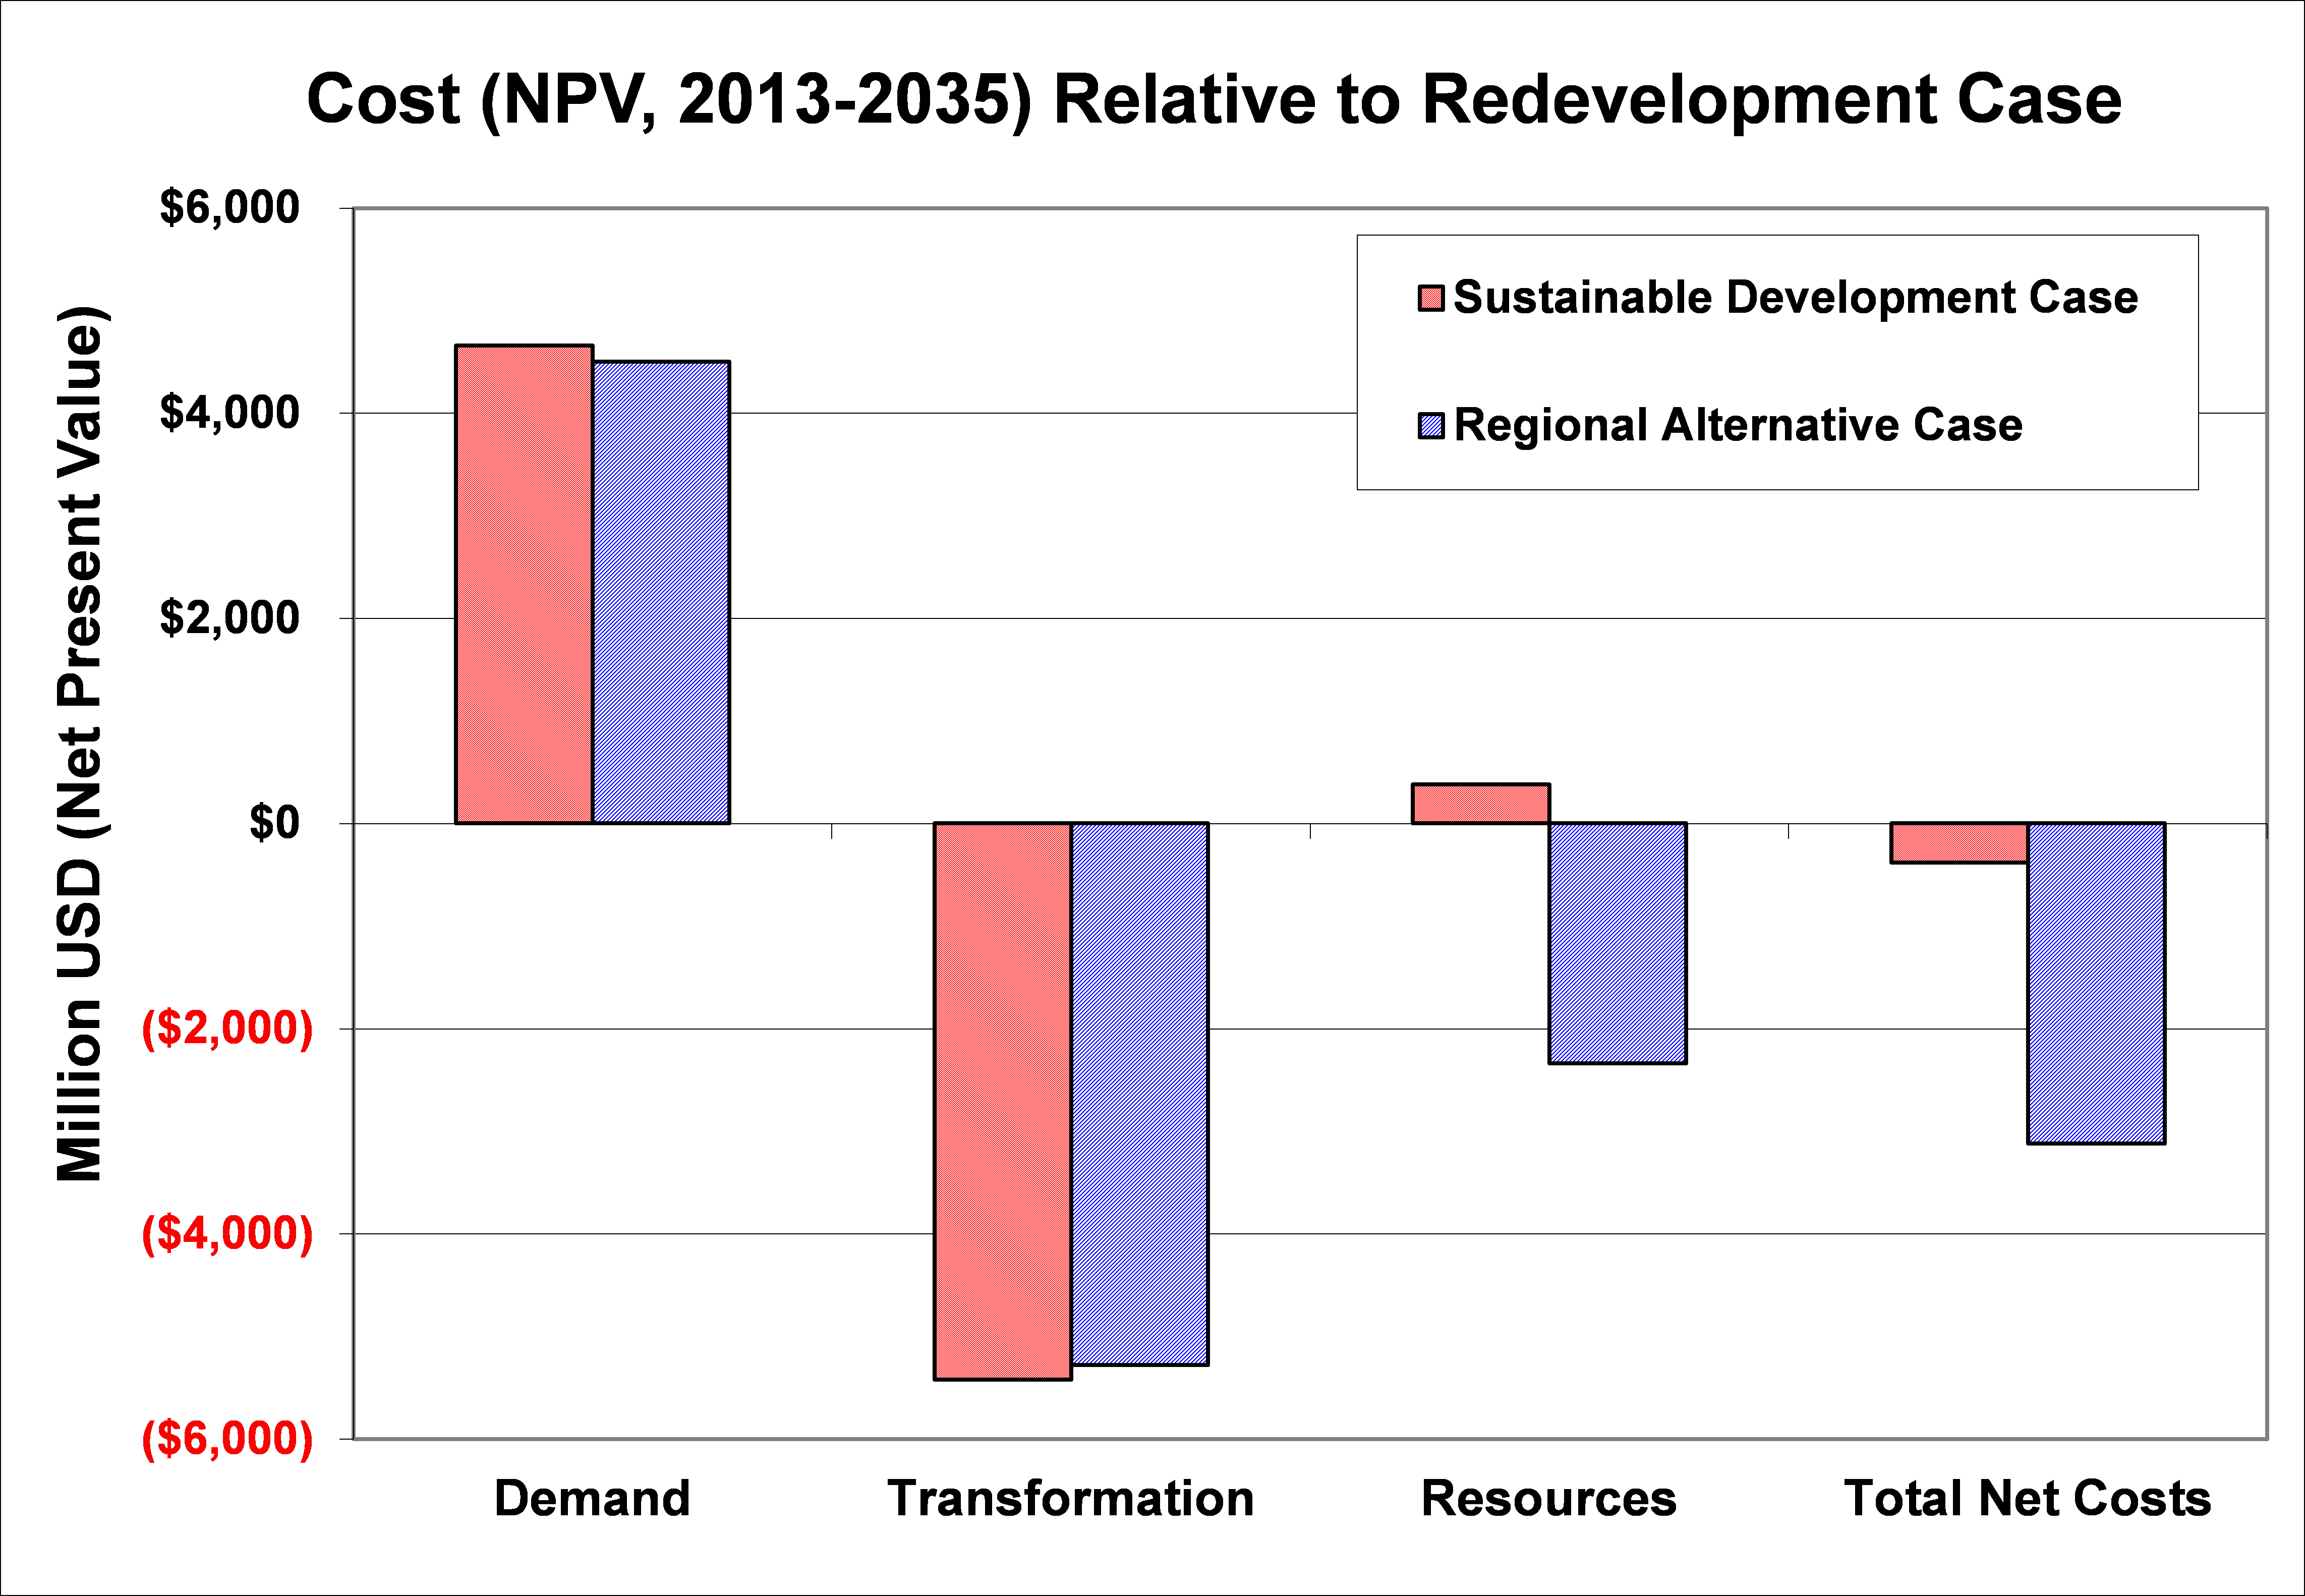
Figure 17: Relative Cost of Sustainable Development and Regional Alternative Paths as Compared with the Redevelopment Path
5 Energy Security Comparison of Future DPRK Paths
Three of the paths described as above—the Redevelopment path, the Sustainable Development path, and the Regional Alternative path—offer roughly the same energy services and economic development for the DPRK populace, and thus can reasonably be compared in terms of their energy security attributes. Below we apply the framework sketched out in section 2 of this paper to weigh the relative benefits and costs of the three paths. Before doing so, however, consideration must be given to the perspective from which the comparison is made. Looking at even the broad suite of energy security attributes in our framework from the perspective of the DPRK’s leadership (assumed, for the sake of this analysis, to be a continuation of the Kim regime), may yield quite different results from those prepared from the perspective of the international community. In considering the perspective of the DPRK’s leadership, we acknowledge that there are, in fact, a number of different factions within the DPRK with different points of view, aspirations, and goals[50]. And further, indeed, the “international community can hardly be considered a monolithic bloc, though the agendas of the DPRK’s neighbors and others, notably the United States, are arguably better aligned with each other than with the DPRK, at least where interactions with the DPRK are concerned. As such, in the remainder of this section we evaluate the merits of the Sustainable Development and Regional Alternative paths relative to the Redevelopment path with regard to each of the six energy security dimensions included in our framework, attempting to take the perspectives of A) the DPRK’s leadership, and B) the international community, meaning the DPRK’s neighbors and their allies.
5.1 Energy Supply Dimension
The Sustainable Development (SDV) and Regional Alternative (RALT) paths offer, by 2035, lower annual energy demand, primary energy use, and imports, and more diversity by fuel type, than in the Redevelopment (RDV) path (see Table 3). Although our paths evaluation does not explicitly track the geographic source of all fuel imports to the DPRK, thus rendering impossible the quantitative calculation of a diversification index by supplier, it is virtually certain that the SDV path and, particularly the RALT path would show a more diversified portfolio of energy suppliers than the RDV path, in which energy supplies from China would likely continue to dominate, though the fraction of the DPRK’s energy imports from China seems likely to decline over time (as overall energy use expands). We do not explicitly track stocks of fuels in the energy paths, as it is difficult to know the full extent of the DPRK’s stocks (particularly of oil products) to begin with, but it seems likely that the SDV and RALT scenarios, with their greater diversity of fuel types and infrastructure, will offer a higher ratio of stored fuel to imports than the RDV scenario. Table 3: Energy Supply (and Demand) Dimension of Energy Security Comparison of DPRK Paths
| Energy Supply Dimension Measure/Attribute | Annual 2035 Values Relative to RDV | Implications of Values Relative to RDV from the Perspective of: | ||
| SDV Path | RALT Path | DPRK Leadership | International Community | |
| Total Energy Demand | -330 PJ | -335 PJ | Lower = better | Lower = better (but indirectly) |
| Primary Energy Use | -620 PJ | -620 PJ | Lower = better | Lower = better (but indirectly) |
| Fraction of Primary Energy as Imports (net of Exports) | 32.5% (RDV 13.7%) | 34.0% (RDV 13.7%) | Higher = Worse (more exposure to cost risk) | Mixed (Lower has better overall implications, but higher offers leverage) |
| Diversification Index (by fuel category, primary energy) | 0.22 (SDV 0.45) | 0.22 (SDV 0.45) | Lower = better | Indifferent, except with regard to indirect impacts |
| Diversification Index (by supplier, key fuel types) | Lower | Lower (and lower than SDV) | Lower = better | Mixed (Lower spreads risk among nations, , but higher offers more leverage) |
| Stocks as a fraction of imports (key fuels) | Likely Higher | Likely Higher (and higher than SDV) | Higher = better | Mixed (higher improves regional situation, but provides less leverage in the event of conflict) |
From the perspective of the DPRK’s leadership, lower energy primary and final energy demand, and particularly lower electricity and petroleum products demand, would seem preferable, as leadership would see less of a burden of supplying fuels to the DPRK economy. Lower diversification indices (indicating more diversity of supply) would also likely be preferable to the DPRK’s leadership, as North Korea’s dependence on any individual fuel or supplier, and thus the influence that any given supplier or country might have over the DPRK, would be attenuated. From the perspective of the international community as a whole, higher or lower DPRK energy demand is probably not of great concern in and of itself directly, though lower energy use implies lower environmental impacts, including impacts that cross national boundaries. The major exception here is likely to be the ROK. If one presumes that one day the Koreas will again be united, either officially or de facto, it will be much easier for the ROK to integrate into its economy a DPRK that has a modern, efficiency energy supply and demand infrastructure than one that features a haphazard mix of new, older, and derelict equipment. For the international community, a DPRK that uses more different fuels and suppliers both spreads any risk of conflict over energy trades with the DPRK over more nations—which would likely be considered a good thing—but on the other hand would make it harder for the international community to reach consensus on actions restricting energy trade should the DPRK fail to follow up on commitments related to its nuclear weapons program. In addition, the interconnected energy infrastructure elements of the RALT path would improve the energy supply diversity, and thus perceived energy supply security of neighboring individual countries, probably most notably the ROK.
5.2 Economic Dimension
As a result of the emphasis on end-use efficiency and renewable energy, the SDV and RALT paths offer significantly lower total energy system costs, lower fuel costs overall, and lower imported fuel cost (net of the value of fuel exported) than in the RDV path (see Table 4). It is likely that the DPRK leadership would see these lower costs as beneficial, as more hard currency could be used for other priorities. From the perspective of the international community, the implications of these lower costs are likely to be mixed, but modest. For example, lower fuel costs might enhance the competitiveness of the DPRK in certain industries (though other barriers to DPRK competitiveness are likely much higher), resulting in (marginally) increased competition for some industries in some nations, while on the other hand lower fuel consumption, particularly of traded fuels, could lower regional prices of some energy products, though this effect would be tiny due to the DPRK’s small market relative to other nations in the region. Table 4: Economic Dimension of Energy Security Comparison of DPRK Paths
| Economic Dimension Measure/Attribute | Present Value 2013 through 2035 Relative to RDV | Implications of Values Relative to RDV from the Perspective of: | ||
| SDV Path | RALT Path | DPRK Leadership | International Community | |
| Total Net Energy System Internal Costs | -$0.4 B | -$3.1 B | Lower = better | Indifferent (except in how differences in DPRK expenditures for specific goods are affected) |
| Total Net Resource Costs | +$0.4 B | -$2.3 B | Lower = better | Largely indifferent (Reduced DPRK demand likely to have a negligible impact on regional prices) |
| Import Fuel Costs | Higher | Higher | Lower = better | |
| Economic and Employment Impact of Fuel Price Increase | Additional diversity in fuel types and sources helps insulate economy from increases in prices of individual fuels | Lower = better | Improvement in DPRK economic stability in the face of price increases would likely be seen as a positive | |
| Economic and Employment Impact of difference between paths | Mixed, e.g. coal mining lower, high-tech higher. In RALT, construction higher (pipelines, powerlines) | Mixed: implications depend on political power of individual groups affected | Probably positive, in that SDV and RALT paths will being more North Koreans in contact with foreigners than RDV path | |
Reduced fuels demand, and thus costs, in the SDV and RALT paths, together with a greater diversity of energy sources in those paths, would likely render the DPRK economy less sensitive to price increases for individual fuels, which would be seen as a benefit by the DPRK leadership, and also, though indirectly seen as a benefit by the international community, which would prefer to see a more economically resilient DPRK. The SDV and RALT paths shift outputs between some DPRK industrial sectors, relative to the RDV path. For example, coal production would be decreased, and the use of renewable fuels increased. The degree to which these changes would be perceived as positive by the DPRK leadership would depend upon which industries are more influential with DPRK leadership. The international community would probably see the shifts in economic emphasis under the SDV and RALT plans as a positive, as both, and particularly the RALT plan, offer more opportunities for teachers, engineers, technicians, and officials from outside the DPRK to engage with DPRK actors.
5.3 Technological Dimension
Table 5 provides our assessment of the relative merits of the SDV and RALT paths from a technological risk point of view. In general, the SDV and RALT provide greater diversity in terms of new technologies used (though this difference is not reflected in the index in Table 5, which does not distinguish between new and older technologies), which would probably be seen as a benefit by DPRK leadership, but also offer some exposure to technologies with which the DPRK is not familiar. From the perspective of the international community, the DPRK’s technological choices per se are probably not a large issue in a direct sense, though they may be of concern for other reasons, such as environmental risk or risk of nuclear weapons proliferation. The SDV path, with its greater diversity of technologies, is likely to improve the DPRK’s adaptability to climate change risk or other stresses, though the addition of large regional infrastructure in the RALT case might arguably reduce the DPRK’s ability to adapt to conditions favoring different energy technologies. Table 5: Technological Dimension of Energy Security Comparison of DPRK Paths
| Technological Dimension Measure/Attribute | Value Relative to RDV | Implications of Values Relative to RDV from the Perspective of: | ||
| SDV Path | RALT Path | DPRK Leadership | International Community | |
| Diversification Indices for Electricity Generation Industry (as of 2035) | 0.20 (RDV 0.20) | 0.21 (RDV 0.20) | Higher = better due to demonstrated national capability in more technologies | Higher = generally preferred as developing DPRK markets for newer technologies |
| Diversity of R&D Spending | Higher in these paths than in RDV | Higher likely to be seen as better by leadership in most cases | Diversified DPRK R&D probably would be welcomed, particularly if it diverted funds from nuclear R&D | |
| Reliance on Proven Technologies | Lower in these paths than in RDV | Lower might be seen as higher risk by DPRK leadership | Probably not a large issue for international community, as “new” technologies will not seem unproven outside the DPRK | |
| Technological Adaptability | Likely higher in SDV path than in RDV path, though arguably somewhat lower in RALT than SDV due to inclusion of large infrastructure | Higher likely to be seen as better, though adaptability in the face of threats from other nations is likely to be considered as well as adaptability to environmental and other stresses | Improvement in DPRK resilience would likely be seen as a positive | |
5.4 Environmental Dimension
The Sustainable Development (SDV) and Regional Alternative (RALT) paths have much lower attendant annual emissions of greenhouse gases, acid gases, and “criteria” air pollutants (including sulfur and nitrogen oxides and particulate matter) in 2035 than does the Redevelopment (RDV) path (see Table 6). Other air and water pollutants would likely be reduced as well. The variants of the SDV and RALT paths without nuclear power would have less generation of nuclear waste and spent fuel than the RDV path, in which the DPRK pursues its domestic reactor program. For the variants that include large nuclear power units, generation of spent fuel and nuclear wastes would be much higher, but it is presumed that a precondition of construction (done mostly by organizations from outside the DPRK) and operation of new, large, modern LWRs would be an agreement as to stringent monitoring and handling of spent fuel. Table 6: Environmental Dimension of Energy Security Comparison of DPRK Paths
| Environmental Measure/Attribute | Annual 2035 Values Relative to RDV | Implications of Values Relative to RDV from the Perspective of: | ||
| SDV Path | RALT Path | DPRK Leadership | International Community | |
| GHGemissions (tonnes CO2 equiv.) (RDV 134 Mte) | 60 Mte | 60 Mte | Lower = better (national image, CDM opportunities) | Lower = better |
| Acid gas emissions (ktonnes) (RDV 604 kte SOx, 569 kte NOx) | 244 kte SOx, 213 kte NOx | 241 kte SOx, 204 kte NOx | Lower = better (local impacts, national image) | Lower = better |
| Local Air Pollutants (tonnes) | Lower | Lower | Lower = better | Lower = better (but not a major concern) |
| Other air and water pollutants (including marine oil pollution) | Lower | Lower | Lower = better | Lower = better (primarily for neighbors) |
| Solid Wastes (tonnes coal ash) | Lower | Lower | Lower = better | Lower = better (but not a major concern) |
| Nuclear waste/spent fuel generation (tonnes or Curies, by type) | Lower (except Simpo completion variants) | Lower (except Simpo completion variants) | Mixed (less waste to manage, but less potential fissile material in the event of a breakdown in rapprochement) | Lower = better (Simpo completion variants would presumably include stringent IAEA management of spent fuel) |
From the perspective of the DPRK leadership the reduction in greenhouse gas emissions is likely to be seen as an enhancement in the DPRK’s international stature, as well as an opportunity for profiting by implementing greenhouse gas reduction measures under the clean development mechanisms (CDM) provision of the Kyoto Protocol. Though they might be less of concern to the DPRK leadership than in other nations, reductions in acid gas and local air and water pollutants, and their attendant impacts, would likely be seen in a favorable light. Though the variants of the SDV and RALT paths without large new nuclear plants would generate less nuclear waste and spent fuel than the RDV path, that might be seen by the DPRK leadership as both good (less waste to dispose of) and bad (less potential fissile material, in case bets on continued improvements in relations with the international community need to be hedged). From the perspective of the international community, the reduced greenhouse gas and acid gas emissions in the SDV and RALT paths would be seen as a positive, as would other emissions reductions, though the local nature of those reductions might make them less of a concern, except, for example, for the neighbors (the ROK, China, and Russia) that share waterways and other environmental resources with the DPRK. The reduction in nuclear waste/spent fuel production between the RDV and the SDV/RALT paths would be seen as a significant positive by the international community.
5.5 Social and Cultural Dimension
From the perspective of the DPRK’s leadership, the SDR path, which implies significantly greater interaction between a wide range of DPRK citizens and an equally wide range of actors from outside the DPRK, would likely be seen as substantially riskier than the RDV path, though even the RDV path involves significant interaction with the outside world, albeit in perhaps a less-planned way. The DPRK’s leadership would probably see those interactions as threatening because they would further weaken leadership’s ability to control the flow of information and ideas, exacerbating the potential for internal conflict. The addition of the requirement to work jointly with foreigners to manage international infrastructure in the RALT path probably, from the perspective of DPRK leadership, adds to that risk. The international community, on the other hand, would see shifts from the RDV to the SDR and, especially, the RALT path as a positive for an almost opposite set of reasons—namely that exposure of DPRK citizens to ideas and people from outside the DPRK would reduce the risk of conflict between the DPRK populace and foreigners by increasing the understanding that DPRK citizens have for the outside world. The view of the shift from the RDV path to the other paths as being advantageous will likely be shared by most other nations, but may be tempered, in the case of China and Russia, by fears that a DPRK populace that knows more about the outside world might be more likely to run for their borders in the event of an internal crisis in the North.
5.6 International Military/Security Dimension
From the perspective of the leadership of the DPRK, it is likely that the SDV path, which depends more on other nations for technological know-how, and requires the DPRK to allow probably a wider range of visitors to a wider range of places than the RDV case, would be seen as offering greater exposure to military security risks. The RALT path would have similar features, but would also include the double-edged sword of major shared energy facilities, which would both provide a weapon to the DPRK via the potential threat of interrupting the flow of energy to/from the other partners sharing the infrastructure, but would also provide a vulnerability in that the other partners could also threaten to shut down the flow of gas or electricity. The RALT path might require the DPRK to spend more, for example, on guards and monitoring equipment, to securing the portion of the shared infrastructure that passes through the DPRK than it otherwise might need to spend to secure its own infrastructure. The international community would likely see the SDV path, with its increased engagement between the DPRK and other nations, as reducing military/security risks by giving the DPRK more reasons to avoid confrontation with other nations. The RALT path would likely be seen as going even further in the direction of encouraging interaction, and discouraging confrontation, by increasing the drawbacks (in the form of forgone income and available resources) to behaviors that would upset the other members of the consortium. To the extent that, over time, the SDV and RALT paths would result in a reduction in military tensions in the region, they would also result in a reduction in the requirement for military-related spending, though it is likely that the partners in shared international energy infrastructure under the RALT path would, like the DPRK, need to allocate funds to guard and monitor the pipeline, powerline, and LNG facilities included in the path.
6 Conclusion
Energy security, whether defined narrowly or broadly, remains and will remain a key driver of energy and economic policies throughout the world. A more comprehensive definition of energy security including not only energy supply and economic elements, but also issues such as the environment, technological risk, social/cultural consideration, and international military/security aspects, provides a framework for reaching policy decisions that are better informed because they have been examined from more of the perspectives that will ultimately determine their success or failure. Our comparison of three plausible, though by definition illustrative, future energy paths for North Korea suggests that for most dimensions of a comprehensive definition of energy security, paths that emphasize greater energy efficiency, more different technologies, including energy efficiency technologies, are likely to preferable to both North Korean leadership and to the international community, though, in many cases, for rather different reasons. A future path for the DPRK that includes major energy infrastructure shared between countries, such as gas pipelines, electricity transmission lines, or LNG terminals, would look attractive to the DPRK leadership as a means of generating hard currency and diversifying energy sources, and as a source of national pride to be a part of international infrastructure projects, but would pose dilemmas related to control and interdependence for both the DPRK and its international partners. Addressing those dilemmas, however, will ultimately accelerate the process of integrating the North Korean economy with those of its neighbors and that of the international community in general. The process will not, if history is a guide, be either smooth or easy, and will require consistent patience, planning, and coordination among the member of the international community that seek to work with the North Koreans. We did not model two other conceivable pathways, Rapid Collapse and Recovery; and War and Reconstruction. These two pathways have huge costs and uncertainty associated with them. We judge the probability of these two pathways to be low, and have therefore focused on the constructive pathways[51]. Many of the strategies that support the peaceful, non-collapse pathways analyzed above, however, would also reduce the social, economic, ecological and other costs associated with a rapid collapse, or post-war reconstruction. In our previous work, we have suggested and described a number of approaches that the DPRK and the international community could undertake to move toward the more sustainable future sketched out in the Sustainable Development and Regional Alternative paths described above[52]. These options, ranging from implementation of building energy efficiency measures to upgrading coal mines to pilot projects combining energy infrastructure and economy development to major shared international facilities, all underpinned by capacity-building and engagement on a widespread and personal level, can help the DPRK and its neighbors move toward a higher level of comprehensive energy security. [1] See, for example, Reuters (2012), “North Korea rocket launch raises nuclear stakes”, dated December 12, 2012, and available as http://www.reuters.com/article/2012/12/12/us-korea-north-rocket-idUSBRE8BB02K20121212. [2] See, for example, The Economist (2013), “North Korea’s nuclear test: Fallout”, dated February 16th 2013, and available as http://www.economist.com/news/asia/21571938-chagrin-his-neighbours-young-despot-appears-determined-continue-his-familys-atomic. [3] See, for example, BBC New Asia (2013), “US-South Korea drills begin amid North Korea tensions”, dated March 11, 2013, and available as http://www.bbc.co.uk/news/world-asia-21737859; and Reuters (2013), “North Korean nuclear test, war threats “unacceptable”: U.N.’s Ban Ki-moon”, dated March 9, 2013, and available as http://www.reuters.com/article/2013/03/09/us-korea-north-ban-idUSBRE92807Y20130309. [4] See, for example, Junko Edahiro (2012), “Japan’s Strategic Energy Plan under Review after 2011 Nuclear Disaster”, Japan for Sustainability Newsletter No.114 (February 2012), available as http://www.japanfs.org/en/mailmagazine/newsletter/pages/031723.html. [5] See, for example, Clawson, P. 1997. “Energy Security in a Time of Plenty”, National Defense University Institute for National Strategic Studies Strategic Forum, Number 130, November. Available at: http://www.dtic.mil/cgi-bin/GetTRDoc?Location=U2&doc=GetTRDoc.pdf&AD=ADA394273. [6] A recent example of a largely energy supply/energy prices-based concept of energy security is conveyed in the Institute for 21st Century Energy/U.S. Chamber of Commerce (2012) document International Index of Energy Security Risk: Assessing Risk in a Global Energy Market, 2012 Edition, available as http://www.energyxxi.org/sites/default/files/InternationalIndex2012.pdf. In this Index, about two-thirds of the weighting used to derive an overall index of energy security per country from a set of metrics (which are themselves indices) is devoted to energy supply- and energy price-related metrics, with the remainder being devoted to fuel diversity and fuel use intensity metrics, with “Environmental” (CO2 emissions-related) metrics receiving 6 percent of the overall total weighting. [7] Additional details of the PARES project’s achievements can be found in the report A Framework for Energy Security Analysis and Application to a Case Study of Japan, by Tatsujiro Suzuki, David Von Hippel, Ken Wilkening, and James Nickum, dated June, 1998, and available as http://oldsite.nautilus.org/archives/pares/PARES_Synthesis_Report.PDF. [8] The discussion in this section adapts, updates, and/or summarizes several previous works by the authors and their colleagues. The reader is urged to consult these publications for additional details on the broader approach to energy security analysis referred to in this paper. See, for example, David von Hippel, Tatsujiro Suzuki, James H. Williams, Timothy Savage, and Peter Hayes (2011), “Energy Security and Sustainability in Northeast Asia”, Energy Policy, Energy Policy, volume 39, pp. 6719-6730, available as http://dx.doi.org/10.1016/j.enpol.2009.07.001; David von Hippel, Tatsujiro Suzuki, James H. Williams, Timothy Savage, and Peter Hayes (2011), “EVALUATING THE ENERGY SECURITY IMPACTS OF ENERGY POLICIES”, Chapter 3 in The Routledge Handbook of Energy Security, edited by Benjamin K. Sovacool, Routledge Publishers; and David F. von Hippel, James H. Williams, Fritz Kahrl, and Peter Hayes (2012), “Energy Security—East Asia”, in Volume 7 of Berkshire Encyclopedia of Sustainability: China, India, and East and Southeast Asia: Assessing Sustainability, Berkshire Publishing Group. In addition, a forthcoming Working Paper prepared for the Energy, Governance and Security Center of Hanyang University will, among other topics, provide a more detailed update and application of the broader energy security concept summarized here and in our earlier work. [9] See, for example, Acid Deposition Monitoring Network in East Asia (EANET, 2011), Second Periodic Report on the State of Acid Deposition in East Asia: Part III, Executive Summary, dated December, 2011, and available as http://www.eanet.asia/product/PRSAD/2_PRSAD/2_ex.pdf; and Yuan Xu, Robert H. Williams, and Robert H. Socolow (2009), “China’s rapid deployment of SO2 scrubbers”, Energy & Environmental Science, 2009, volume 2, pages 459–46, available as http://www.princeton.edu/mae/people/faculty/socolow/china-rapid-deployment-so2-scrubbers.pdf. [10] See, for example, B. Metz, O.R. Davidson, P.R. Bosch, R. Dave, and L.A. Meyer, editors (2007), Climate Change 2007: Mitigation of Climate Change, Contribution of Working Group III to the Fourth Assessment Report of the Intergovernmental Panel on Climate Change, available from http://www.ipcc.ch/publications_and_data/ar4/wg3/en/contents.html. [11] See, for example, Wilkening, Kenneth E., Leonard A. Barrie, Marilyn Engle (2000), “Trans-Pacific Air Pollution”, Science, 6 October 2000: Vol. 290. no. 5489, pp. 65 – 67; and Owen Temby (2012), “American Businesses Interests, Meet Air Pollution Transport Science: Understanding the United States’ Response to Trans-Pacific Air Pollution”, Presented at the Western Political Science Association 2012 Annual Meeting March 22-24, 2012, Portland, Oregon, and available as http://wpsa.research.pdx.edu/meet/2012/temby.pdf. [12] See, for example, International Atomic Energy Agency (IAEA, 2007), “Asia Leads Way In Nuclear Power Development: Japan, South Korea, China and India Driving Present Global Nuclear Power Expansion”. Staff report, 30 October 2007, available as http://www.iaea.org/NewsCenter/News/2007/asialeads.html; and Edward Kee (2010), “Global Nuclear Power Developments: Asia Leads The Way”, presentation for Nuclear Energy Asia 2010, Hong Kong, China, available as http://www.thoriumenergyalliance.com/downloads/TEAC3%20presentations/TEAC3_Kee_Edward.pdf. [13] See, for example, The National Diet of Japan (2012), The Official Report of The Fukushima Nuclear Accident Independent Investigation Commission, Executive Summary, available as http://warp.da.ndl.go.jp/info:ndljp/pid/3856371/naiic.go.jp/wp-content/uploads/2012/09/NAIIC_report_lo_res10.pdf. [14] See, for example, Reuters (2013), “China, Japan move to cool down territorial dispute”, dated January 25, 2013, and available as http://www.reuters.com/article/2013/01/25/us-china-japan-idUSBRE90O06S20130125. [15] Matthew, R. (1995). “Environmental Security: Demystifying the Concept, Clarifying the Stakes”, in Environmental Change and Security Project Report, Washington, D.C., Woodrow Wilson Center for International Scholars, pages 14-23, available in http://www.wilsoncenter.org/sites/default/files/report1a.pdf. [16] Based on index formula as derived by Thomas L. Neff (1997), Improving Energy Security in Pacific Asia: Diversification and Risk Reduction for Fossil and Nuclear Fuels, prepared for the Nautilus Institute Pacific Asia Regional Energy Security (PARES) Project, December 1997, and available as http://oldsite.nautilus.org/archives/papers/energy/NeffPARES.pdf. [17] The Economist Intelligence Unit (1994), South Korea, North Korea No. 1 1994. The Economist Intelligence Unit, London, United Kingdom. Country Report, 1st Quarter 1994. [18] Far Eastern Economic Review (1995), 1995 Asia Yearbook, North Korea. [19] Korea Trade-Investment Promotion Agency (KOTRA) data (from http://www.kotra.or.kr/main/info/nk/eng/main.php3, visited 6/3/02) in “South/North Korea’s Trend of Real (GDP) Growth Rate”, which lists the Bank of Korea as a Source. Similar growth in the North Korean “GNI” was also cited in data provided to Nautilus by the Korea Energy Economics Institute. [20] Bank of Korea (2011), New Release: Gross Domestic Product Estimates for North Korea in 2010, dated November 3, 2011, and available as http://www.nkeconwatch.com/nk-uploads/GDP_of_North_Korea_in_2010.pdf. [21] For example N. Eberstadt (2001), If North Korea Were Really “Reforming”, How Could We Tell—And What Would We Be Able To See? states “…official claims of ‘turning the corner’ and ‘completing the Forced March’ notwithstanding, the DPRK remains in dire economic straits”. Eberstadt goes on to cite the UN Food and Agriculture Organization’s finding that DPRK cereal production in 2000/2001 “is expected to be fully a third below the level of 1995/96”, and asserts, based in part on the DPRK’s meager reported export earnings in the first half of 2001, that “The country’s export capabilities are likewise in a state of virtual collapse…”. [22] U.S. Bureau of the Census (1995), The Collapse of Soviet and Russian Trade with the DPRK, 1989-1993: Impacts and Implications. Prepared by N. Eberstadt, M. Rubin, and A. Tretyakova, Eurasia Branch, International Programs Center, Population Division, U.S. Bureau of the Census, Washington, D.C., USA. March 9, 1995. [23] U.S. Bureau of the Census (1995b), China’s Trade with the DPRK, 1990-1994: Pyongyang’s Thrifty New Patron. North Korea Trade Project Memorandum, International Programs Center, Population Division, U.S. Bureau of the Census, Washington, D.C., USA. May, 1995. [24] See, for example, Nathaniel Aden (2011), “North Korean Trade with China as Reported in Chinese Customs Statistics: 1995-2009 Energy and Minerals Trends and Implications”, Korean Journal of Defense Analysis, Vol. 23, No. 2, June 2011, pages 231–255, available as http://www.kida.re.kr/data/kjda/06_Nathaniel%20Aden.pdf. Data for 2010 and 2011 from United Nations Comtrade Statistics database. [25] Issues related to Chinese investment in the DPRK, and changes in DPRK policies that have made investment possible, are addressed in the Nautilus Institute Policy Forum Online 06-70A, August 23rd, 2006, “DPRK’s Reform and Sino-DPRK Economic Cooperation”, by Li Dunqiu (http://www.nautilus.org/fora/security/0670Li.html). See also Professor Li’s presentation as prepared for the Energy Experts Working Group Meeting, June 26th and 27th, 2006, Palo Alto, CA, USA, and available as http://www.nautilus.org/DPRKEnergyMeeting/Papers/Li.ppt. Professor Li describes two “waves” of recent Chinese investment in the DPRK, with a first wave of investment led by private companies and businessmen, mainly from China’s northeast provinces, and the second wave described as “mostly represented by large state-owned enterprises, in areas like heavy industry, energy, mineral [resources] and transportation”. A more recent article touching upon China-DPRK issues is Jin Moo Kim (2011), “North Korea’s Reliance on China and China’s Influence on North Korea”, Korean Journal of Defense Analysis, Vol. 23, No. 2, June 2011, pages 257–271, available as http://www.kida.re.kr/data/kjda/07_Jin%20Moo%20Kim.pdf. [26] As of 1995 the DPRK’s trade deficit was estimated at $879 million, based on United States Department of Energy’s Energy Information Administration (UDOE/EIA, 1996), Country Analysis Brief, North Korea. [27] United States Department of Energy’s Energy Information Administration (UDOE/EIA, 1996), Country Analysis Brief, North Korea. Part of USDOE/EIA World-wide Web site, WWW.eia.doe.gov/emeu/cabs/nkorea.html. [28] For example, see Joongang Ilbo, Lee Young-jong, “North Korea Overseas Trade Reaps $1.97 Billion For Last Year,” Seoul, 06/04/01. [29] As estimated by ERINA (Economic Research Institute for Northeast Asia) in Chapter 5 of Northeast Asia Economic Databook 2005, dated approximately December, 2005. ERINA’s estimates are based on data from the Korea Trade-Investment Promotion Agency (KOTRA) for trade between the DPRK and nations other than the DRPK, plus figures on trade between the Koreas from the ROK Ministry of Unification. Avalable as http://www.erina.or.jp/En/Lib/datab/2005pdf/05-De.pdf. Page 53. [30] Bank of Korea (2011), New Release: Gross Domestic Product Estimates for North Korea in 2010, dated November 3, 2011, and available as http://www.nkeconwatch.com/nk-uploads/GDP_of_North_Korea_in_2010.pdf. [31] One such affected region is the Sinuiju area, where, after the 1995 floods, “…sand poured in from the Yalu River and destroyed all the rice fields in the region” (Bernard Krisher “Urgent Proposals To Get Food & Drugs To North Korea”, extracted in Northeast Asia Peace and Security Network Daily Report, 30 May 1997. Nautilus Institute, Berkeley, CA, USA. [32] See, for example, Cankor (2011), “DPRK Flood Damage Reports by KCNA”, dated 8 August 2011, and available as http://vtncankor.wordpress.com/2011/08/08/dprk-flood-damage-reports-by-kcna/; and United States Central Intelligence Agency (2010), North Korea: Assessing the Impact of Flooding on Agricultural Output (U//FOUO), dated 15 December 2010, and available as http://www.fas.org/irp/cia/product/nk-flood.pdf. [33] Primary energy counts all fuel use, including conversion and transmission/distribution losses. Commercial energy excludes, for the most part, use of biomass fuels such as firewood and crop wastes. [34] This is a further argument, as elaborated in our previous work and touched upon below, for making every effort to improve the efficiency of energy use in all sectors of the North Korean economy as restraints on energy supplies are reduced. [35] In his paper and presentation “Changes In The North Korean Economy And Implications For The Energy Sector: Is North Korea Really Short of Energy?”, as prepared for the Energy Experts Working Group Meeting, June 26th and 27th, 2006, Palo Alto, CA, USA, William B. Brown discussed the state of DPRK energy markets, and noted that by one measure of electricity cost, the ratio of the price of rice to the price of a kilowatt-hour of electricity, power was one hundred times as expensive in the United States in 2006 than it was in the DPRK. See http://www.nautilus.org/DPRKEnergyMeeting/Papers/Brown.html and http://www.nautilus.org/DPRKEnergyMeeting/Papers/Brown.ppt. [36] Another way in which the food shortage likely has affected the economy is that scrap metal, some taken from industrial facilities, apparently has been (we do not know to what extent the practice continues) used as barter to obtain food via cross-border trade with China (Korea Times, “N. KOREA BARTERS SCRAP IRON FOR CHINESE FLOUR, CORN,” Beijing, 05/18/97). Although the extent to which operational industrial facilities have been dismantled to trade for food is unknown, we find it conceivable that even if the DPRK does manage to obtain the needed inputs and investment to restart industrial production, many plants will be found to be inoperable due to key missing (sold for scrap) parts. In the same vein, there have also been reports from defectors that North Koreans have cut pieces of telephone and electrical wire to barter the copper in them to Chinese smugglers in exchange for food and other items (Korea Times, “RUMORS OF WAR RAMPANT IN N. KOREA,” 05/23/97). [37] The quantitative estimates of DPRK energy supply and demand provided below are based on the most recent (2010 base year) Nautilus DPRK energy sector analysis, a summary of which will be provided later in 2013 in a forthcoming Working Paper prepared for the Energy, Governance and Security Center of Hanyang University. The most recent DPRK energy sector analysis published by Nautilus is Von Hippel David and Peter Hayes (2012), Foundations of Energy Security for the DPRK: 1990-2009 Energy Balances, Engagement Options, and Future Paths for Energy and Economic Redevelopment, Dated 18 December 2012, The Nautilus Institute for Security and Sustainability, available as https://nautilus.org/napsnet/napsnet-special-reports/foundations-of-energy-security-for-the-dprk-1990-2009-energy-balances-engagement-options-and-future-paths-for-energy-and-economic-redevelopment/. [38] For a more thorough discussion of this issue, see the Nautilus essay Modernizing the US-DPRK Agreed Framework: The Energy Imperative (D. Von Hippel, P. Hayes, M. Nakata, T. Savage, and C. Greacen, 2001), available as http://www.nautilus.org/DPRKBriefingBook/agreedFramework/ModernizingAF.pdf. [39]The “capacity factor” of a power plant reflects the equivalent fraction of time (for example, during a year) that the power plant is producing its full rated output. In figure 3, “HFO” stands for heavy fuel oil, used in power generation, industrial boilers, and similar applications. [40]One terawatt-hour is equal to 3600 terajoules, 3.6 million gigajoules, or one billion kilowatt-hours (kWh). By way of comparison, the District of Columbia used about 12 TWh of electricity in 2010 (US Department of Energy, Energy Information Administration (2012), “State Electricity Profiles”, available as http://www.eia.gov/electricity/state/), which was perhaps a little more, after accounting for losses in electricity transmission and distribution, than the whole of the DPRK used in 2010. [41] See, for example, Peter Hayes and David von Hippel (2011), DPRK “Collapse” Pathways: Implications for the Energy Sector and for Strategies Redevelopment/Support, Nautilus Institute Special Report, dated January 18, 2011, and available as https://nautilus.org/napsnet/napsnet-special-reports/dprk-collapse-pathways-implications-for-the-energy-sector-and-for-strategies-redevelopmentsupport/; and Peter Hayes and David von Hippel (2011) “North Korea’s ‘Collapse’ Pathways and the Role of the Energy Sector”, Chapter 8 in The Survival of North Korea: Essays on Strategy, Economics and International Relations, Edited by Suk Hi Kim, Bernard Selinger, and Terence Roehrig, McFarland & Company, Inc. [42] See, for example, The Economist (2013), “The new capitalists”, dated February 9th 2013, and available as http://www.economist.com/news/leaders/21571421-even-another-nuclear-provocation-looms-hope-glimmers-worlds-most-oppressed-people?zid=306&ah=1b164dbd43b0cb27ba0d4c3b12a5e227. [43] International Atomic Energy Agency [44] See David von Hippel and Peter Hayes (2010), Engaging the DPRK Enrichment and Small LWR Program: What Would It Take?, Nautilus Institute Special Report, dated December 23, 2010, and available as https://nautilus.org/napsnet/napsnet-special-reports/engaging-the-dprk-enrichment-and-small-lwr-program-what-would-it-take/#axzz2OgR6ceT9. [45] In the Asian Energy Security project, and the related and follow-on East Asia Science and Security project, collaborating groups of researchers from each of the countries of Northeast Asia work together to research the energy security implications of different energy policy choices, both within their countries and regionally. See, for example, “East Asia Science and Security Meeting 2010”, at https://nautilus.org/projects/by-name/science-security/workshops/2010-east-asia-science-and-security-meeting/. [46] The Sustainable Development or Regional Alternative pathways, or similar variants, may in fact be the only approaches to rehabilitate DPRK infrastructure sufficiently as to be able to use within the country even some of the power from nuclear reactors such as those that were being built by the Korean Peninsula Energy Development Organization (KEDO) until 2002. There is at present no way to use 1000 MW-class reactors within the existing North Korean grid , so to use such a reactor interties to other countries must be constructed, and preferably, from a political and practical perspective, the DPRK grid would need to be totally rebuilt as well. Had the construction of the KEDO reactors at Simpo continued, interconnection issues could have been both a huge problem that could have led to poor relations between the DPRK and the US/ROK for years to come, or, if handled correctly, could have constituted a huge opportunity for building of economic links (and better relations) between the countries of the region. If construction of the LWRs at Simpo is taken up again in the future, this technical consideration, and its various solutions and non-solutions, will remain. Given the unresolved nature of the various nuclear-related issues (including nuclear weapons, uranium enrichment, the DPRK’s stated aim to develop a domestic small light water reactor, and the lingering possibility of resuming work on the large Simpo LWR units with ROK or international assistance), we have chosen to leave nuclear power out of the modeling of the Redevelopment path, and also out of the major variant paths described below. We have, however, also prepared preliminary “with nuclear” scenarios described as above, with the bulk of the power from those reactors, at least initially, exported directly to the ROK through a direct tie-line to the larger, stable ROK grid. Nuclear safety concerns (back-up power for coolant pumps and controls) and the attributes of a large-capacity nuclear unit operating in a small power grid (the DPRK grid is far below the minimum size to support the KEDO reactors) are key reasons why these reactors cannot operate under current conditions. See David Von Hippel, Peter Hayes, Masami Nakata, Timothy Savage, and Chris Greacen (2001), Modernizing the US-DPRK Agreed Framework: The Energy Imperative, dated February 16, 2001, and available as http://www.academia.edu/1073334/Modernizing_the_US-DPRK_Agreed_Framework_The_Energy_Imperative. [47] The LEAP software tool is developed and maintained by Stockholm Environment Institute—United States. Please see http://www.energycommunity.org/ for information about the LEAP tool. [48] Note that the Recent Trends path, though it is shown together for comparison with the other paths in Figures 15 and 16, is not strictly comparable with the other paths because it assumes that a solution to the current impasse over the DPRK’s nuclear program is not found, that and large-scale economic redevelopment in North Korea does not occur. [49] Global Warming Potential is a measure of how the radiative forcing of air pollutant emissions with direct or indirect impacts on climate compare, on a per unit basis, to that of Carbon Dioxide (CO2). As such, it allows the tonnes of emissions of different pollutants to be totaled within a common metric, but CO2 dominates the total. [50] See, for example, the discussion “What Does the DPRK Want?” in David von Hippel and Peter Hayes (2009), DPRK Energy Sector Assistance to Accompany Progress in Denuclearization Discussions: Options and Considerations, prepared for the project “Improving Regional Security and Denuclearizing the Korean Peninsula: U.S. Policy Interests and Options”, dated October 2009, and available as http://www.ncnk.org/resources/publications/Hipple_and_Hayes_DPRK_Energy_Assistance.pdf. [51] Peter Hayes and David von Hippel (2011) “North Korea’s ‘Collapse’ Pathways and the Role of the Energy Sector”, Chapter 8 in The Survival of North Korea: Essays on Strategy, Economics and International Relations, Edited by Suk Hi Kim, Bernard Selinger, and Terence Roehrig, McFarland & Company, Inc. [52] See, for example, Von Hippel David and Peter Hayes (2012), Foundations of Energy Security for the DPRK: 1990-2009 Energy Balances, Engagement Options, and Future Paths for Energy and Economic Redevelopment, dated 18 December 2012, The Nautilus Institute for Security and Sustainability, available as https://nautilus.org/napsnet/napsnet-special-reports/foundations-of-energy-security-for-the-dprk-1990-2009-energy-balances-engagement-options-and-future-paths-for-energy-and-economic-redevelopment/; David von Hippel, Ruslan Gulidov, Victor Kalashnikov, and Peter Hayes, “Northeast Asia Regional Energy Infrastructure Proposals”, Asian Energy Security Special Section of Energy Policy, Volume 39, Number 11, November, 2011 Pages 6855–6866, and available as http://dx.doi.org/10.1016/j.enpol.2009.08.011; and David von Hippel, Scott Bruce, and Peter Hayes, “Transforming the DPRK through Energy Sector Developmen”, 38North Special Report 11-3, dated March 4 2011, and available as http://38north.org/wp-content/uploads/2011/03/38NorthSR_11-3_EnergySectorDev2.pdf.