1. Introduction and Background
Recent economic growth in the Asia-Pacific region in general, and in Northeast Asia in particular, has been spectacular. Along with this growth has come a vast expansion in the need for energy services, and an expansion in the demand for the fuels that help to supply these services. Future projections suggest that the growth of fossil fuel use in Northeast Asia, and in China in particular, is likely to not only have major consequences for local and regional pollution-as detailed in other background papers in this set-but will have global dimensions as well. Rapidly increasing growth of fossil fuel use will have ramifications for global energy and capital markets, and will have profound impacts on global greenhouse gas emissions as well. Conversely, the changing global climate may have impacts on the regional environment and regional political relations. Substantial regional and international cooperation will be required to allow Northeast Asia to realize its development goals without jeopardizing the regional and global environment.
1.1. Growth in Fossil Fuel Use in Northeast Asia
Table 1.1 (above) presents the current pattern of commercial fuel use in the countries of Northeast Asia by type of fuel figure 1.1  1,2,3,a. The countries of Northeast Asia consumed slightly under 20 percent of the world’s supply of commercial fuels in 1995, including about 17.5 percent of the petroleum products, 4.5 percent of the natural gas, and more than a third-almost 37 percent-of the world’s coal. The sectoral breakdown of fuels demand in several of the countries of the region(as of 1992) is shown in Figure 1-1 (above) 4,5,6,7. Here the industrial sector fraction of fuels demand is greater in the less developed countries-China and North Korea-than in Japan and South Korea. Conversely, energy demand in the transportation sector makes up a significantly smaller portion of total energy use in China and North Korea. Both North Korea and China consumed approximately 1.2 tonnes of oil equivalent (toe) of end-use fuels per capita in 1990 and 1992 (respectively), while South Korea used 2.2 toe per capita, and Japan used 2.6 toe per capita8.
The major point here is that energy use in Asia-particularly in China and North Korea, would seem to have substantial “room to grow” before it reaches the levels currently maintained by Japan and other developed nations. The consumption of transport services, which Chinese and North Koreans currently use very lightly, is one of the key areas that is bound to grow, with-in all probability-a significant increase in transport energy use.
1.2. Scenarios of Future Energy Use in the Region
Table 1-2provides an overview of the results of country-level scenarios of future energy use from several different groups9. In each case, the table shows the average annual growth rate of primaryb commercial c energy use from the early 1990’s (scenario base years vary among groups) to 2010. In each case the “Base”, “Business as Usual”, or “Reference” scenario prepared by each group is reportedd. Annex A presents a more detailed compendium and comparison of these results, with results by country, fuel, and scenario source.
Although the results of these scenarios vary somewhat, the overall pattern of strong growth in primary fuels use-in the range of 4 to 5 percent per year for all countries except Japan-is uniform. At this growth rate, energy use in the countries of the region (with the exception of Japan) will rise by about 120 percent of today’s level by just the year 2010. As most of this fuel will continue to be fossil-derived, the increase in greenhouse gas (GHG) emissions from the countries are significant enough to merit extreme global concern, in addition to the ramifications for acid rain (as described in other papers in this series).
Another key aspect of the projected growth in fuels use in Northeast Asia is the shift in the patterns of fuel use, imports, and exports in the region. Of particular concern is the projected shift of China over the next two decades from being a small net exporter of oil in 1992 to being a very large net importer, with oil import needs second only to Japan in the region, and significantly greater overall oil demand. This shift, as emphasized by Fujime (IEEJ) and Fesharaki et al (East-West Center) in their respective scenarios10, will (together with flat production and growth in domestic consumption in the Asian countries now exporting oil-especially Indonesia) shift the focus of regional imports to the Middle East, increase competition for crude, and increase the pressure on oil transport infrastructure, including sea lanes used by tankers.
1.3. Plan of this Paper
The brief examples presented above underscore both the current and future importance of the Northeast Asia region in the overall structure of global energy demand and, in all probability, with regard to global environmental problems. The remainder of this document presents overviews of some of the global issues on which the region will have an impact-as well as regional impacts of global problems, and explores some of the opportunities for mitigating some of these environmental impacts.
- Section 2 presents an overview of the major global issue facing the energy sector in Northeast Asia: greenhouse gas emissions and their impacts. Section 2 includes a brief summary of regional greenhouse gas emissions (present and future), and a comparison with emissions estimates and projections for the rest of world. Some of the implications of the increase in fossil fuel use in Northeast Asia for global greenhouse gas emissions and GHG stabilization targets are noted.
- Section 3 provides a summary of some of the potential regional impacts of global problems, and of the interaction of global problems with regional environmental problems such as acid precipitation and other trans-boundary pollution, with cross-border human migration, natural disasters, and changing local climates (including desertification).
- In a follow-on to an earlier paper in this series (“Technological Alternatives to Reduce Acid Gas and Related Emissions from Energy-Sector Activities in Northeast Asia”),Section 4 explores potential synergies between measures to curb acid rain and measures that would help to reduce GHG emissions and the impacts of climate change.
- The final part of this paper, Section 5, suggests fertile areas for regional and international collaboration, and potential mechanisms and initiatives that could be pursued in these areas.
[ Return to Top ]
2. Impact of Growth in Fuels Consumption in Northeast Asia on the Global Environment and Economy
2.1. Increased Fuels Use and Greenhouse Gas Emissions
The current and projected growth in energy use in Northeast Asia, particularly in a “Business-as-Usual” world, means that the region will play an extremely important role in either exacerbating or reducing the impacts of global climate change. Scientific consensus is that increasing concentrations of greenhouse gases in the atmosphere, prominently including carbon dioxide and methane emitted by fossil fuels combustion, will cause global climate to change in the next several decades, if such changes have not already occurred11. The impacts of climate change will vary widely across the globe, but those countries with the largest, least affluent populations per unit land area will likely be among the most vulnerable. China and North Korea, therefore, face somewhat of a dilemma. Development is necessary in both human and political terms, but one of the impacts of development is likely to be increased greenhouse gas emissions, which puts those countries (and the globe) at risk from the impacts of climate change.
Table 2.1 (above) shows a comparison of one set of greenhouse gas emissions projections for Northeast Asia as compared with projections for the rest of the world. In 1980, the countries of Northeast Asia accounted for just under 15 percent of the world’s total carbon emissions. By 1992, the fraction had grown to nearly 20 percent. By 2010, based on projections by Fujime, carbon dioxide emissions from the region will be 23 percent of the global total, reaching a level nearly double that of 1992. This means that the region will have contributed nearly one-third of the total growth in global carbon emissions between 1980 and 201012. Annex A (page 7) provides estimates of historical and future GHG emissions by country for Northeast Asia.
Although the process of climate stabilization is one that will of necessity take the better part of a century if not more, an increase like that shown above in only the next two decades will make stabilization that much harder to achievef. Managing the growth in fossil fuel use in Northeast Asia is therefore one of the keys in reaching GHG stabilization targets as soon as possible.
2.2. Potential Impact of Increased Fossil Fuel Consumption in Northeast Asia on the Marine Environment
Increased use of fuels in Northeast Asia and Asia generally is likely to affect the global marine environment. As noted above, oil imports by China alone are projected to reach 132 million tonnes of oil equivalent (Mtoe) per year by 2010, and net imports to the Asian APEC region as a whole are expected to rise from about 75 Mtoe in 1992 to 432 Mtoe in 2010, an increase of nearly 500 percent. What this means is that much more oil will be on the high seas, traveling to Asian countries from exporting nations that are increasingly in the Middle East. Fesharaki et al13estimate that 95 percent of crude oil imports to Asia and the Pacific will come from the Middle East by 2010, as compared with 70 percent in 1993. This vast potential increase in tanker traffic brings with it potential for increased marine oil pollution from both routine and accidental spills.
The most visible and prevalent example of direct spillage of energy products into oceans is that of “oil spills”. Crude oil and refined products spill during routine operation of offshore oil rigs, from oil tanker filling and off-loading operations, during the cleaning of tankers, as spillage from other (non-tanker) ships that use petroleum fuels, and as a result of leakage from undersea pipelines, as well as during less frequent but better-publicized oil tanker accidents and “blowouts”g at offshore oil platforms.
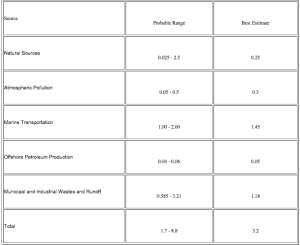
Table 2.1 (Above) provides estimates of the current sources and magnitude of marine oil pollution. Of the sources listed, marine transportation, including oil tanker traffic, is estimated to be the largest single source.
Oil spills are toxic to many forms of marine life, as well as fouling beaches and affecting other ecosystems and man-made installations along the shoreline. Oil floating on the ocean’s surface can coat marine birds, making them unable to fly, reducing the insulating properties of their feathers (so that they can no longer stay warm), and usually eventually killing them. Oil spills disrupt the food chain by killing phytoplankton and zooplanktonh at or near the oceans surface. This is important throughout the world, but nowhere more than in Asia, with its high population densities and where so many people A) live in coastal areas, and B) depend on marine products for food and livelihood. Food chain disruptions that reduce yields (or usable yields) of fish and shellfish put an additional burden on a regional food production system that is already operating with little capacity to spare.
Heavier oil products, and the heavier fraction of crude oils, sink to the bottom, where they can coat shellfish beds, making shellfish and other invertebrates inedible. Damage from oil spills may persist for many years, as compounds contained in oils can remain both in the bodies of organisms and in marine sediments. Oil spills can be spread rapidly by tides, currents, and winds, making them a long-term threat to the regional and global marine environment, in addition to their acute local impacts.
The risk of oil spills in the Asian region in general, and in Northeast Asia in particular are likely to increase as more and more tankers carrying oil from the Middle East and elsewhere to China and other nations add to congestion in the relatively few major sea lanes in the regioni,15. These sea lanes are already crowded by tanker and freighter traffic serving the booming economies of the area.
2.3. Potential Impacts of Energy Demand Growth in Northeast Asia on Capital Markets
Meeting the increased demand for fuels in Northeast Asia will require huge capital investments in a number of different sectors, including:
- Electricity generation, particularly to meet high growth in demand in China
- Coal mine expansion, and especially, coal transport facilities in China
- Oil exploration and production facilities, including offshore platforms
- Oil tanker docking facilities, again especially in China
- Oil refining-including both new refineries and equipment to allow existing refineries to use high-sulfur (sour) crude oil from the Middle East
- Natural gas pipelines-virtually all of the proposals for bringing gas to Northeast Asia involve costs of $10 to $20 billion US or more, even before accounting for the costs of local distribution networks16
- Liquefied natural gas (LNG) terminals (at up to $1 billion each) and transport vessels (at on the order of $250 million each).
These potential investments will compete among themselves for scarce foreign and domestic capital. They may also compete for capital with environmental investments such as pollution control equipment, coal mine safety investments, and energy efficiency investments. The potential constraints on the capital markets that can supply the region have not been quantitatively examined in a thorough fashion as yet, but availability of capital remains a consideration that will determine, in part, the evolution of energy infrastructure in the region.
[ Return to Top ]
3. Regional Impacts of Global Environmental Problems
In addition to some of the environmental impacts of marine pollution related to petroleum transport that are noted in the previous section, Northeast Asia is vulnerable to a range of environmental impacts of global climate change. These environmental impacts, in turn, could (and in many cases, would) spawn a broad range of social and economic impacts in the region.
3.1. Potential Regional Environmental Impacts of Global Climate Change
The environmental impacts of global climate change in the Northeast Asia region include, but are not by any means limited to:
- Changes in average temperature
- Rising sea levels and related impacts
- Changes in precipitation and in the frequency and severity of storms
- Changes in the distribution of ecosystems
A complete discussion of all of the different potential impacts of global climate change in Northeast Asia is beyond the scope of this paper. The work of the Intergovernmental Panel on Climate Change (IPCC) and others is available for those interested obtaining more detailed information17,18.
3.1.1. Change in global temperature
Based on a range of different scenarios of human fossil fuel use and other activities that emit GHGs, the IPCC estimates that global mean temperature will increase by between 1.5oC and 4.5oC, with a “best estimate” of 2.5oC, by 2100, relative to pre-industrial (late 19th-century) temperatures. These temperature changes will not be evenly distributed. Temperature changes in northern latitudes, including the Russian Far East, Mongolia, the Koreas, Japan, and Northern China, are projected to be higher than changes in the tropics, temperature changes at inland locations are expected to be greater than near the ocean, and the warming of the climate will be greatest in the late autumn and the winter. The recent inclusion of the effects of atmospheric aerosols (small particles, for example of soot or of sulfate compounds) into the modeling of future climate has changed the projected picture somewhat, particularly in Northeast Asia. Aerosol emissions in Northeast Asia, particularly in China, have the effect (in computer simulations for the period to 2040-2049) of reducing the temperature increases caused by higher CO2 concentrations. Though aerosols would appear to exert a cooling effect, the magnitude of their impact on climate is still quite uncertain19.
3.1.2. Sea Level Rise
One of the most-noted potential impacts of climate change is sea level rise (SLR). The increase in global temperatures affects the level of the oceans in two different ways. First, when surface ocean waters are heated, they expand and occupy more volume of ocean basin, thus causing sea levels to rise. A second mechanism that causes ocean waters to rise occurs when elevated temperatures cause the ice in polar and mountain glaciers and ice sheets (principally the Antarctic and Greenland ice caps) to melt, and the meltwater from these bodies of ice eventually or directly adds to the amount of water in the ocean. Due to temporal lags in the ocean/ice cap/atmosphere system20, it has been estimated that this second mechanism will provide a relatively minor contribution to overall sea level rise, particularly in the early years of the next century. The behavior of some of the world’s major ice sheets–and their response times to climate changes–is quite uncertainj. The IPCC’s mid-range projections of future sea level rise are for an increase of 20 cm by 2050 and 49 cm by 210021. Here again, the range of uncertainty is substantial.
The most obvious regional (as well as global) impact of sea level rise (SLR) brought on by climate change is inundation of coastal lands by the higher water level of the oceans. Hundreds of meters to many kilometers of shoreline inundation may result from tens of centimeters of SLR. In China, much of the most productive land is located in the coastal plains, often with an altitude on the order of a few meters above sea level. One estimate suggests that a one-meter rise in sea level would, in the plains of the Lower Liao and Pearl Rivers, and the North and East China coasts, 92,000 square kilometers would be inundated, affecting 65 cities and a population of 67 million people22. Coastal wetlands are especially at risk from increases in the sea level associated with climate change. Studies of several areas in the Asia and Pacific Region estimated wetland losses of 35 to over 90 percent23. The changes in climatic variability discussed below–changes in the severity, frequency, and location of storms, for example–will compound the impact of sea level rise, and place coastal ecosystems, infrastructure, and populations even more at risk.
3.1.3. Change in the amount and timing of precipitation, and of the frequency, and severity of storms
In a future where the climate has changed, some areas of the Asia and Pacific region may receive more rain than at present, and some less. Note that the various climate models do not necessarily agree on the pattern that these changes will take. For a doubling of atmospheric CO2concentrations, model predictions for the East Asian Seas region show slight increases in precipitation (zero to 20 percent) in both summer and winter24, but there is likely to be a large variation of changes in different areas. Estimates for China show an increase in both summer (9.3 percent) and winter (12.7 percent) precipitation, but with attending small decreases in both cloud cover and soil moisture25.
Along with changes in the amount of precipitation, and perhaps more importantly, changes in the timing of precipitation are expected. These changes include the shifting of storm patterns and changes in the severity of storms. Changes in the severity of storms and floods–and erosion exacerbated by storms and floods–as well as in the timing and amount of water discharged by rivers could (as pointed out by the impact of the recent floods in North Korea) have a devastating affect on both ecosystems and on the dense human populations of coastal and river areas. For island areas of the region (particularly in the south), this effect may include an increase in the frequency of hurricanes and typhoons to areas that already experience them, and a widening or shift in the belts of such storms to adversely affect additional island and mainland areas. Rising seas will exacerbate the damage caused by these weather phenomena.
3.1.4. Changes in the distribution of ecosystems
The climate-related changes discussed above can change plant growth conditions, and thus the distribution of ecosystems, in several ways, including:
- Changes in plant growth rates. These changes may include increases in plant growth promoted by higher concentrations of CO2 in the air. In addition, the northerly portions and countries of the region (such as Japan), may experience greater plant growth as higher average temperatures bring growing seasons. In some areas, decreases in growth rates may result from intolerance of high temperatures by the indigenous plant species or from changes in the amount or timing of precipitation26.
- Changes in forests due to changes in temperature, precipitation, and evaporation.Northeast Asia (particularly the Russian Far East) is home to large tracts of forests, and these forests are important both ecologically and economically. Forest ecosystems are sensitive to climate changes, but due to the long lives and long maturation periods required for large trees in forests, they will probably be less able than other ecosystems to adapt to changes in climate27.
- Changes in the distribution and prevalence of plant and animal pests and diseases, and the changes in the susceptibility of plants and animals to these maladies due to their exposure to changes in temperature and precipitation, and other climate change-induced stress.
- Changes in ocean temperatures and their effects on ocean productivity.
- Changes in biodiversity and species distribution. All of the changes noted above have the potential to alter the distribution and range of plant and animal species, including both domesticated crops and livestock and native flora and fauna. Although the natural inclination of managed and natural ecosystems under climate stresses is to migrate to more favorable areas, these migrations could be frustrated by an inability to migrate-due to physical isolation or limitations posed by other natural or by human communities-or by a rate of climate change that exceeds the ability of those ecosystems to migrate28.
3.2. Potential Interaction of Regional and Global Environmental Problems
Some of the existing (and probable) local and regional environmental problems now experienced in the Northeast Asia region may be increased in magnitude-or made more difficult to cope with-by the impacts of global climate change. Some of the interactions between global climate change and local/regional impacts could include:
- Climate change-induced stress on ecosystems (through changes in temperature, precipitation, storm patterns, or sea levels) may pose an additional challenge to ecosystems affected by acid precipitation, such as forests and lake communities. Ecosystems stressed by local air pollutants (particulate matter, sulfur oxides, or lead, for example), erosion, or deforestation are also more vulnerable to climate change, as are the human populations that depend on themk.
- Sea level rise brought on by climate change will add to salinization (salt intrusion into fresh surface waters and groundwater) in areas-such as around several coastal cities in China-where groundwater pumping and other human activities have caused the land to subside. In areas where subsidence is already a problem, climate change will increase the rate at which land is inundated.
- River, lake, and estuary ecosystems stressed by additions of silt, municipal wastes, and industrial effluents will be more vulnerable to the impacts of climate change. These ecosystems-including fish and other products important for humans-will also be less able to adapt to a changing climate than if they were healthy.
3.3. Interaction of Climate Change and Marine Pollution Impacts with Existing Human Problems in the Region
There is a list of potential social and economic impacts of climate change much too long to describe in any detail herel. Some of the impacts that are most likely to exacerbate existing human problems in Northeast Asia are described briefly below.
- Pressure on agricultural resources and accelerated desertification caused by climate change may accelerate cross-border migration, particularly from China into Russia (a process already underway).
- Climate change impacts may further undermine the ability of North Korea to feed its population, possibly resulting in increased military pressure on South Korea, or rendering the process of reunification more economically burdensome.
- Higher temperatures would likely lead to increased use of air conditioning, which would in turn lead to higher fuel consumption for electricity generation, and higher emissions of local and regional air pollutants (as well as greenhouse gases).
- Salinization of estuaries that are the breeding grounds for fish and shellfish caught in shared regional waters (including the East Korea Sea/Sea of Japan) will affect yields of ocean products for all countries, possibly exacerbating conflicts over maritime resources.
- Additional oil pollution of the oceans of the region (as a result of greatly expanded oil imports by the region) could strain relations between countries sharing shipping lanes and marine resources.
- Climate change impacts may increase the human and economic costs of natural disasters (such as catastrophic storms) in the region, and spread even thinner the emergency resources available for responding to such disasters.
[ Return to Top ]
4. Potential Synergies: Curbing Acid Rain While Curbing Greenhouse Gas Emissions
Just as the impacts of climate change can compound, as noted above, the impacts of acid gas emissions, there is also an overlap between the measures that can help to mitigate climate change and those that can help to reduce acid rain. This section provides a “mapping” indicating which measures useful for greenhouse gas reduction are also useful for reducing greenhouse gas emissions, and which have a neutral or negative impact. These measures are described in the third paper of this series (Technological Alternatives to Reduce Acid Gas and Related Emissions from Energy-Sector Activities in Northeast Asia), and are thus only summarized here. This section also discusses the potential impact on acid gas emissions of some of the carbon dioxide capture measures that have been proposed, and compares the relative cost per unit of emissions of the types of measures considered.
4.1. Measures That Reduce Emissions of Both Acid and Greenhouse Gases
Two classes of measures reduce emissions of both acid gases (sulfur oxides and nitrogen oxides) and greenhouse gases. These measures can be grouped as fuel switching and energy efficiencymeasures and technologies.
Fuel switching measures include changing from processes fueled with fossil fuels to those fueled by renewable fuels, and changing from equipment fired with coal or oil to equipment fired with natural gas. Fuel switching options for the utility sector in Northeast Asia include accelerating development of hydro, wind, solar, and nuclear generating facilities, as well as expanding the use of natural gas-fired generating equipment. In the industrial and commercial sectors (including multi-family residential buildings), conversion of boilers from coal or heavy oil to natural gas is an option. In some cases, industrial facilities may be able to make better use of biomass wastes as fuel. In the residential sector, savings in both acid gas and greenhouse gas emissions can be achieved by switching to natural gas stoves and heaters, from coal stoves to kerosene stoves, and from coal-fired equipment to electric equipment (depending on the source of the electricity). In the transport sector, continued shifts from coal- to oil-fired rail transport is an option for China (and possibly some areas of North Korea), and fuels derived from biomass or natural gas (for example, ethanol, methanol, or compressed natural gas) can be used in internal combustion engines.
With the exception of natural gas, fuel-switching options almost completely avoid the emissions of greenhouse gases (GHGs). Switching to natural gas reduces carbon emissions by on the order of 50 percent relative to coal-fired equipment of similar efficiency, and by on the order of 30 percent relative to oil-fired equipment. Fuel-switching measures that avoid combustion processes (such as hydro and wind power) also avoid acid gas emissions. Fuel-switching measures that include combustion usually avoid most sulfur oxide (SOx) emissions, but have impacts on NOx(nitrogen oxide) emissions that vary with the type of technology usedm.
Energy efficiency measures can reduce emissions of both acid gases and GHGs. These measures include replacing or refurbishing existing equipment to increase the efficiency with which energy servicesn are provided, making sure that new equipment or appliances are of higher than standard efficiency, reducing waste in manufacturing, and using more efficient ways of providing energy services (such as stressing development of mass transit systems rather than expanding the use of personal vehicles). For energy efficiency measures, reductions in acid gases and greenhouse gases are roughly in proportion to the amount of fuel saved, although measures that modify combustion conditions can have an additional impact on acid gas emissions.
4.2. Acid Gas Reduction Measures with Neutral or Negative Impacts on GHG Emissions
Three additional classes of measures for reducing acid gas emissions have generally neutral or negative impacts on GHG emissions. These are “end-of-pipe” measures, burner modificationmeasures and fuel improvement measures29.
End-of-pipe measures seek to remove SOx and/or NOx from the exhaust gases that remain after fuels are combusted. The measures available for utility and large industrial installations include post-combustion injections of sorbents (materials that absorb sulfur oxides, such as lime or limestone), wet or dry scrubbing of exhaust gases (again using calcium compounds such as lime or limestone to absorb SOx), selective non-catalytic and catalytic reduction (SCR and SNCR) for NOx removal (using urea or ammonia to reduce NOx to molecular nitrogen), and a range of combined SOx and NOx removal technologies that are mostly still under development. In the transport sector, catalytic converters of various types are used to reduce emissions of nitrogen oxides.
End-of-pipe removal technologies generally do not increase efficiency of combustion or trap carbon dioxide, so they have at best a neutral effect on CO2 emissions. More frequently, the use of end-of-pipe technologies tend to increase CO2 emissions slightly either A) because additional energy (usually electricity) is needed to operated the pollution control equipment; B) because carbon dioxide is released in the use or manufacture of the chemicals used to remove pollutants; or botho. The increase in CO2 emissions caused by the use of end-of-pipe acid gas removal techniques is typically on the order of a fraction of a percent to a few percent of total CO2emissions.
Burner modification technologies are of two types. The first involves injection of a SOx-absorbing substance into the combustion zone of utility or industrial-scale boilers and furnaces, and results in a slight increase in CO2 emissions for reasons similar to those noted above for end-of-pipe emissions. Atmospheric fluidized-bed burners often use limestone in the combustion “bed”. The carbonate portion of limestone (CaCO3) can be displaced by SOx during combustion, liberating a molecule of carbon dioxide, and slightly increasing the emissions of CO2 relative to conventional coal-fired equipment of the same efficiency. Other types of burner modifications-such as low-NOx burners for boilers and furnaces of all sizes, water-injection systems for combustion turbines, and emissions-reducing engine modifications for transport, power generation, and motive power applications-may either increase or reduce combustion efficiency slightly, resulting in a net decrease or increase, respectively, in greenhouse gas emissions.
The operation of fuel improvement technologies may or may not result in an increase in carbon dioxide emissions. Refinery improvements to reduce the sulfur content of petroleum products, for example, will typically result in a more energy-intensive refinery, all else being equal, and somewhat more fuel consumption per unit output will be requiredp. Cleaned, dry coal can be burned more efficiently, resulting in lower CO2 emissions per unit of useful energy (heat or electricity) output. The overall net GHG emissions resulting from coal cleaning, however, could be either negative or positive, depending on a number of factors:
- The energy required to grind, sift, and otherwise process coal during cleaning.
- The water and ash content of the cleaned coal, which will determine whether the cleaned coal will burn more or less efficiently than raw coal.
- The amount of methane released and escaping from the coal during the cleaning process, relative to the fraction of coal methane that would have been burned.
- The coal transport energy avoided when some of the ash and sulfur is left behind. Transport energy savings will in turn depend on the distance over which the raw and cleaned coal is transported and the type of transport (train or ship, for example) used.
- The extent and way in which coal cleaning wastes (which often retain a significant amount of heating value) are used.
4.3. Impact of Carbon-Removal Measures on Acid Gas Emissions
Carbon scrubbing typically involves the use of an absorbing material such as monoethanolamine (MEA) or other amines30, alcohols and glycols, hot potassium carbonate, ethers, or basic oxides to react with CO2 in the exhaust gas stream at (usually) low temperature and high pressure. The CO2-absorber complex is then removed from the gas stream as a liquid. The application of higher temperature and low pressure regenerates the absorbing material, and allows the recovery of nearly pure CO2q. Carbon scrubbing systems exact a considerable penalty on the overall efficiency an electricity generation system. Ishitani, Johannson, and their colleagues cite examples of an efficiency reduction from 41 percent (without CO2 scrubbing) to 30 percent (with scrubbing) for a conventional coal-fired electricity generation plant, and from 52 percent to 45 percent for a natural gas combined-cycle plant modified with scrubbing equipment31. Those authors calculate an emissions reduction cost of $150 US per tonne of carbon ($41 per tonne of CO2) for the coal plant example, and a cost of $210 US per tonne of carbon ($57 per tonne of CO2) for the combined-cycle plant.
Many of the proposed carbon-scrubbing systems (including the MEA system) use absorbing materials that are adversely affected by SOx. As a consequence, implementation of carbon scrubbing on coal plants will in most instances require the installation of advanced SOxscrubbing devices as well. A carbon dioxide scrubbing option that also serves to remove sulfur and nitrogen oxides, has been proposed. This system starts with the separation of oxygen from air, and burns fuel in a gas mixture composed of oxygen and CO2 recycled from combustion gases. In this way, a product gas of greater than 90 percent CO2 is theoretically produced, as opposed to typical 15 percent CO2 composition of typical exhaust gas32. The cost of this system has been estimated at $80 US per tonne of carbon avoided ($22 per tonne of CO2)33.
An additional option for CO2 scrubbing uses biological organisms, such as microalgae, as the carbon dioxide absorbers. Exhaust gas from combustion equipment would be bubbled through water containing algae and the micro-nutrients needed for algal growth. The CO2 (and NOx and SOx) in the exhaust gases would be taken up in the water, then incorporated into algal biomass. The biomass could be harvested and placed in long-term storage, utilized as food, or used in place of fossil fuels or feedstocks. As this system requires that the algae be exposed to the sun to grow, it would only be practical where large, flat sunny spaces are available around powerplants34.
Decarbonization of fuels prior to combustion involves the separation of the hydrocarbons in fuels into carbon dioxide and hydrogen. For coal, this can be done through “gasification” (breaking down carbon compounds in coal at high temperatures but with controlled supply of oxygen into smaller hydrocarbons, hydrogen, and carbon monoxide), followed by reaction with steam (H20) to convert the carbon monoxide (CO) to carbon dioxide (CO2) and hydrogen (H2). Carbon dioxide would be removed using a physical solvent, and routed to long-term storage or reuse. The resulting hydrogen-rich gas could be used in central or dispersed electricity generation using fuel cells, gas turbines, or more conventional plants, could be piped to residential, commercial, or industrial users, or could be compressed for use as a transport fuel. Comparing integrated-gasification combined-cycle (IGCC) plants with (37 percent efficiency) and without (44 percent efficiency) fuel decarbonization, Ishitani, Johannson, et al estimate an emissions reduction cost of$80 US per tonne of carbon avoided ($22 per tonne of CO2)35.
4.4. Summary-Evaluation of Measures that reduce GHG and/or Acid Gas Emissions

Table 4.1 (Above) presents a summary of the costs of reducing CO2 and acid gas emissions using the measures described above. Details of the assumptions used to prepare the estimates in Table 4-1 can be found in Annex B. End-of-pipe measures for NOx and SOx removal generally result in an increase in CO2 emissions relative to a plant without acid gas removal, thus the costs per tonne of CO2 removed appear negative. This is also the case for burner modifications designed to reduce SOx and NOx emissions, with the exception of IGCC systems, which have higher efficiencies than conventional coal plants and thus emit less CO2. The costs of CO2 emissions reduction via coal cleaning and other sulfur-removal technologies can vary depending on a variety of factors, as noted above. The fuel-switching measures evaluated have positive costs of CO2 removal. Of the options shown, wind power is the most cost-effective; switching to gas fuels, nuclear power, and hydroelectricity are somewhat more expensive, and solar photovoltaic power is the most expensive of the options evaluated.
Many of the energy-efficiency options evaluated save CO2 at modest or negative cost per tonne of carbon dioxide emissions avoided, that is, the value of fuel and other savings is greater than the cost of the measures. Carbon dioxide capture, even those processes that seem most promising at present, appear more expensive than most fuel-switching or energy-efficiency measures. Processes such as combustion with oxygen and recycled flue gases, and gasification with steam reforming to decarbonize fuels, hold promise for removing SOx and NOx along with CO2, but are still under development.
Overall, energy-efficiency and fuel-switching measures appear to offer the greatest promise for combined reduction of CO2 and acid gas emissions in Northeast Asia. As noted in the third paper in this series, however, rapidly expanding energy demand in the region will probably require that some of the other technologies shown in order to reduce SOx and NOx emissions to an environmentally acceptable level.
[ Return to Top ]
5. Promising Areas and Initiatives for United States-Japan and Regional Collaboration
5.1. Issues to Be Addressed and Opportunities for Collaboration
The countries of Northeast Asia currently produce somewhat under 20 percent of total world carbon dioxide emissions from energy-sector activities. This fraction is projected to rise to 23 percent by 2010, meaning that about one-third of the global growth in CO2emissions will be in the Northeast Asia region. This projected growth in emissions will be brought by explosive growth in fuels use, particularly in China and the Koreas. In addition, the limits to oil resources in China and the rest of the region means that imports of oil from outside Asia, principally from the Middle East, will grow substantially in the near future.
The combination of these issues present potentially massive environmental problems for the globe, the region, and the countries of the region. Growth in greenhouse gas emissions will eventually lead to a changed climate, which could have a variety of ecological, economic, and social impacts. Increased shipping of crude oil and refined products will make already crowded sea lanes in the region even more crowded, will increase the magnitude of accidental and routine spills, and may spur additional conflict over maritime resources.
A number of different options exist for reducing greenhouse gas emissions in the countries of the region. Adopting many of these options will also help to reduce emissions of acid gases. Fuel-switching (to natural gas and renewable fuels, for example, from coal and oil) and energy-efficiency measures are attractive means of reducing bothCO2 and SOx/NOx emissions at affordable (sometimes negative) costs. Implementing these options in the countries of the region will require that more developed nations (the United States, Japan, South Korea, and Chinese Taipei, for example) help to provide financing, technology, and training to the rapidly growing developing nations of the region (China, and potentially North Korea and Mongolia). The goal of this cooperation should be to assist the developing nations in building their energy sector “right the first time”, that is, in an environmentally sustainable fashion. Some of the different possibilities for collaboration between the countries of the region are described below. The global and regional consequences of not providing assistance to the rapidly growing economies of the region in a timely fashion may come sooner or may come later, but are bound to be severe by virtually any measure.
5.2. Collaboration Opportunities
Several generic types of opportunities for regional collaboration to help address global environmental issues are listed below. In many instances, these overlap with collaboration strategies that would be useful in reducing acid gas emissionsr.
5.2.1. Technology transfer
One of the key elements of implementation of fuel-switching and energy efficiency measures to reduce fossil fuel use and greenhouse gas emissions is technology transfer. At issue here are methods of transferring technologies from industrialized countries to the developing countries of the region. Applicable approaches to technology transfer include:
- Promote Joint Ventures and Licensing Agreements. Fuel-switching and energy-efficiency equipment could be met by domestic production through joint ventures and licensing agreements between governmental or private organizations in China and North Korea and foreign firms (especially, for Northeast Asia, South Korea, Japan, and the United States) with the necessary expertise to produce the needed equipment. For example, a wide variety of efficient industrial equipment and controls-including adjustable speed drives, higher-efficiency electric motors, and improved industrial boilers (including AFBC boilers)-have already been introduced to China through commercial channels and are being or will be manufactured there.
- Provide Information and General Training to Government Officials. Getting initiatives such as fuel-switching (particularly renewable resources) and energy efficiency programs off the ground in the developing countries of the region will be require the understanding and support of top government officials. Consequently, the advantages and local/international opportunities provided by the measures and technologies covered here must be impressed upon top officials, via study tours (for example, to existing installations elsewhere in the region), workshops and briefings. In each case, the participation of in-country counterpart organizations will help to reinforce the message.s
- Provide Specific Information and Training to Local Actors. Training of a very specific and practical nature must be provided to personnel at the local level. Examples here are factory energy plant managers, boiler operators in residential and commercial buildings, power plant and heating system operators, and new job classifications such as energy-efficiency and renewable energy equipment installers, energy auditors, and environmental officials. Specific training will also be needed to allow local personnel to install and maintain new technologies transferred from other countries.
- Provide Funding for Demonstration Projects. As part of encouraging joint ventures and local manufacture, regional cooperation in the setting up and funding of key demonstration projects would help to catalyze the uptake of key technologies. Here, the developed-country governments could provide seed money and serve as liaisons between developing-country institutions and private actors (for both financing and technology transfer).
- Support the Formation and Strengthening of Key Government Agencies. Developed-country organizations (both governmental and NGO) can help to set up and support agencies within the developing countries of the region to help institutionalize support for energy-efficiency, renewable technologies, and environmental management. This may include supporting officials in key parts of key ministries with training and information, providing (or providing assistance in obtaining) hardware and software to government laboratories, and assisting in the initial structuring and formation of agencies. Creating government agencies or corporations with their own budgets would signal a strong commitment to greenhouse gas emissions reduction on the part of the government, and would create a constituency within official circles for promoting environmentally-sustainable developments. Developed countries could also provide seed money for pools of funds for energy efficiency and fuel-switching project that government ministries, sectors, and/or individual enterprises would compete for. This kind of competition would stimulate awareness of the potential, methods, and technologies for reducing fossil energy use (and thus reducing emissions of CO2 and other GHGs) at all levels of government and private enterprise.
5.2.2. Planning assistance for development
In addition to catalyzing technology transfer, the developed countries of the region (and the United States) can assist developing countries by providing assistance to planners in government and private enterprises. This could include providing training, computer hardware and software, and information. Assistance is probably needed in a wide variety of disciplines, including urban planning, transport planning, energy planning (including supply infrastructure, end-use programs, and energy management), environmental restoration and conservation, pollution control, telecommunications, and industrial infrastructure. Assistance should focus on promotion of sustainable development within these disciplines, stressing especially the impacts of different plans on climate change, and vice versa.
5.2.3. Intra-regional planning for disaster prevention/response, and maintenance of ecosystems
Given the probable regional impacts of climate change, including increased frequency of storms and floods, regional coordination will be needed in planning for prevention of and response to natural disasters and major accidents, as well as to the maintenance of internationally-important ecosystems. Regional planning to prevent (or reduce the impact of) weather-related natural disasters would include coordination on water and soil management, including control of pollution of rivers and protection of watersheds against erosion. This coordination would necessarily include countries sharing land borders (such as North and South Korea, and North Korea, Russia, and China), but could also include countries such as Japan in advisory and helping roles. Coordinated planning is also needed to cope with disasters such as famines caused by drought or flood, major oil spills, or destructive storms.
The countries of the region share important marine ecosystems. The East Korean Sea/Sea of Japan is a prime example. These marine resources are depended upon for transport, food production, and environmental services (such as waste treatment) by several countries. Environmental pressure on these ecosystems will only increase as the impacts of climate change begin to manifest themselves, as energy and economic development in the region continues to meet the demands of an expanding human population. Protection of these ecosystems will necessarily require a coordinated effort by the countries of the region.
5.2.4. Agreements on trade policies
As imports of energy products to the region-particularly oil and oil products-expand, competition among fuel purchasers in the region for fuel contracts and transport facilities are likely to tighten. This means that regional coordination and trade agreements will likely need to be fashioned to assure the orderly sharing of resources such as sea lanes, and to ensure that all of the countries of the region have equal and open access to markets for imported fuels.
5.3. United States-Japan and Regional Initiatives to Help Mitigate the Impacts of Expanded Fuels Use in Northeast Asia
There is a strong overlap between initiatives helpful in curbing acid gas emissions and those needed to help reduce future emissions of greenhouse gases. Potential starting points for U.S.-Japan and regional collaboration and coordination in reducing the global and regional impacts of energy sector development in Northeast Asia might include:
- Create a clearinghouse for summary and detailed information on GHG reduction measures. Such a clearinghouse would provide access to up-to-date information on energy-efficiency, fuel switching, carbon capture, and other technologies and measures for reducing the impacts of expanded consumption of energy services. The information supplied would ideally include the costs, benefits, advantages, disadvantages, supplier contacts, and references to existing experience in the region with various measures and technologies. The U.S. and Japan (as well as other regional governments) could support the formation of such a clearinghouse, perhaps under the structure already set up by the APEC Energy Working Group for energy modeling activities. This effort should build on the substantial body of information already available. The clearinghouse could also augment other sources of support, software, and guidance for more detailed country- (or sub-country-) level assessments of opportunities for mitigation of greenhouse gas emissions and preparation of climate change adaptation studiest.
- Create (or strengthen) a trade liaison to promote the transfer of appropriate technologies. The U.S. and Japan could set up a specific trade office designed to facilitate the process of linking firms with emissions reduction technologies to sell or license with firms and other organizations in the region that need the technologies. The liaison office could help to provide contact information, translation, dispute mediation, and assistance in obtaining financing to potential trading partners. There is no particular reason why the same office could not handle technologies for acid gas emissions reduction, technologies to reduce GHG emissions, and the considerable range of technologies that accomplish both goals.
- Lead by example. Developing countries in the region are unlikely to adopt stringent and advanced energy-efficiency measures or invest in a substantial portfolio of renewable energy technologies unless the United States and Japan do the same. Promptly deciding on and successfully achieving their own stringent, enforceable national goals for emissions reduction would be one of the best levers that the and Japan can use in encouraging China and the Koreas to put a maximum effort into continuing their development in an environmentally sustainable manner.
- Promote and assist in applications that demonstrate promising technologies. This could include (but should not be limited to) participation in Joint Implementation (JI) projects, and in providing the equipment and expertise necessary to corroborate the net emissions reduction or carbon sequestration impacts of JI and GEF (Global Environment Facility) projects.
- Strengthen support for basic and applied research on energy efficiency and renewable technologies. The United States (especially) and Japan should increase funding for research and development on the most attractive/promising methods for GHG emissions reduction, including collaborative research activities that involve (and train scientists from) other countries in the region.
5.4. Selected Ongoing Joint Implementation Initiatives, and United States and Japanese Policies on GHG Emissions Targets
A great variety of different national and international organizations have been created to address the many issues of climate change, including setting up international agreements to reduce GHG emissions and mechanisms for cooperation and technology transfer between countries. At present, the Framework Convention on Climate Change (FCCC), drafted for the 1992 “Earth Summit” held in Rio de Janeiro, Brazil, has been signed by 165 countries, and has been ratified by all of the countries of the region36. Two Conferences of Parties (COP) to the FCCC have been held to try and reach agreement on international approaches to combat climate change. Although the parties to the FCCC have agreed to prepare greenhouse gas emissions inventories, and to study (on a country-by-country basis) ways in which GHG emissions can be reduced, no binding agreements on emissions reduction have been reached.
One form of international cooperation on climate change now under trial in a “pilot phase” is “Joint Implementation”, or JI. Under JI, countries can invest in GHG emissions reduction measures in other countries, and take credit for portions of the avoided emissions. This process has been generally favored by industrialized countries as a way promoting the reduction of GHG emissions in a globally cost-effective manner, but has been viewed with some skepticism by some developing nations, who tend to see it as a tool that allows industrialized countries to postpone needed changes in their own consumption patterns. The concept of JI has been internationally accepted for a pilot phase until the year 2000.
Japan has an active program of Joint Implementation. Japan’s industrial-sector JI investment project are approved through the Ministry of Trade and Industry (MITI), proposals initiated by NGOs are approved through the Environment Agency, and investments in forestry projects are approved through the Ministry of Agriculture, Forestry, and Fisheries. In all, 11 projects have been approved in the first round of the AIJ Japan program. Of these, ten are in other countries in Asia, and two are in the Northeast Asia region: “Energy conservation for coal in China’s coal industry” and “Efficiency improvements for small-scale coal boilers in China”. The United States currently has no approved JI projects in China, but has a reforestation project and a fugitive gas (methane) capture project in Russia37.
A second major international funding mechanism for climate change mitigation activities is the Global Environment Facility (GEF). The GEF (among other activities) provides grants (through UNDP) and loans (through the World Bank) to finance activities designed to reduce GHG emissions in developing countries and in economies in transition. GEF projects in China include “Efficient Industrial Boilers”, and “Promoting Methane Recovery and Utilization from Mixed Municipal Refuse”.
The United States government, in a recent change of policy, has announced its support for a binding global agreement to reduce GHG emissions from industrialized nations, but has not yet specified either a specific target or timetable for emissions reduction. The United States position leaves it up to individual countries as to how targets would be met. In a statement in July, United States Undersecretary Timothy Wirth stated that the United States would press for an agreement on GHG reductions by the end of 199738.
The current Japanese position on emissions reduction targets is similar to that of the United States. While having in principal accepted the need for industrialized countries to limit GHG emissions, Japan has not endorsed a specific goal or date for emissions reduction
Footnotes
a. As noted, figures in this table are for 1995 for all countries except Hong Kong, Mongolia, and North Korea. 1995 fuels use in Hong Kong and Mongolia was probably somewhat higher than the 1992 values shown, while energy consumption in North Korea was probably less than the 1990 estimate in the table.
b. Primary energy use includes fuel used in conversion and transformation processes such as coal cleaning, electricity generation, and oil refining.
c. That is, excluding those fuels that are typically not (at present) formally traded in international markets, such as biomass for domestic cooking.
d. In many, but not all cases, more than one scenario was prepared by the sources cited.
e. “Ch. Taipei/Hong Kong” is Chinese Taipei and Hong Kong combined. See endnote for sources used for this table. Return to Table 1-2
f. The emissions scenario shown here is, furthermore, lower than some of the other business-as-usual energy use scenarios prepared by different researchers. (See Table 1-2.)
g. A blowout occurs when the well-head where the flow of oil from a well is controlled fails catastrophically, allowing oil, driven by high gas and/or liquid pressures in the well, to flow out of the well and into the surrounding environment.
h. Phytoplankton is a name used to denote the class of microscopic-to-barely-visible aquatic plants that are the base of much of the ocean’s food chain. Phytoplankton include marine algae, diatoms, and other photosynthetic organisms. Zooplankton are the micrometer-to-millimeter-size animals that, like the phytoplankton they feed on, float along near the surface of the ocean. Zooplankton include the larval and juvenile (young) stages of a number of commercially and biologically important organisms, such as crustaceans (e.g. shrimp and crab) and mollusks (shellfish). Zooplankton in turn serve as food for small fish and other animals.
i. Most of the tanker traffic headed for the region will need to pass through the straits that lie between Malaysia/Singapore and Indonesia. Traffic headed for Southern and Eastern China, the Koreas, and Japan usually passes through the Formosa or Luzon Straits, the East China Sea, and often the Korea Strait to service tanker terminals on the east coasts of South Korea and Japan.
j. For example, elevated temperatures could cause the West Antarctic ice sheets to slide into the sea at an increasing rate, which would produce a quicker contribution to sea level than if the sheets simply melted in situ. There may be a significant lag in the melting or movement of ice sheets as a result of elevated global temperatures, in other words, sea level rise could continue long after temperature changes have stopped.
k. A particular example here is the recent flooding in North Korea. In this case, the lack of forest cover (due to a combination of the impacts of war and inadequate soil conservation) undoubtedly played a role in exacerbating the impacts of severe storms. Though the storms of 1995 and 1996 may not (or may) have been altered by climate change, their devastating impacts serve as a warning for what could happen in the region when the effects of a changing climate impinge upon areas already under ecological stress.
l. The reader is encouraged to consult the work of Working Group III of the IPCC (Climate Change 1995: Economic and Social Dimensions of Climate Change, Contribution of Working Group III to the Second Assessment Report of the Intergovernmental Panel on Climate Change. (Published for the IPCC by Cambridge University Press, New York, NY, USA. 1996.) for more information on this topic.
m. Fuel-switching measures cannot, however, automatically be assumed to reduce GHG emissions. Emissions from the full fuel cycle must be evaluated before one can definitively state that a reduction will occur when a measure is implemented. For example, the higher potency of methane (relative to CO2) as a GHG means that switching from oil to natural gas, could actually have a net negative impact on climate if the gas is distributed through leaky pipelines.
n. Energy services are the services that fuel use provides. Examples are the production of a tonne of steel, the cooking of a meal, or transport of a passenger one kilometer. The same energy service can usually be provided using different types and amounts of fuel depending on the technology used. These options provide opportunities to increase energy efficiency (and reduce fuel use, GHG emissions, and acid gas emissions) without reducing the amount of energy services provided.
o. For example, CO2 is released during the manufacturing of calcium oxide and calcium hydroxide, two common chemicals used in scrubbers. CO2 is also released when limestone (CaCO3), reacts with SOx to form CaSO3 and CaSO4, and when urea reacts with NOx in SCR or SNCR systems.
p. The magnitude of the additional energy required to produce lower-sulfur products may vary with the types of equipment used. Since refining losses in general are on the order of 4 to 7 percent of crude oil energy input, additional CO2 emissions due to fuel improvement are likely to be on the order of a percent of the CO2 ultimately released when the fuels are burned.
q. The carbon dioxide recovered can also be used as a base for manufacturing chemicals, substituting for fossil fuel-based feedstocks (Aresta, M., “Carbon Dioxide Recovery and Utilization in the Synthesis of Fine Chemicals and Fuels: A Strategy for controlling the Greenhouse Effect”, In Organization for Economic Co-operation and Development/International Energy Agency (OECD/IEA), Energy Technologies for Reducing Emissions of Greenhouse Gases, Volume 1. OECD/IEA, Paris, France, 1989.)
r. Descriptions of some of these strategies have been adapted from Von Hippel and Hayes, 1995.
s. Bringing together a large number of relatively small-scale demand side projects under the umbrella of a single program, for example, may also go some way towards mitigating the bias towards large-scale projects.
t. Examples of existing GHG mitigation assistance include the United States Country Studies program, the country-level work of the UNEP (United Nations Environment Programme) Collaborating Centre on Climate Change, the UNDP (United Nations Development Programme) ALGAS (“Development Of Least-Cost Greenhouse Gas Emission Reduction Plans In Asia”) project, and bilateral initiatives by the U.S. Agency for International Development and others.
Endnotes
1. British Petroleum Co., World Energy Statistics. Electronic version, spreadsheet “fuelcons.wks”. British Petroleum Co., London, UK. 1996.
2. United Nations, 1992 Energy Statistics Yearbook. United Nations, New York, NY, USA. 1994.
3. Von Hippel, D., and P. Hayes, The Prospects for Energy Efficiency Improvements in the Democratic People’s Republic of Korea: Evaluating and Exploring the Options. Nautilus Institute Report, Nautilus Institute for Security and Sustainable Development, Berkeley, California, USA. 1995.
4. Sinton, J., editor, China Energy Databook 1996 Edition, Revised January 1996. Lawrence Berkeley National Laboratory, University of California, Berkeley, California, USA. LBL-32822.Rev.3. UC-900. 1996.
5. Korea Energy Economics Institute (KEEI), Yearbook of Energy Statistics, 1996. KEEI, Seoul, ROK. 1996.
6. Ministry of International Trade and Industry/Agency of Natural Resources and Energy (MITI/ANRE), Energy in Japan, Facts and Figures. MITI, Tokyo, Japan. May, 1995.
7. Von Hippel and Hayes, 1995, ibid.
8. Population figures from United Nations, Statistical Yearbook for Asia and the Pacific, 1994. UN Economic and Social Commission for Asia and the Pacific (UN-ESCAP), Bangkok, Thailand. 1995.
9. US Department of Energy, Energy Information Administration (US DOE EIA), International Energy Outlook, 1996. US DOE, Washington, D.C., USA. 1996; Korea Energy Economics Institute (KEEI), [Energy Scenarios to 2030–Document in Korean]. KEEI, Seoul, ROK. November, 1994; Fujime, K., “Long-Term Energy Supply/Demand Outlook for Asia APEC Nations”. Energy in Japan, January 1996. The Institute of Energy Economics, Japan (IEEJ), Bimonthly Report No. 137. 1996; Fesharaki, F., A.L. Clark, and D. Intarapravich, editors, Pacific Energy Outlook: Strategies and Policy Imperatives to 2010. East-West Center Program on Resources: Energy and Minerals. East-West Center, Honolulu, HI, USA. March, 1995; RAINS-Asia Software; Working Group on Energy Strategies and Technologies of The China Council for International Cooperation on Environment and Development (CCICED), Alternative Energy Strategy Scenarios for China. Prepared by the Institute for Techno-Economics and Energy Systems Analysis (ITEESA), Tsinghua University, Beijing, and China Integrated Resource Planning Promotion Network (IRPPN) International Energy Initiative (IEI). Beijing, China. April, 1996; The World Bank, China: Issues and Options in Greenhouse Gas Control, Summary Report. The World Bank, Industry and Energy Division, Washington, D.C., USA. December, 1994. .
10. Fujime, K. (1996), ibid; and Fesharaki et al (1995), ibid.
11. Intergovernmental Panel on Climate Change (IPCC), Climate Change 1995: The Science of Climate Change, Contribution of Working Group I to the Second Assessment Report of the Intergovernmental Panel on Climate Change. Published for the IPCC by Cambridge University Press, New York, NY, USA. 1996.
12. Fujime, 1996, ibid.
13. Fesharaki et al, 1995, ibid.
14. From Lazarus, M., and D. Von Hippel, A Guide to Environmental Analysis for Energy Planners. Stockholm Environment Institute-Boston (SEI-B) Report, SEI-B, Boston, MA, USA. 1995. Original source, Source: M.H. Katsouros, Chapter 5 in Hollander, J.M., Editor, The Energy-Environment Connection. Island Press, Washington, D.C., USA. 1992. Return to Table 2-1
15. Valencia, M.J., “Northeast Asian Marine Environmental Quality and Living Resources: Transnational Issues for Sustainable Development”. In The Role of Science and Technology in Promoting Environmentally Sustainable Development, Proceedings of the Science and Technology Policy Institute and United Nations University Joint Seminar, Seoul, Korea, June 13 – 15, 1995.
16. Valencia, M.J., and J.P. Dorian, “Multilateral Cooperation in Northeast Asia’s Energy Sector: Possibilities and Problems”. Prepared for Energy Workshop of Northeast Asia Cooperation Dialogue V, sponsored by the Institute of Foreign Affairs and National Security, Seoul, ROK. September 11-12, 1996.
17. For example, Chapters 6 through 10 in Intergovernmental Panel on Climate Change (IPCC), Climate Change 1995: The Science of Climate Change, Contribution of Working Group I to the Second Assessment Report of the Intergovernmental Panel on Climate Change; Chapters 1 through 12 in, Climate Change 1995: Impacts, Adaptations, and Mitigation of Climate Change: Scientific-Technical Analyses, Contribution of Working Group II to the Second Assessment Report of the Intergovernmental Panel on Climate Change; and Chapters 6 to 10 in Climate Change 1995: Economic and Social Dimensions of Climate Change, Contribution of Working Group III to the Second Assessment Report of the Intergovernmental Panel on Climate Change. All three volumes were published for the IPCC by Cambridge University Press, New York, NY, USA. 1996.
18. Von Hippel, D.F., “Climate Change and Associated Sea Level Rise: Potential Impacts, Resources, and Policy”. In The Role of Science and Technology in Promoting Environmentally Sustainable Development, Proceedings of the Science and Technology Policy Institute and United Nations University Joint Seminar, Seoul, Korea, June 13 – 15, 1995.
19. Kattenberg, A., et al, “Climate Models – Projections of Future Climate”. Chapter 6 in Intergovernmental Panel on Climate Change (IPCC), Climate Change 1995: The Science of Climate Change, Contribution of Working Group I to the Second Assessment Report of the Intergovernmental Panel on Climate Change. Published for the IPCC by Cambridge University Press, New York, NY, USA. 1996.
20. Haq, Bilal U., Sea Level Rise and Coastal Subsidence: Rates and Threats. Land, Water and Natural Habitats Division, Environment Department, The World Bank, Washington D.C., USA. October 1994.
21. Warrick, R.A., et al, “Changes in Sea Level”. Chapter 7 in Intergovernmental Panel on Climate Change (IPCC), Climate Change 1995: The Science of Climate Change, Contribution of Working Group I to the Second Assessment Report of the Intergovernmental Panel on Climate Change. Published for the IPCC by Cambridge University Press, New York, NY, USA. 1996.
22. The World Bank, China: Issues and Options in Greenhouse Gas Control, Potential Impacts of Climate Change on China. Subreport Number 9. The World Bank, Industry and Energy Division, Washington, D.C., USA. December, 1994.
23. Nicholls, R.J., “Synthesis of Vulnerability Analysis Studies”, in Proceedings of WORLD COAST ’93, Coastal Zone Management Centre, Rijkswaterstaat, The Netherlands. April, 1994.
24. Kattenberg, A., et al, 1996, ibid.
25. The World Bank, China: Issues and Options in Greenhouse Gas Control, Potential Impacts of Climate Change on China. Subreport Number 9. The World Bank, Industry and Energy Division, Washington, D.C., USA. December, 1994.
26. Topping, John C. Jr.; Quershi, Ata and Samuel A. Sherer. Implications of Climate Change for the Asian Pacific Region, Nagoya, Japan: Japan Environment Agency, December 1990. Page 11.
27. Dr. Ata Aureshi, ed. Second Asia Pacific Seminar on Climate Change. Bangkok: Japan Environment Agency and Asian Development Bank, 29-31 March 1993.
28. Dr. Ata Aureshi, ed. Second Asia Pacific Seminar on Climate Change. Bangkok: Japan Environment Agency and Asian Development Bank, 29-31 March 1993. “Latest Findings and Current Work of the Intergovernmental Panel on Climate Change”, B. Callander, page 43.
29. Tavoulareas, E.S., and J-P. Charpentier, Clean Coal Technologies for Developing Countries. World Bank Technical Paper Number 286, The World Bank, Washington D.C., USA. 1995.
30. Blok, K., C.A. Hendriks, and W.C. Turkenburg, “The Role of Carbon Dioxide Removal in the Reduction of the Greenhouse Effect”. In Organization for Economic Co-operation and Development/International Energy Agency (OECD/IEA), Energy Technologies for Reducing Emissions of Greenhouse Gases, Volume 2. OECD/IEA, Paris, France, 1989.
31. Ishitani, H., and T.B. Johansson, Editors, “Energy Supply Mitigation Options”. Chapter 19 in Climate Change 1995: Impacts, Adaptations and Mitigation of Climate Change: Scientific-Technical Analyses. Published for the Intergovernmental Panel on Climate Change (IPCC) by Cambridge University Press, New York, NY, USA. 1996.
32. Wolsky, A.M., and C. Brooks, “Recovering CO2 from Large Stationary Combustors”. In Organization for Economic Co-operation and Development/International Energy Agency (OECD/IEA), Energy Technologies for Reducing Emissions of Greenhouse Gases, Volume 2. OECD/IEA, Paris, France, 1989.
33. Ishitani, H., and T.B. Johansson, 1996, ibid.
34. Von Hippel, D.F., An Analysis of an Ethanol-Producing Solar Bioconversion System Using the Microalga Dunaliella as the Biomass Crop. Doctoral Dissertation, University of California/Berkeley Energy and Resources Group. 1987.
35. Ishitani, H., and T.B. Johansson, 1996, ibid.
36. United Nations Climate Change Convention Secretariat, UNEP/WMO (World Meteorological Organization) IPCC, and the UNEP/WMO InformationUnit on Climate Change (IUCC), United Nations Climate Change Bulletin, 1st Quarter, 1995.
37. Edison Electric Institute, JI Online. World-wide web site on Joint Implementation sponsored by the International Utility Efficiency Partnerships program of Edison Electric Institute. 1996.
38. Willams, F., “US Seeks Target for Reducing Greenhouse Gases”. Financial Times, July 18, 1996, page 7.