by David F. von Hippel and Peter Hayes
15 April 2014
This Special Report was originally published as a Working Paper 2014-2 by the Center for Energy, Governance and Security at Hanyang University, Seoul.
I. INTRODUCTION
During the decade of the 1990s, and continuing into the second decade of the 21st century, a number of issues have focused international attention on the Democratic Peoples’ Republic of Korea (DPRK). Most of these issues—including nuclear weapons proliferation, military transgressions, provocations, and posturing, economic collapse, transboundary air pollution, food shortages, floods, droughts, tidal waves, and, most recently the death of DPRK leader Kim Jong Il and the passing of the leadership mantle to the third generation of the Kim dynasty in Kim Jong Un—have their roots in a complex mixture of Korean and Northeast Asian history, global economic power shifts, environmental events, and internal structural dilemmas in the DPRK economy. Energy demand and supply in general—and, arguably, demand for and supply of electricity in particular—have played a key role in many of these high-profile issues involving the DPRK, and have played and will play (and are playing, as of June, 2013) a central role in the resolution of the ongoing confrontation between the North and much of the international community over the DPRK’s nuclear weapons program.
It is unclear as of this writing whether the Six-Party Talks process for addressing DPRK nuclear weapons and related issues, a process that have been moribund for some years, will be revitalized or will be replaced in the near or more distant future with a similar process, in all likelihood involving many or all of the same actors (and perhaps others). As long as the DPRK’s nuclear weapons issue remains unresolved (or at least in the process of resolution), external powers will continue to squeeze the North with sanctions, and external aid will be minimal. What is clear, however, is that energy sector issues will continue to be a key to the resolution of the crisis, as underscored by the formation of a Working Group under the Six-Party Talks that was (and nominally, still is) devoted to the issue of energy and economic assistance to the NP. Carefully-designed energy sector assistance projects of modest scale, particularly those that combine economic development and humanitarian focus, should be sought out, designed, and, as soon as conditions permit, undertaken. The Republic of Korea (ROK) is in a unique position to develop and deliver such projects, and it stands to gain considerably if such projects are successful. For the ROK, engagement with the DPRK on energy issues offers many possible benefits, including an opportunity to improve its relationship and understand its neighbor, a chance to potentially improve the environment which the two nations share, an opening for the ROK to invest in and benefit from the development of the North’s economy, opportunities to potentially link its energy system with potential resource suppliers, most notably the Russian Far East, and an opportunity to improve the ROK’s security by promoting peace on the Korean Peninsula.
It is critically in the interest of the Republic of Korea and its international allies to know as much as is possible to know about the energy resources and needs of the DPRK, so as to be ready, when the opportunities arise, to assist the people of the DPRK in energy and economic redevelopment that, while it will most certainly not be either easy, straightforward, or inexpensive, is as smooth and as sustainable as possible. To that end, this Working Paper provides a summary of what is known and/or inferred about the status of the DPRK energy sector, including the North’s endowment of energy resources.
In the remainder of this introductory section, we provide a brief overview of the current status and recent past of the DPRK energy sector, including ongoing problems in the energy sector.
II. SPECIAL REPORT BY DAVID VON HIPPEL AND PETER HAYES:
1.1. The DPRK Energy Sector: Status and Problems
This Working Paper provides an overview of the demand for and supply of the various forms of energy used in the DPRK in 2010, the most recent year for which an analysis of energy supply and demand in the DPRK have been carried out by Nautilus. By way of historical background, as an indicator of the genesis of DPRK energy sector problems and of energy sector trends in the DPRK, we also provide selected estimates for energy supply and demand in the DPRK in several years during the last two decades:
- 1990, the year before much of the DPRK’s economic and technical support from the Soviet Union was withdrawn;
- 1996, thought by some to be one of the most meager years of the difficult economic 1990s in the DPRK; and
- 2000, a year that has been perceived by some observers as a period of modest economic “recovery” in the DPRK, as well as a marker of the period before the start, in late 2002, of a period of renewed political conflict between the DPRK, the United States, and it neighbors in Northeast Asia over the DPRK’s nuclear weapons development program; and
- 2005, also a year in which observers have again noted an upward trend in some aspects of the DPRK economy, as well as the most recent year for which any published estimates on the DPRK’s energy sector and economy are available.
- 2008, the last year in which the DPRK received heavy fuel oil from its negotiating partners in the Six-Party talks; and
- 2009 and 2010, the most recent years for which significant data relevant to the DPRK energy situation are available.
In the two-plus decades since 1990, the effective end of the Cold War and the substantial withdrawal of economic aid from the former Soviet Bloc, together with other world and regional events, have set the DPRK economy in what most observers agree is either a downward spiral or (at best) stagnation, with years of modest improvement interspersed with years in which economic conditions worsen.
Key economic resources for the DPRK, as elaborated later in this report, include:
- A well-trained, disciplined work force;
- An effective system for dissemination of technologies;
- The ability to rapidly mount massive public works projects by mobilizing military and other labor; and
- Extensive reserves of minerals and significant other natural resources.
The DPRK economy has been stagnating since 1990 as a result of a number of factors, including:
- Foreign debt incurred in purchasing industrial equipment and oil.
- The decline and eventual collapse of the Soviet Union, and the resulting reduction in Soviet/Russian aid to the DPRK and in markets for many DPRK-made goods.
- Poor grain harvests, particularly in the early 1990s, due to a combination of weather-related factors, lack of fuel and fertilizer, and environmental degradation.
- Economic isolation due to international sanctions related to its nuclear weapons programs and related issues.
- Natural disasters, including floods, severe storms, tidal surges, and droughts.
Although the DPRK has raw materials—particularly minerals—that are of interest to trading partners, it has produced few finished goods (with the exception of armaments) that are of high enough quality to attract international buyers. The DPRK’s major trading partners as of 1990 were China, Russia, Iran (reportedly trading oil for armaments), and Japan. The DPRK at that time had limited trade with other Asian nations, as well as, on and off, with some European and other nations. The value of imports to North Korea already exceeded that of exports by $600 million in 1990. Trade even in 1991—both exports and imports—was down markedly from 1990 as a result of the dissolution of the USSR[1].
The economic, if not social and political, landscape in the DPRK changed markedly during the 1990s. In the early 1990s, the DPRK government openly admitted the country’s failure to achieve the economic goals of its most recent seven-year plan[2]. Although little data have been available from inside the DPRK, information from outside observers of the country indicates that the North Korean economy was at best stagnating, and most probably in considerable decline, through the mid-1990s[3]. This economic decline has been both a result and a cause of substantial changes in energy demand and supply in DPRK over the last decade. Observers of the DPRK economy have suggested that at least a modest improvement took place in the years around 2000—ROK sources, for example, estimated that the DPRK economy grew approximately 6 percent in 1999, and another 1.3 percent in 2000[4]. A more recent estimate by the Bank of Korea showed the DPRK economy (as measured by GDP) growing at 0.4 percent in 2000, and by amounts varying from 1.2 to 3.8 percent annually from 2001 through 2005, followed by a period of slow decline (-0.5 to -1.2 percent/yr) in all years from 2006 through 2010 except 2008, when growth of 3.1 percent was estimated, meaning essentially zero overall growth in the DPRK economy from 2006 through 2010[5]. Other observers, however, tended to argue that most of any economic upturn in the DPRK economy in the years 2000 through 2005 appears to have been driven by food and other aid from abroad, inputs that have diminished over the last few years[6].
Among the energy-sector changes on the supply side in the DPRK since 1990 have been:
- A vast drop in imports of fuels (particularly crude oil and refined products, but coal and coke as well) from the Soviet Union and Russia. An index of these imports declined from a value of over 140 in 1987 to 8.7 in 1993, and crude oil imports from Russia in 1993 were on the order of one-tenth what they were in 1990[7], and have fallen to practically zero since, though more modest supplies of refined oil products continue to be imported into the DPRK from Russia, and there have been recent, though not yet verified, reports of some crude oil imports from Russia.
- A steady decline in the exports of coal to China between 1988 and 1993, with the value of those exports receding in 1993 to approximately a tenth what they were in 1990. This fall may have been a sign of reduced output in the DPRK coal industry, particularly as coal imports to DPRK from China remained near the same level (in dollar terms) from at least 1982 through the early 1990s[8].
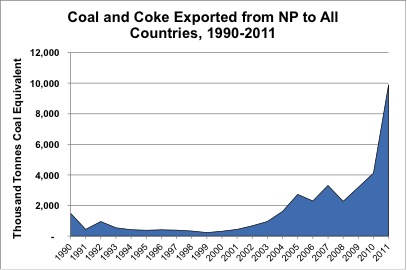
- In recent years, however, the exports of coal and other raw mineral products (largely iron and steel scrap and metals ores) to China have increased dramatically, with coal exports to China reaching 2.8 million tonnes in 2005 and 4.6 million tonnes in 2010, followed by a vast increase to 11.2 million tonnes in 2011[9]. This is one manifestation of a recent increase in investment in the DPRK by Chinese businesses, particularly in the raw materials sectors, but also, to some degree, in manufacturing[10].
Oil import restrictions have reduced the availability of refined products in the DPRK. These problems arose partly (if indirectly) from economic sanctions related to the nuclear proliferation issue (see below), and partly from North Korea’s inability to pay for oil imports with hard currency. This lack of fuel, particularly for the transport sector, has probably contributed to the DPRK’s economic malaise since 1990. Another factor contributing to the decline in the country’s economic fortunes has been the inability (again, partly due to lack of foreign exchange, and partly due to Western economic sanctions) to obtain key spare parts for factories, including factories built with foreign assistance and/or technology in the 1970s[11]. Also, as mentioned above, there has been, in the years since 1990, a virtual halt in economic aid, technical assistance and barter trade on concessional or favorable terms from Russia and other Eastern European nations. This reduction, coupled with a sharp decline in similar types of assistance from China (including, in the years between 1995 and 2000, a more than 50 percent reduction in crude oil shipments to the DPRK), had resulted in a total estimated loss of aid to the DPRK economy of more than $ US 1 billion per year[12] by the mid-1990s. The DPRK’s trade deficit as of 2000 stood at $US 856.88 million[13], remained at near one billion dollars through 2004[14], and was over one billion dollars in 2009 and 2010[15], despite increasingly lucrative exports to China.
The economic difficulties mentioned above have been exacerbated by an untimely combination of climatic events. The early 1990s saw a series of poor grain harvests in the DPRK. Compounding these difficulties, 1995 and 1996 brought severe flooding to many areas of the DPRK, washing away topsoil from areas at higher elevation, and burying many areas of crucial low-lying farmland in tens of centimeters of silt or sand[16]. An additional blow to DPRK agricultural production was dealt by a tidal wave, caused by a typhoon at sea, that swept over and heavily damaged a long dike on the west coast of the DPRK in September of 1997, inundating hundreds of thousands of hectares of rice fields. The combined effects of flooding and poor harvests—even before the damage from the tidal wave was factored in—were a food shortage severe enough to spur the DPRK government to take the unusual step of publicly requesting food aid from the international community. Additional floods and tidal waves in several areas of the country caused damage to agricultural areas in 2006, and left tens of thousands of residential homeless. This cycle of misery caused by flooding returned to the DPRK in the summers of 2007, 2010, and, most recently, 2011[17].
Many observers of the DPRK, particularly in areas away from the major cities, report that official rations are far from sufficient to meet dietary requirements, that people are supplementing their rations with not only production of private gardens but wild foods, tree-bark, grass, and whatever other semi-edible materials they can obtain. Apart from the overriding human concerns associated with the food shortage, the slow starvation of the DPRK populace cannot help but decrease economic production still further, as poorly-fed people are less capable of work[18]. The flooding of 1995 and 1996 damaged an unknown number of irrigation dams and canals. Additional flooding in 1999 damaged both agricultural and industrial areas, as did flooding in more recent years. Cumulative damage to and “wearing out” of agricultural and other infrastructure, coupled with damage to farmlands (both related to climatic events and long-term degradation), means that it may be years before the DPRK is able to grow enough food to feed its populace again, even if the required agricultural inputs (fertilizer, machinery, and fuel for the machinery) do become more available.
1.2. Summary of the Overall Energy Situation in the DPRK: History and Problems
Overall energy use per capita in the DPRK as of 1990 was relatively high, primarily due to inefficient use of fuels and reliance on coal. Coal is more difficult to use with high efficiency than oil products or gas. Based on our estimates, primary commercial energy[19] use in the DPRK in 1990 was approximately 70 GJ per capita, approximately three times the per capita commercial energy use in China in 1990, and somewhat over 50 percent of the 1990 per capita energy consumption in Japan (where 1990 GDP per-capita was some ten to twenty times higher than the DPRK). This sub-section provides a brief sketch of the DPRK energy sector, and some of its problems. Much more detailed reviews/estimates of energy demand and supply in the DPRK in 1990, 1996, and particularly in 2000, 2005, and 2008 through 2010, are provided in later chapters of this report.
The industrial sector is the largest consumer of all commercial fuels—particularly coal—in the DPRK. The transport sector consumes a substantial fraction of the oil products used in the country. Most transport energy use is for freight transport; the use of personal transport in the DPRK is very limited. The residential sector is a large user of coal and (in rural areas, though more recently, reportedly, in urban and peri-urban areas as well) biomass fuels. The military sector (by our estimates) consumes an important share of the refined oil products used in the country. The public/commercial and services sectors in the DPRK consume much smaller shares of fuels supplies in the DPRK than they do in industrialized countries, due primarily to the minimal development of the commercial sector in North Korea. Wood and crop wastes are used as fuels in the agricultural sector, and probably in some industrial subsectors as well.
Key energy-sector problems in the DPRK include:
- Inefficient and/or decaying infrastructure: Much of the energy-using infrastructure in the DPRK is reportedly (and visibly, to visitors to the country) antiquated and/or poorly maintained. Buildings apparently lack significant, and often any, insulation, and the heating circuits in residential and other buildings for the most part apparently cannot be controlled by residents. Industrial facilities are likewise either aging or based on outdated technology, and often (particularly in recent years) are operated at less-than-optimal capacities (from an energy-efficiency point of view).
- Suppressed and latent demand for energy services: Lack of fuels in many sectors of the DPRK economy has apparently caused demand for energy services to go unmet. Electricity outages are one obvious source of unmet demand, but there are also reports, for example, that portions of the DPRK fishing fleet have been idled for lack of diesel fuel. Residential heating is reportedly restricted in the winter (and some observers report that some public-sector and residential buildings have not received heat at all in recent years) to conserve fuel, resulting in uncomfortably cool inside temperatures.
The problem posed by suppressed and latent demand for energy services is that when and if supply constraints are removed there is likely to be a surge in energy (probably particularly electricity) use, as residents, industries, and other consumers of fuels increase their use of energy services toward desired levels. (This is a further argument, as elaborated later in this report, for making every effort to improve the efficiency of energy use in all sectors of the DPRK economy as restraints on energy supplies are reduced.)
- Lack of energy product markets: Compounding the risk of a surge in the use of energy services is the virtual lack of energy product markets in the DPRK. Without fuel pricing reforms, there will be few incentives for households and other energy users to adopt energy efficiency measures or otherwise control their fuels consumption. Recent years have seen limited attempts by the DPRK government to reform markets for energy products. Some private markets exist for local products like firewood, and some commercial fuels have in recent years reportedly been traded “unofficially” (on the black market), but for the most part, energy commodity markets in the DPRK essentially do not exist[20]. Energy consumers are also unlikely, without a massive and well-coordinated program of education about energy use and energy efficiency, to have the technical know-how to choose and make good use of energy efficiency technologies, even when and if such technologies are made available.
The DPRK’s energy sector needs are vast, and at the same time, as indicated by the only partial listing of problems many of these needs are sufficiently interconnected as to be particularly daunting to address. The DPRK’s energy sector needs include rebuilding/replacement of many of its power generation and almost all of its substation equipment, repair, replacement, and/or improvement of coal mine production equipment and safety systems, updating of oil refineries, improvement or replacement of most if its energy-using equipment, including coal-fired boilers, electric motors and drives, transport systems, and many other items, modernization of energy use throughout the country, rebuilding of the DPRK forest stocks, and a host of other needs. As one example of the interrelations of energy problems in the DPRK, renovating the DPRK’s coal mining sector is made more difficult because coal mines lack electricity due to electricity sector problems, and electricity generators in some cases have insufficient coal to supply power demand because of coal mine problems and problems with transporting coal to power plants.
2. Methods Used in Preparing Energy Sector Supply and Demand Estimates
The DPRK energy sector supply and demand estimates summarized in this Working Paper have as their foundation early Nautilus research, funded by the W. Alton Jones Foundation, which culminated in a 1995 report entitled The Prospects for Energy Efficiency Improvements in the Democratic People’s Republic of Korea: Evaluating and Exploring the Options, plus further research in 1997, funded by the Northeast Asia Economic Forum/East-West Center, that produced Demand and Supply of Electricity and Other Fuels in the Democratic Peoples’ Republic of Korean (DPRK). In our 1995 work, we prepared an estimated energy supply/demand balance for the DPRK for the year 1990 that synthesized the information available to us on the North Korean economy and energy sector. In the 1995 report, the energy balance results were used to estimate the (by any measure, considerable) potential for energy-efficiency improvements in the DPRK. Our 1997 work produced an estimated energy balance for 1996, and used it as the starting point for quantitative energy “scenarios” for the DPRK for 2000 and 2005. Our 2002/2003 report, The DPRK Energy Sector: Estimated Year 2000 Energy Balance and Suggested Approaches to Sectoral Redevelopment, prepared with funding from and in collaboration with the Korea Energy Economics Institute, updated our analysis to a 2000 “base year”, and our 2007 report, Fueling DPRK Energy Futures and Energy Security: 2005 Energy Balance, Engagement Options, and Future Paths, provided a further update to a 2005 base year. Finally, our report Foundations of Energy Security for the DPRK: 1990-2009 Energy Balances, Engagement Options, and Future Paths for Energy and Economic Redevelopment [21] updated our assessment to provide energy balances for the years 2008 and 2009.
Although the process that we followed in evaluating energy supply and demand in the DPRK is bound to produce energy balances that “fit” the DPRK poorly in some areas, it is our hope that in future collaboration with DPRK energy experts we will be able to use the balance described and presented below as a starting point to develop better information for use by both the international community and by the DPRK itself. Moreover, as the balance is built up from many independent observations, estimates, and assumptions, we feel that the probability is reduced that any one off-base assumption or erroneous piece of data has considerably altered the overall accuracy of the assessment.
It should be noted that other estimates of DPRK energy supply demand balances have been developed over the years, and we have consulted those estimates available to us, and in some cases, collaborated with other researchers developing balances. Notable among other estimates of DPRK energy balances are those developed by our colleagues at the Korea Energy Economics Institute (KEEI), as described in a presentation to the 2006 DPRK Energy Experts Working Group Meeting by Dr. Kyung-Sool Kim of KEEI[22]. The International Energy Agency (IEA) also maintains some energy statistics, including an estimated energy balance, for the DPRK[23].
The key assumptions and data used in preparing our estimated supply and demand balances for electricity and other fuels are presented below by sector (for demand) and by fuel group (for supply).
3. The DPRK’s Energy Resources
The major primary energy resources currently used in the Northern Part are as follows:
- Coal, almost all of which is domestically produced. The types of coal mined in the NP are anthracite and brown (or lignite) coals.
- Petroleum, including imported crude oil and a smaller amount of imported refined petroleum products.
- Wood and Biomass, including fuelwood and commercial wood harvested from the NP’s extensive but degraded forest area, and crop residue biomass.
- Hydroelectric power from a number of hydroelectric plants situated along the major and smaller rivers in the NP.
The NP has additional energy resources that are not yet widely used:
- Crude oil and natural gas resources exist in NP territory, though these are not yet well characterized, appear to be located mostly in offshore areas, and have been only tapped in a limited fashion to date.
- Geothermal resources, in which the NP has shown an active interest of late, though the extent of geothermal resources in the NP are not well known.
- Wind power, though the average wind speeds in the NP are fairly modest, with the most favorable wind regimes located offshore (particularly in the Northeast) and along the high ridges in the middle of the country.
- Solar energy resources, though the NP’s solar regime is no more (or less) favorable than that of the ROK, Japan, or the more temperate areas of the United States (for example, the mid-Atlantic States or Pacific Northwest).
- Tidal energy resources, though these too have been tapped to only a limited extent.
- Nuclear energy resources, namely, uranium.
A summary of these energy resources is provided below.
3.1. Coal
The DPRK has abundant coal resources, including deposits of anthracite coal and lignite, or “brown” coal. It substantially lacks, however, bituminous coal, which is the most common coal used worldwide as an input to coke production for steelmaking, and as a power plant fuel. Coal quality in the NP seems to be quite variable, with reported energy contents for different NP coals ranging from a very low 1000 and 2300 kilocalories (kcals) per kilogram for “low grade coal” (lignite and anthracite, respectively)[24] to a relatively high 6150 kcal/kg for high-grade anthracite coal[25]. The DPRK’s total coal resource or reserves have been variously estimated at levels ranging from 600 million tonnes (“proven coal reserves”, and “recoverable coal reserves”, as noted in international compendia of energy statistics[26]) to resources (“coal deposits”) of nearly 15 billion tonnes. The latter estimate is included in a fairly detailed description of coal (and other mineral) resource in the NP published through a Korean-language website in China [27].
Table 1 provides an estimate of DPRK coal resources by region consistent with the description provided above.
Table 1: Deposits in Major Coalfields of the NP (unit: million tonnes)
| Type of Coal | Name of coalfields |
Deposits of coals |
| Anthracitic |
Northern Pyong-An coalfield |
3,670 |
|
Southern Pyong-An coalfield |
1,260 |
|
|
Ko-Won coalfield (Kang-won province) |
320 |
|
|
others |
6,490 |
|
|
Sub-total |
11,740 |
|
| Brown coal |
Northern Ham-buk province |
1,910 |
|
Southern Ham-buk province |
570 |
|
|
others |
520 |
|
|
sub-total |
3,000 |
|
| Total |
14,740 |
Source: Korean Central Bank, 2008
Assuming future coal output on the order of 20 to 50 million tonnes annually, coal reserves would appear to be adequate for at least 30 years, and probably on the order of many centuries, of consumption[28].
The coal analysis presented above notwithstanding, the quality of NP coal is reportedly uneven. The heat contents of coals mined in one major district alone (the Anju district on the west side of the NP) vary from 1,000 to 6,000 kcal/kg[29], with ash contents from 12 up to 65 percent. Untreated coals of this quality can be expected to have a low efficiency of combustion, and the large volumes of bottom and fly ash generated when these coals are burned create a disposal problem[30].
Approximately one-half of the coal reserves in the Anju mining area are located under the seabed. The NP currently lacks the technology to effectively and safely extract this coal, which includes some of the higher-quality coal in the area. In mines in the Anju district that are in areas close to the sea, it is reportedly already necessary for miners to pump six tonnes of sea-water per tonne of coal mined, due to saltwater intrusion into the low-lying coal seams.
Coal production in the NP is principally from underground mines (as opposed to open pit or surface mines), but most underground mines are not particularly deep. Much of the better coal in the large Anju field is near or in fact under the ocean, which presents extreme mining difficulties due to the need to constantly remove seawater from the mines, requiring constant pumping and, thus (typically) reliable supplies of electricity. Coal production in some mines in the NP is (or was, as of about 1990) reportedly almost completely mechanized, but mechanization was apparently limited in other mines, and has become significantly less mechanized since. We applied Chinese figures from the 1980s for coal and electricity use during coal mining[31] to estimate the own use of these fuels during coal production in NP[32]. These estimates could be either low or high. The difficulties with water intrusion (for example) would argue that a large amount of energy would be expended for pumping, and thus these estimates would be understated[33]. On the other hand, the probable higher degree of mechanization in at least the larger Chinese mines would argue that “own-use” of energy would be lower in coal mines the NP than in mines in China.
Coal washing is apparently not practiced in the NP, although it would be beneficial for many coal combustion applications. Coal briquetting to produce household fuel is practiced widely (based on our observations) but on a small scale–many briquettes are produced in hand presses. No quantitative data were available to us to describe how this preparation process works on average nationwide, but our own 1998 and 2000 surveys as a part of the Unhari Wind Energy Project characterized the briquettes, at least in one village where we worked, as being on average 3 to 4 parts coal per part clay binder, and with a mass of the final, dried briquette of about 2.5 kg each[34]. Though this information is derived from a single locale, we would not be surprised if briquetting practices are very similar throughout the NP.
We have assumed, in preparing our estimates of NP energy supply and demand, that the production of coal in 1990 was 70 million tonnes, of which 49 million tonnes was anthracite coal, and 21 million tonnes was brown coal. We have taken the figure of 4500 kcal/kg as the weighted-average energy content for this coal.
Imports and exports of coal and coke to and from the DPRK were of modest scale in 1990, relative to domestic demand. Over the years, the DPRK has imported coal from a number of nations, notably China, Russia, Australia, and Indonesia, and also exported coal to several countries, most notably Japan (but not in recent years) and China. Exports of coal to China have increased massively in recent years, to 3.6 million tonnes in 2009, rising again to 4.6 million tonnes in 2010[35], and jumping even further to 11.2 million tonnes in 2011.
Figure 1:
3.2. Crude Oil, Petroleum Products, and Natural Gas
There are reportedly oil and gas reserves in offshore, and some onshore, areas of the DPRK[36], but the country lacks the technologies to effectively explore and develop these resources alone. Any production of crude oil by the DPRK has been in small quantities, at best. In recent years (see below), the DPRK has entered into agreements to develop its oil resources, and has by at least one report produced some crude oil from an onshore well. As of 1990, however, all of the petroleum products used in the DPRK were either derived from imported crude oil refined in DPRK, or were imported refined products. Crude oil imports as of the first half of the 1990s came from four main sources:
- Iran, principally in trade for North Korean armaments;
- China, in trade for various goods and for hard currency;
- The Former Soviet Union, previously on soft terms but more recently on a much more strict hard-currency basis[37]; and
- The open market, for example, through Hong Kong or Singapore.
Since the late 1990s, almost all imports of crude oil to the DPRK, with the possible exception of smaller quantities of “unofficial” imports, likely from Russia and/or from China, have been from China via a pipeline to the DPRK’s Northwest refinery. For the last decade and more, these imports have been relatively steady, at about 500,000 tonnes annually, as shown in Figure 2[38]. Oil products imports have come to the DPRK from a variety of different countries over the past decade, but China remains the largest average source of oil products imports. China’s oil products exports to the DPRK have also been relatively steady, as shown in Figure 2.
Figure 2: Crude Oil and Oil Products Imported by the DPRK from China, 1999 – 2011
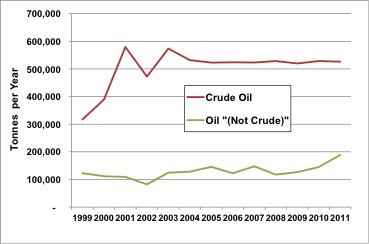
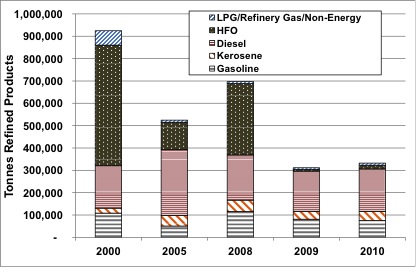
Figure 3 shows our estimates of total oil product imports, by category, to the DPRK for selected years from 2000 through 2010. Note that the high level of heavy fuel oil imports in some years reflect mostly heavy fuel oil imports as a result of Agreed Framework (KEDO) and Six-Party Talks agreements.
Figure 3: Estimated Oil Products Imports to the DPRK, All Countries, Selected Years
3.2.1. DPRK Petroleum Resources
Whether or not oil in commercial quantities has actually been produced from wells either on- or offshore in DPRK territory is somewhat unclear. As noted above, one media source listed production of 300,000 tonnes of crude oil per year starting in approximately 2000, but a number of experts consulted by the authors cast doubt on that estimate, though at least one expert (as of 2006) offered his opinion that ongoing oil production at some level occurs in the NP.
The amount of oil resource present in DPRK territories is uncertain. Explorations of potential oil-bearing structures—both onshore and offshore—in the DPRK have occurred intermittently for years. Within the past several years, the DPRK has negotiated and/or reached agreements on exploration of its potential oil resource areas with the ROK’s Korean National Oil Company, with the private firm Aminex Plc., of the United Kingdom (see below), and with the Chinese Government [39]. Several sources suggest that an oil resource of about 12 billion barrels lies in the Korea West Sea in the area near Anju, in the NP[40].
3.2.2. Natural Gas Resources in the DPRK
Reports of the extent of natural gas resource in the DPRK are less numerous than those of oil reserves, and likely just as speculative. A 2002 report suggests reserves of “at least 28.3 billion cubic meters of natural gas and 50 million barrels of petroleum” [41]. A reported gas find in the Korea East Sea in ROK waters may increase the probability that gas will eventually be found offshore of the DPRK as well[42].
3.3. Wood and Non-wood Biomass Resources
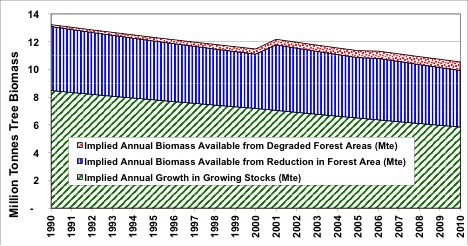
The DPRK’s forest resource base as of about 1990 has been estimated at somewhat less than 9 million hectares out of a total national territory of about 12 million hectares. This estimate appears to include some “unstocked forests”[43]. Anecdotal evidence, time series photos, consideration of the increasing rate of use of wood fuels in recent years to compensate for short supplies of commercial fuels, and remote sensing data all point toward a considerable decline in DPRK forest area and forest stocks over the past two decades. The various sources of information on DPRK forests, despite quoting a range of different forest compositions, appear to converge on a reasonably consistent set of estimates for stocks of wood in the DPRK. Using two different estimates of average cubic meters of wood per tonne, Professor Seung-Ho Lee of the Remote Sensing Laboratory of the Korea (ROK) Forest Research Institute (KFRI) calculated 1996 DPRK wood stocks of between 251 and 293 million tonnes of total above-ground biomass[44]. We use the former estimate—which is based on an average wood density that seems more reasonable for the tree species present in the DPRK, as one input in the estimation of the time series of DPRK wood resources presented below.
Based on growth rates for forests in areas of the ROK that have forests similar to the types of forests found in the DPRK, and using data from three sources, Professor Lee calculated a weighted-average annual growth rate of 3.06 %, which implies an annual production from growing tree stocks in the DPRK of 7.68 million tonnes per year in 1996. Note that this figure includes all above-ground biomass, some of which (small twigs and leaves, for example) would likely not be used as fuel, and likely some of which would be lost during harvesting. From the forest area data above, the decline in the area of forest lands in the DPRK averaged 1.45% per year from 1987 to 1999, using the multi-survey timeline cited by Prof. Lee; average rates of forest decline using the UN Forest Resource Assessment (FRA) 2005 estimates were and 1.83% per year from 1990 to 2000, and 1.93% per year from 2000 to 2010. Based roughly on the information above, we make the following estimate of forest area, wood stocks, and wood production over time through 2010. The results of this analysis are presented in Figure 4. Overall, DPRK forest lands are estimated to have decreased by over 30 percent between 1990 and 2010, with a similar decrease in the amount of annual growth in growing stocks[45]. The total annually available woody biomass decreases from over 13 million tonnes in 1990 to just under 10 million tonnes in 2010, but of those totals, about 4 to 4.5 million tonnes annually was biomass from forest areas cleared for one purpose or another. This suggests that by 2010 some 40 percent, at least, of DPRK biomass use was unsustainable—that is, cut from forest stocks, not from annual forest growth. Our estimate for total wood use in the DPRK in 2010 is 8.34 million tonnes. This is already most of what we calculate is the total woody biomass available from annual growth plus wood from cleared lands, but this simple comparison does not take into account the following factors:
- The estimate of total woody biomass available includes twigs and leaves, most of which would likely not be used for fuelwood (or industrial roundwood).
- There will be some harvest losses (wood left behind in the forests or fields).
- Much of the annual increment of forest growth may be in rugged terrain inaccessible for use by people.
- Not all forest clearing results in complete land conversion, meaning that the wood harvest from land clearing may be overstated.
- Both the estimated average wood stocks and the average growth rate of DPRK forests may be overstated.
Taken in combination, these factors, together with our estimates, suggest that the DPRK populace is indeed using the bulk of the nation’s available supply of wood as fuel and for other uses, and underscores the observations by visitors and satellites alike of a dwindling resource base. The DPRK government has undertaken massive reforestation projects, with mixed results, but clearly reforestation and related forest and soils conservation activities constitute an area where international assistance and capacity building will be both useful and a crucial step toward environmental sustainability in the NP.
Figure 4: Estimated Trend in Sources and Amount of Woody Biomass Availability in the DPRK, 1990 to 2010
Crop wastes constitute the other major source of biomass for fuel in the NP. As of this writing, we have no detailed estimate of the NP’s crop waste resource. A very rough estimate can be prepared for the major crops of rice and maize as follows. For rice, about one unit of straw is typically produced per unit of grain. The year 2004/2005 rice harvest was estimated at about 1.5 million tonnes, meaning that available rice straw would also have been about 1.5 million tonnes (though in fact some or much of this straw should be used as a soil amendment)[46]. The UN FAO has estimated somewhat higher rice production in 2004/2005, at about 2.2 to 2.4 million tonnes, with similar output in 2009 and 2010 (and about 3 million tonnes in 2008)[47]. Maize production was been estimated at about 1.7 million tonnes of grain in 2004/2005, and about the same (as estimated by UN FAO—see previous footnote) in 2009 and 2010, though 2008 harvests were somewhat lower, at about 1.4 million tonnes. The amount of maize crop residues per unit grain seems to vary depending on the source of information, but most estimates seem to be in the range of 1 to 1.5 tonnes of residues (stalks, husks, and cobs) per tonne of grain. Using a value of 1.3 for this parameter suggests that maize residue production in 2005 was approximately 2.2 million tonnes. Residues from other crops, including other grains, potatoes, and orchard crops, are likely in the range of 0.5 to 1 million tonnes, meaning that overall crop residue availability was about 4 to 5.5 million tonnes annually. Our estimate for non-wood biomass use for fuel in the NP in 2010 is within this range, at about 4.6 million tonnes, which suggests, if both our supply and demand estimates are close to accurate, that the vast bulk of crop residues are used for fuel in the NP and probably other biomass fuels, such as grasses and other non-tree biomass, are harvested for fuel use. In either case, the lack of residues returned to the soil, and the use of non-wood vegetation for fuel, suggest an ongoing pattern of soil fertility decline, and suggest that soil conservation in the NP will be challenging.
As the NP livestock population is relatively low relative to other countries with similar population levels, animal manure presently is unlikely to represent a sizable resource. Based on UN FAO statistics, the NP in 2005 had slightly under 600,000 cattle (a very few dairy cows, with most of the rest classified as “Oxen”), 3.2 million pigs, 21 million chickens, 5.5 million ducks, 2.75 million goats, and about 170,000 sheep. Using rough estimates of 2.2 kg volatile solids (dry organic matter) per head of cattle per day, 0.3 kg per pig per day, 0.010 kg per chicken, and 0.024 kg per duck per day suggests that the NP’s current resource of biomass in livestock manures was about 1 million tonnes per year in 2005[48]. More recent statistics suggest somewhat lower livestock numbers. The Yonhap News Agency quoted (in 2011) the World Organization for Animal Health (OIE) as saying that “North Korea has 577,000 heads of cattle, 2.2 million pigs and 3.5 million goats”[49]. The lower number of pigs in the 2011 estimate suggests that the total available livestock manure would probably fall to closer to 900,000 tonnes by 2009/2010. This is the resource that, along with human manures, would be tapped for biogas production. It is probable that if economic development takes hold in the NP, the numbers of livestock would rise, and thus the animal manures resource would also rise.
3.4. Hydraulic Resources
A number of sources suggest that the DPRK’s hydraulic resource is sufficient to provide about 10 GWe of hydroelectric generation. This is consistent with what we have been told in workshop presentations by delegations from the DPRK[50].
Many, but not all, of the sites for large hydroelectric facilities have been built upon, but many sites for small and medium hydro dams remain. In addition, it has been reported that some of the NP hydroelectric plants—some of which were built before the Korean War, have efficiencies (electrical energy output as a fraction of energy available in falling water) that are around 60 percent, suggesting that significant additional electricity could be generated at these existing sites once plants are upgraded to modern efficiency levels (on the order of 90 percent). The total one of estimate of hydroelectric potential for a number of major rivers in the NP is the equivalent of approximately 9,200 average MW of power[51].
3.5. Geothermal Resources
Geothermal energy is also mentioned as a possible source of both heat and power for the NP. At present, we have no information about the extent of the NP’s geothermal resources, though some potential geothermal sites undoubtedly are present in the NP. Recent news articles indicate an ongoing and expanding interest of the NP in geothermal energy, including a recent study tour, funded by a German foundation, by a NP delegation to geothermal-related sites in Germany, with a reciprocal visit by a representative of the foundation to Pyongyang[52], and agreements to cooperate with China on renewable energy development, including geothermal energy[53]. A number (over 120, according to various articles quoting unnamed NP sources) of hot springs exist in the NP, many of which are in use as spas or resorts (for example, the Ryonggang resort in the Nampo area). Our guess is that the NP’s usable resource for geothermal electricity generation is probably moderate, in the range of tens or hundreds of megawatts, but that is no better than a guess, pending further information.
3.6. Wind Energy Resources
Estimation of the wind resources potential in the NP is incomplete, and we have found existing DPRK wind data to be potentially unreliable. Significant DPRK wind resources are said to exist, however, in mountain areas and in coastal areas (including offshore areas). A NP delegation to a workshop organized by Nautilus and co-hosts provided an annual wind resource estimate of 1.7 TWh, which corresponds to about 550 MWe of wind power at an assumed capacity factor of about 35 percent (not atypical for wind generators).
A short video is available online of the Korean People’s Army installing one of a pair of relatively large (by NP standards) wind generators—with rated power probably on the order of one hundred or so kilowatts each—on a ridge in the Southern NP near the town of Onjin[54]. A generator of this size would need to be tied into a stable local (if not regional) electricity grid, meaning (to us) that either it is backed up by local diesel or hydro power sources, or it does not operate properly. The year of installation of these units, which appear to be imported (not made in the DPRK), is unclear, but was probably 2008 or 2009, since they appear on Google Earth photos in 2009, but not in 2006.
Based on our own (Nautilus’) experience in installing several small wind generators in a location on the western coast of the DPRK, it seems unlikely that onshore wind resources in that area are quite as good as claimed above, though offshore areas may well prove to have a better wind regime than onshore areas. Until additional and more rigorous wind data collection is completed, the actual DPRK wind resource is uncertain, but it seems likely that the total practical level of wind turbine installations in the DPRK will be in the range of hundreds of megawatts, of which some is likely to be in near-offshore areas or on islands. An extract of a Global Windspeed Map indicates that the most favorable areas for wind projects in the DPRK are likely to be the north coastal areas of North Hamhyung Province, particularly near the border with China and Russia, in some of the mountainous areas of North Hamgyong. South Hamgyong, and Ryanggang Provinces (including the Mount Paektu area), and, though to a significantly lesser extent, along the West coast of the DPRK[55].
3.7. Solar Energy Resources
The same DPRK presentation cited above gives the following information about the NP solar resource: “Annual average solar irradiation is about 1200 kWh/m2 and 55~60% of days per year are clear.” The NP’s winters are often relatively clear but cold, and summers are humid, with much of the annual rainfall in the NP occurring in the summer months. This weather pattern, and the solar resource data provided, suggests that the NP has at best, on average, a moderate solar resource. At 1200 kWh/m2-yr, the NP’s average insolation is less than that in many cities in the United States (for example, Pittsburgh, Pennsylvania, locations in New Jersey, and Western Oregon all have a similar solar resources[56]), but is greater than the solar resource in the Northern parts of Europe (most of France and Germany, for example).
3.8. Tidal Power Resources
Tidal power is a possibility for some coastal areas of the DPRK. The 2004 presentation by DPRK delegates cited above noted: “The west seashore of the DPRK is one of the well-known tidal zone in the world. The average difference between high and low tide is 4~6 m. n Tidal potential capable of the development is estimated at about 19 TWh.” Generation of 19 TWh annually suggests installed capacity on the order of 4 to 6 GW. An estimate by a Russian author put the tidal power resource of the NP at 4700 MW (4.7 GW)[57]. At least one small tidal power station exists in the NP—a 500 kW unit built into the Nampo barrage near the mouth of the Taedong River[58] (see Figure 5). In 2004, China was reportedly planning to build a 300 MW tidal power facility based on an artificial offshore lagoon approach near the mouth of the Yalu River near the NP border, but it is somewhat unclear whether this project has moved forward since[59]. The fact that China was planning such a project, however, probably means that such projects are also possible in nearby NP near-shore territory, at least from the point of view of the tidal energy resource.
Figure 5: Painting of Kim Il Sung and Kim Jong Il at the Dedication of the West Sea Barrage[60]

3.9. Uranium Resources
Figures on the NP’s reserves of uranium are difficult to obtain, and their accuracy is unknown. It has been reported that uranium has been mined to supply the NP’s domestic nuclear industry from mines located in various areas around the country, including Pyongsan, Pakchon, Hongnam, Jusong, Ungki, Sunchon 2, Hamheung, Hekumkang, and Najin. Two sources suggest that the NP’s uranium deposits “are estimated at 26 million tons” [61], [62]. One of the sources describes these deposits as “high grade ore”, so it seems virtually certain that the references are to tonnes of ore, not tonnes of uranium metal (or uranium oxides). Other analysts of the subject have reported estimates of 3 and 4 million tonnes of “reasonably assured resources”, based on older OECD and ROK estimates, respectively. Still another source cites a figure of 4.5 million tonnes of uranium ore, and quote “Russian scientists who have visited North Korea” as saying that the NP’s “mining and milling capabilities produce 2000 tons of natural uranium, per year”[63].
The NP is reported to have exported significant amounts of uranium ore over the years, starting in (at least) the 1947-1950 period, with the export of “over 9,000 tons of uranium [presumably ore] and an unknown amount of monazite to the USSR”, and continuing with a reported “$6 billion worth of uranium ore” to the USSR in 1985, “1,500 tons of monazite[64] annually” in the 1990s to “China, Japan, Spain, and Hong Kong”[65]. More recently, an advertisement by the NP’s International Chemical Joint Venture Corporation was published in an English-language NP trade journal in 2001 and 2002 advertised ammonium diuranate (ADU), a processed form of yellowcake, for sale on the international market.
Unlike other mining industries in the NP, Uranium mines have been targets of heavy investment, and its high grade engineers and skilled workers receive preferential treatment in terms of food, salary and social status. Funds invested in the mines have been used for mining equipments and facilities. In particular, instead of freight railway shipping of ore, sophisticated trucks, imported from Sweden and Japan, are operating to support production activities.
4. Energy Supply Infrastructure in the DPRK
With a relatively few exceptions, the energy infrastructure in the DPRK was installed prior to 1990, with some infrastructure—notably large hydroelectric power plants near the border with China, dating back to the period in which Japan occupied Korea in the 1920s and 1930s. Other infrastructure, including thermal power plants and oil refineries, were built with substantial technical assistance and/or material from the former Soviet Union of from China.
Below we describe the major elements of energy supply infrastructure in the NP, including power plants, electricity transmission and distribution systems, oil refineries, and coal mines.
4.1. Electricity Generation Infrastructure in the DPRK
There were reportedly over 500 electricity generation facilities in the NP as of the mid-1990s. Of these, however, only 62 major power plants operated as part of the (nominally) interconnected transmission and distribution grid, with the remaining plants being primarily small, isolated hydroelectric facilities and/or facilities associated with industrial installations. One estimate suggests that 85 percent of total national generation took place in the 62 major power plants in the 1990s; other, unofficial reports suggest generation at smaller plants was and is insignificant. The 62 “major” plants reportedly included 42 hydroelectric plants and 20 thermal plants. Of the thermal plants, 18 were reportedly fired primarily with coal. The power generation system in general suffered even in the 1990s from a lack of spare parts (particularly for plants built with USSR assistance), as well as a lack of testing equipment for use in maintenance activities.
4.1.1. Electricity Generation in 1990
Our estimate of electricity generation starts with the assumption that gross generation in North Korea in 1990 totaled 46 TWh of electricity. This estimate is somewhat closer to official DPRK estimates (60 TWh and higher) and UN estimates (55.5 TWh[66]) than to estimates by ROK sources (27.7 TWh[67]), Russian sources (35 TWh[68]), and more informal estimates of 31-32 TWh[69], but the latter may be a consumption rather than a production figure. To split total generation into thermal and hydroelectric generation, we adopted the official DPRK figure, which indicates that slightly more than half (about 54 percent) of all electricity generation occurred in thermal power plants in 1990[70]. To provide separate estimates of coal-fired and oil-fired electricity generation, we started with an estimate of generation in the DPRK’s largest oil-fired plant. We then assumed, based the available partial accountings of the number, type, and size of generating facilities, and on more informal reports, that generation in this plant (the Oung gi plant, associated with the refinery at Sonbong) comprised 100 percent of all oil-fired generation in 1990. Subtracting total oil-fired generation from total thermal generation yielded our estimate of total coal-fired generation.
For losses in 1990, we used the official estimate that 10 percent of net generation is lost in electricity transmission, and an additional 6 percent in distribution (T&D)[71]. These estimates are in aggregate similar to 1990 Chinese values for such losses, but may be optimistic. Except in the Pyongyang region, the NP power grid as of 1990 (and reportedly largely still is, as of 2013) dispatched literally by phone and telex, and outages on the grid are frequent. As records of power consumption at the end-user are not at all common in the NP, however, there is probably limited opportunity to determine the true extent of transmission and distribution losses[72].
There is a considerable but unknown amount of self-generation of electricity by industry. We do not know whether this generation is accounted for in the total electricity generation estimate that we have used, but since our estimate for total generation is more likely to be high than low, we assume that self-generation has been adequately taken into account.
There is also an unknown but substantial amount of district heating in the NP, some of which reportedly uses steam generated in fossil-fueled power plants (this in addition to steam and hot water provided by the 11,000 small- to mid-sized boilers used in buildings and industries in the NP) and by stand-alone district heat boilers located in major power plants along with boilers for electricity generation[73]. Our rough estimate, based on numerous assumptions, is that as of 1990 somewhat under 11 million GJ of total heat for district heating was generated, of which about 75 percent was from power plants, with the remainder from heat-only district heating plants. We assumed average heat losses of 15 percent between the district heating or combined heat and power plants and heat consumers. If district heating from power plants proves more extensive that we have estimated, it would likely increase our estimate for coal used in the power sector, but reduce our estimate for coal used in the urban residential and public commercial sectors (as reported in Chapter 3 of this report).
4.1.2. Existing Thermal Generating Facilities
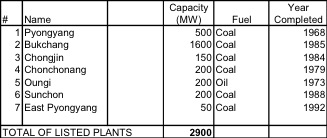
Although there are discrepancies between the various estimates of the installed capacity of thermal electricity generating capacity in the NP[74], we have assumed that the total installed and potentially usable[75] thermal generating capacity as of 1990 was approximately 3,200 megawatts. A list of the largest thermal plants in the DPRK as of 1990 (and still today, to the extent we can determine) is provided in Table 2.
Table 2: Major Thermal Generating Facilities in the DPRK[76]
In order to calculate the fuel used by thermal power plants, we have assumed that coal-fired plants use heavy fuel oil primarily as a start-up fuel in 1990, with HFO constituting about 2.0 percent of the total heat value of input fuel. Using figures for electricity generation by fuel type derived as indicated above, we then calculated the fuel requirements for thermal electricity generation using gross generation efficiencies in 1990 of 29.5 percent for oil-fired plants[77] and 28 percent for coal-fired plants. The efficiency figure we have assumed coal-fired plants is somewhat lower than the average heat rate (30 percent) reported in the Chongjin plant in the Sonbong area, but is comparable to Chinese electricity generation efficiencies for thermal plants of late-1970s vintage[78], [79].
The “own use” of electricity in oil-fired and coal-fired plants was assumed to be 8 and 9 percent of gross generation, respectively. These own use values are those quoted for the Oungi and Chongjin plants, respectively[80], and are relatively high compared to typical thermal power plants. For coal-fired plants, we assumed an additional “emergency loss” rate in 1990 of 5 percent (accounted for in the “own use” row of the energy balances in Chapter 3), which is a bold extrapolation from experience at the Pyongyang power station[81], and may be indicative of poor operating conditions in all NP coal-fired power plants. For 1996, we increased this rate to 7.5% of gross generation in coal-fired plants to reflect the reported increasing difficulties with power plant maintenance and in obtaining parts to repair and maintain thermal power plants.
4.1.3. Thermal Power Generation in 2000 and Beyond
Conversations with industry sources indicated that the thermal power generation system in the NP was rapidly eroding as of 2000. In virtually all of the large power stations, only some boilers and turbines are operating, if any are operating at all. The (nominal) 200 MW heavy fuel oil-fired plant near the (East Coast) Sonbong refinery apparently did not operate at all in 2000, and at least three other 100 MW plants also did not operate. Those plants that have operated are reportedly plagued by problems with “air heaters”—devices that extract heat from exhaust gases to heat incoming combustion air.These air heaters have in most plants been degraded to the point of inoperability by acid gases from the combustion of high sulfur fuels such as heavy oil and used tires[82]. The result is reportedly a considerable decrease in plant efficiency, quite possibly greater than the decrease in efficiency (from 28 percent in 1990 to 21 percent in 2000 and subsequent years, before accounting for plant own-use) that we have assumed. Further, boiler tubes in many power plants have been degraded from the outside by acid gases from high-sulfur fuels, and from the inside by inadequately-treated or untreated boiler feed waters. The lack of spare boiler tubes—and in many cases it may be that boiler tubes to fit these generators, which were built in the 1950s and 1960s, are not available at all, anywhere—means that it is very difficult to repair the boiler tube degradation. Two heavy oil-fired power plants, however, have been added to the roster of thermal generators that we previously knew about. A 60 MW plant built for operation on heavy fuel oil is located near the small West Coast refinery described below. This power plant reportedly only operates when crude oil is processed by the associated small refinery. A diesel engine-type plant with capacity totaling 9.8 MW was recently installed and operated for much of 2000 at Songlim, in association with a steel plant there. This plant generally seems to have been fueled with heavy fuel oil. We also assume that, by 1990, an additional 100 MW of coal-fired capacity was completed, possibly representing two additional 50 MW units at the East Pyongyang power plant. In total, we estimate that less than 800 MW of thermal capacity were operable as of 2000, though it is possible that some other units were technically operable, but did not operate due to lack of fuel. For those power plants that were operable, we estimate an average capacity factor in the range of 50 percent or less, due to maintenance problems and lack of fuel.
Many of the problems noted above reportedly persisted through 2010, continuing to the date of this writing, but we have little direct evidence of significant changes in thermal power generation capacity in relatively large plants since 2002. We have heard reports of some repairs at major power plants, including the (nominal) 1600 MW Pukchang plant, as well as reports of arrangements for importing of used power plant boilers, possibly from Eastern Europe[83]. Based on what we have heard from other observers, estimates by the (ROK) Korea Electrotechnical Research Institute (KERI) that operable thermal capacity was about 2 GW, and output 5.4 TWh, in 2005, seems reasonable, and we have adopted values close to these estimates[84]. We estimate the output of thermal generation in 2008 at nearly the same level as 2005—5.3 TWh, but, based on consideration of the ratio of ROK overall generation estimates in 2008 and 2009, we estimate the total thermal generation in 2009 and 2010 to have been lower—about 3.9 TWh and 3.3 TWh, respectively[85].
Another type of thermal power generation that seems to have become more significant in recent years in the NP are engine-generator sets used when grid power is not available, either because power plants are not running or due to T&D outages (see below) or both. Nathanial Aden’s report on NP-China trade in energy and related commodities (included as an Attachment to this Report) and data from the UN Comtrade database shows that the NP has since 2000 imported many hundreds (and in 2011, over 1000) small, medium, and larger diesel-fueled generator units, along with, particularly starting in 2008, tens of thousands (a total of over 30,000 since 2007 alone) of small spark-ignition (meaning gasoline-fueled) generator sets. Our guess is that the diesel generators were likely imported to provide power, when grid power was not available, for businesses, institutions, small industrial plants, and agricultural processing, but the spark-ignition generators were probably purchased by wealthier NP residential to provide power in their homes. It is very difficult to estimate exactly the total generation capacity represented by these units, since the trade statistics are categorized only by three ranges of capacity for the diesel generators, and provide no direct guidance for the spark-ignition units, but considering the reported value of the trades, and the prices of generators on the open market, we estimate that the diesel generators imported from China trade from 1994 on summed to a total capacity of about 225 MW by 2010, with spark-ignition generators represented a total of over 30 MW of capacity by 2010, and nearly 50 MW by 2011. Pending more information about these trades (for example, information on the types of generators shipped from Chinese exporters, and whether those generators were mostly new or used), these capacity estimates should probably be considered accurate to within a factor of two or so. We have assumed, primarily due to restrictions on the availability of diesel fuel and gasoline, that the diesel generators were used relatively lightly, at average capacity factors of 8 to 10 percent in the years from 2005 through 2010[86], and that gasoline generators were used even more sparingly, at average capacity factors of 1.5 to 2.0 percent in 2008 and later.
4.1.4. Hydroelectric Facilities
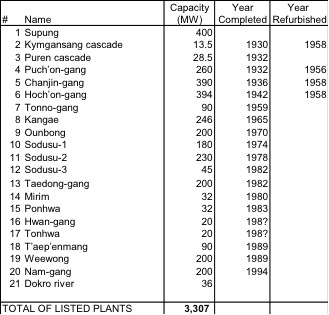
North Korea is a mountainous country with substantial rainfall. Thus it has fairly extensive total potential for hydroelectric development. The DPRK’s ability to mobilize massive work forces for public works projects such as dams has helped the country to tap this potential, and as of 1990 approximately 4,500 of an estimated 10,000 to 14,000 MW of hydroelectric potential had been developed. Table 3 provides a listing of those major hydroelectric facilities about which we have capacity information. The 20 plants on this list built prior to 1990 account for approximately 3,100 of the 4,500 MW of hydroelectric capacity reportedly in service as of 1990, and probably comprise about half (numerically) of the grid-connected hydroelectric plants. Electricity from several plants on this list (Supung, Ounbong, T’aep’enmang, and Weewong) is exported to China. Note that the capacities listed in Table 3 exclude the portions of power generated in those four plants that is sent to China. Including that portion of the capacity reportedly under contract to China (700 MW) raises the total 1990 capacity accounted for by the facilities in Table 3 to about 4,000 MW, over 85 percent of the total hydro capacity reported.
Table 3: Major Hydroelectric Generating Facilities in the DPRK[87]

Many of the smaller hydroelectric facilities in operation in the NP, are reportedly of the “run-of-river” type, meaning that relatively little water is impounded behind the dams. Although this would tend to suggest that electric output from the NP’s hydro plants may be more likely to be subject to the vagaries of the weather—poor rainfall months or years resulting in lower-than average electricity production—than systems with more impoundment-type dams, it has been suggested that the larger plants, including those initially designed and built during the Japanese colonial era, reportedly combine impoundment and run-of-river elements, resulting in relatively high capacity factors[88].
Given the location and extent of the flooding in the NP during 1995 and 1996, it always seemed probable to us that the NP hydroelectric system had sustained significant damage. We have modeled this reduction in usable hydroelectric capacity by assuming that available hydro capacity at existing facilities fell by about 3250 MW from 1990 values by 1996 as a result of flood damage[89] offset slightly by additions to capacity[90].
Our estimate for the supply of hydroelectric power in 1990 starts with the figure of 46 TWhe described above, of which slightly less than half (46 percent) is assumed to be generated in hydro plants[91]. These two figures, taken together, imply an overall capacity factor for hydroelectric facilities of about 54 percent. We counted the hydro input energy to electricity generation assuming an efficiency conversion of 100 percent output electricity to input energy, as is done in United Nations statistics[92]. The “own use” of electricity in hydro plants was assumed to be 0.3 percent of gross generation, which corresponds to ROK conditions in 1970[93], and is also similar to values for Chinese plants.
As a consequence of the difficulties with thermal power plants, hydroelectric plants had shouldered the burden of power generation in the NP by 2000. Information from industry sources indicate that any difficulties associated with the 1995/1996 flood damage to the shared power stations (China/DPRK) along the Chinese border has been repaired, and those plants are operating normally. Normally, however, apparently means that those plants—about 700 MW of capacity each for China and for the NP—are used largely in a peaking mode to conserve river water, and operate at full capacity only during the rainy mid-July to mid-August period. We have thus assumed an overall capacity factor of 17.5 percent for these units. Other hydroelectric facilities in the NP may in fact be operated in a similar manner, and it is clear that the country as a whole has far less power in the dry winter than at other times of the year. We have assumed, for the year 2000, that of the approximately 3900 MW of other hydroelectric plants, 75 percent of capacity was operable, and those operable hydro plants had a capacity factor in 2000 (a low water year) equaling 75 percent of the capacity factor assumed for 1996, or about 38 percent overall in 2000. This could, in fact, prove an over-estimate.
News reports from the DPRK regularly include items on hydroelectric dams under construction and, more rarely, commissioned. In addition, North Korean delegations to Nautilus events and DPRK contacts with ROK colleagues have suggested that many smaller hydroelectric facilities have been planned and built in the DPRK since about the mid-1990s. What remains very unclear, however, is the total capacity that these units represent, the amount of power they generate on average (in all likelihood, their average capacity factors are relatively low), and how many of the units are connected to a power grid, or, in fact, operate at all. Anecdotal reports suggest that the reportedly thousands of small hydro facilities (with average capacities of a few tens of kilowatts to a megawatt) installed by the end of 2004[94] (and, we assume, subsequently), have in fact, due to limitations on hydraulic resources, poor workmanship and/or operation, or a combination of factors, produced relatively little power.
A major “Youth Dam” including a tunnel system for carrying water, had recently been completed, but its hydroelectric capacity, if any as of 2000, was unclear. Also underway, at the time of the 2000 Nautilus visit to the DPRK, was a scheme to dam the Taedong River to provide irrigation water to rice fields on the Southwest Coast of the DPRK without the need to pump water from the Nampo barrage area. That project has since been completed (see Figure 3-3), but it is not clear to the authors whether the latter project has or is expected to have significant associated hydroelectric capacity, or whether the “Youth Dam” and the Taedong water diversion project are related.
For 2005, we have based our estimate of hydroelectric output on data from KERI (see reference to presentation by J.Y. Yoon, above), but added 100 MW of large hydroelectric capacity, plus 86 MW of medium-sized hydroelectric capacity, to account for facilities completed (or likely completed) in 2005. The resulting estimate of hydroelectric capacity for 2005 is about 4100 MW, with output of about 11 TWh and thus an average capacity factor of a bit over 30 percent. In 2008 through 2010, hydroelectric capacity is assumed to have increased somewhat over 2005 as a result of the completion of several medium-sized (tens of MW) hydro plants. Average capacity factors for hydroelectric plants in all three years were estimated at just under 32 percent, with total output of just under 12 TWh in each year.
A number of under-construction medium-sized hydroelectric plants have been put forward by the DPRK in recent years as possible projects for international investment in greenhouse gas emissions reduction under the “Clean Development Mechanisms” (CDM) of the Kyoto Protocol of the United Nations Framework Convention on Climate Change (UNFCCC). Particularly notable in this list of projects is the recently-completed (at least one unit) “Heecheon” Youth Power Station hydro power plant, which is slated to provide power for Pyongyang. Recent news reports suggest that as a result of the opening of this plant, the NP authorities had intended to retire the aging and polluting Pyongyang Thermal power plant[95]., but uncertainty as to the actual reliable output of the Heecheon plant, coupled, at least we would surmise, with the fact that the Pyongyang plant provides both heat to residents in the older part of the metropolis, as well as power, and the Heecheon plant could not provide district heat to those existing buildings the Pyongyang plant now serves (except through installation of electric resistance heaters, which would dramatically increase Pyongyang’s electricity consumption if done on a large scale).
4.1.5. Total Power Generation, Imports, and Exports
The above assumptions as to electricity generation imply a gross output of about 13.3 terawatt-hours in 2000, 16.5 TWh in 2005, 17.15 TWh in 2008, 15.9 TWh in 2009, and 15.4 TWh in 2010.
The DPRK’s electrical transmission interconnection with neighboring countries are very local in nature at present, and electricity imports and exports do not contribute significantly to the NP’s overall electricity balance. Power exports have been on the order of one percent the NP’s total generation in recent years[96]. Imports of power to the DPRK from China have varied on an annual basis, but also are generally a tenth of a percent or less of our estimates for DPRK total generation. Additional imports into the DPRK occurred from the ROK, as part of the Kaesong Industrial Complex located just north of the Demilitarized Zone (DMZ) from the ROK. We estimate that ROK power exports to the DPRK were about 73 GWh in 2005, 419 GWH in 2008, 428 GWh in 2009, and 539 GWh in 2010. It would be very helpful to have these quantities updated/corrected by ROK engineers familiar with the operation of the power line providing electricity to Kaesong. As of this writing (June, 2013), the DPRK has unilaterally brought a halt to joint industrial activities at Kaesong[97], but the infrastructure for power supply from the ROK remains, meaning that the potential to restart Kaesong quickly is still in place.
4.1.6. Electricity Transmission and Distribution
The unified electrical grid in the NP apparently dates back to 1958[98]. The NP T&D system must nominally manage a fairly complex grid of 62 power plants, 58 substations, and 11 regional transmission and dispatching centers. A general map of the electricity transmission system in the NP is provided as Figure 6. The main transmission lines in the NP are rated at 220 and 110 kV (kilovolts).
As of early 1992, the NP had plans to build 200 km of 220 kV power lines, 60 km of 110 kV lines, and 500 km of 66 kV lines per year through the year 2000[99]. Although we do not know the status of these construction projects, we assume that progress has not achieved targeted levels. Also as of 1992, the NP had plans to build a 330 kV transmission system, with implementation to start within 2 years, and also planned, in the long term, to build a 500 kV transmission system. We assume that little progress has been made on either of these higher-voltage systems.
Figure 6: Overall Map of the DPRK Electric Power Grid
There were, as of about 1990, reportedly 58 substations on the NP grid at the highest transmission voltage levels[100]. We have capacity information about only four of these[101], and names for a number of others. The substations in the NP are reportedly antiquated—based on obsolete Russian and Chinese technology—and also poorly maintained due largely to lack of parts and materiel. Our assumption is that most or all of the substations would need to be replaced, or at least substantially refurbished, to bring the NP grid up to modern standards.
The T&D system is nominally controlled by the Electric Power Production and Dispatching and Control Centre (EPPDCC) in Pyongyang and by 11 regional dispatching centers.
4.1.7. Technical Parameters of the T&D System, and Technical Challenges to Integration with Systems in Other Countries
The power grid in the NP operates at a nominal frequency of 60 Hz (Hertz, or cycles per second). Frequency control is poor, however, and the actual frequency on the system often reportedly falls to 57 to 59 Hz, and sometimes as low as 54 to 55 Hz (based on reports as of 1990)[102] [103]. Of the neighboring countries, both China and Russia have electricity systems that operate at 50 Hz, while the grid in the Republic of Korea operates at 60 Hz. This difference means that in order to interconnect the NP grid with the Chinese and/or Russian grid, as has been contemplated under the Tumen River Area Development Programme (TRADP), it will either be necessary to convert from 60 Hz to 50 Hz or from 50 Hz to 60 Hz at the intersection of the power grids. Interchange costs can in theory be offset, however, by reductions in required reserve capacity in one or both of the interconnected systems. That is, the interconnected systems (in aggregate) need not build as many power plants, thus there is significant capital cost savings.
Although the ROK power grid operates at nominally the same frequency as the DPRK grid[104] it is virtually certain that interconnection of the grids, in their present form, will require substantial power conditioning at the point of interconnection to assure that the power entering the ROK meets ROK standards for frequency and other attributes, and that the load on the DPRK side is not sufficiently unstable as to disrupt the ROK grid. The best way to achieve this outcome (short of wholesale refurbishment/replacement of the DPRK grid to ROK standards) is probably to add a station near the DPRK /ROK border that converts the AC (alternating current) power from the DPRK to DC (direct current) power, then back to AC power synchronized with the ROK system for export to the south. This conversion process would be carried out using a series of solid-state devices. Power losses through these types of AC-DC-AC system are minimal, typically much less than one percent. The cost of AC-DC-AC a systems of the size that would be required was estimated to be on the order of US $125 million per GW of capacity[105] as of the late 1990s.
4.1.8. The T&D System in 2000 and Beyond
We have assumed, based on reports of the continuing erosion of the transmission and distribution grid, that T&D losses were 20 percent higher in 2000 through 2010 than in 1996, totaling over 27 percent of net generation. Although “own use” at coal-fired power plants was assumed to remain at 9 percent of gross generation, we assumed that additional “emergency losses” decreased net output at coal-fired power plants, with overall net emergency losses totaling 9.4 percent in 2000, and a slightly lower 9 percent in 2005 through 2010, reflecting some improvements in power plant maintenance (or, alternatively, the abandonment of units with worse-than-average losses). We have been told that almost all of the transformers in the major substations of the NP are in very poor condition, and that many of the transformers that are operating (many units are not) are working at all because NP technicians have applied heroic measures to keep the units in service. It is unclear, without supplies of replacement parts (or new transformers, which would be better) for substations, whether key equipment at substations can continue to operate for much longer.
4.2. Petroleum Refining
The NP has two major oil refineries. Various estimates have placed the total refining capacity at these plants between 3 million tonnes[106] and 4.5 million tonnes[107]. Capacities in this range would be adequate to process the volume of crude oil that is reported to have been imported in the years before 1990. Our best information is that crude oil imported from China via a pipeline was refined in the DPRK’s 29,000 barrel per day (bpd, or about 1.45 million tonnes/yr[108])Chinese-designed refinery in the northwest DPRK. This refinery, named the Ponghwa Oil Refinery, was reportedly built in the late 1950s. It is designed to take Chinese crude oils (such as Daqing or Liaohe[109]). We assumed that the product slate of this refinery is the same as that of refineries of similar design in China, with product fractions (on a weight percentage of input basis) of 45 percent HFO, 22 percent gasoline (low octane), 20 percent diesel oil, 4 percent kerosene, and 5 percent liquefied petroleum gas (LPG) and refinery gas[110]. The DPRK’s other major refinery, the Sungri Oil Refinery is located in the town of Unggi, on the East Coast close to the Russian border and near Sonbong, has a reported capacity of 42,000 bpd (about 2.1 million tonnes/yr—though other sources suggest capacity of 2.5 million tonnes/yr), with a reported fluid cracking facility of 7,300 bpd[111], [112]. The refinery was built in around 1968 by the Soviet Union, and expanded in 1970. As of 1990, this refinery probably processed much or all of the oil imported to the DPRK from the Soviet Union and from Middle Eastern countries. Sources suggest that inputs from the Soviet Union arrived by train, with imports also received by ship from Saudi Arabia, Indonesia, Malaysia, and Iran. A page from a Japan-based North Korean organization lists the storage capacity of the plant at 2 million tonnes (it is unclear whether this is tonnes of oil products, of crude oil, or both—but is most likely for crude oil and oil products combined)[113]. A separate source reports much lower storage capacity of 30,000 tonnes of crude oil, 40,000 tonnes of diesel, 30,000 tonnes of heavy oil, 20,000 tonnes of gasoline, and 5,000 tonnes of lubricants[114].
In estimating the energy used during refining, we have used a value for oil consumption during refining derived from Chinese data, namely 0.0578 tonnes oil equivalent per tonne of crude oil processed[115]. This yields an overall energy efficiency in refining of just over 94 percent, which is not unreasonable, but may prove somewhat high for the DPRK.
For the years 2000 through 2009, we assume that the East Coast (Sonbong) refinery remains closed, and that the West Coast refinery on the Chinese border (on the NP side) continues to operate when crude oil from China is provided. As a consequence, the latter plant was assumed to operate at an average of 27 percent of capacity during 2000, and 35 percent of capacity in 2005 through 2010. We have heard a report that the Sonbong refinery did operate, with crude oil imported from Russia, in one or more recent years, with some of the petroleum products produced (we assume, diesel fuel and heavy oil) exported, probably to China or Russia, though unofficially (that is, the export of crude oil from Russia and any substantial imports of petroleum products from the NP do not appear in 2010 UN Comtrade statistics). Additional information about this reported refinery activity has not been available, so as a consequence we have assumed that 60,000 tonnes of crude oil was processed at the Sonbong refinery in 2010, meaning that the refinery had an annual average capacity factor of about 3 percent.
4.3. Coal Mining Infrastructure
Major coal mines in the NP include[116]:
- 2.8 Jick Dong Coal Mine: This mine is located in Jickdong, Sunchon city, Pyongnam province and is under the control of the Soonchon Area Coal Mine Group. The mine’s deposits include an estimated 300 million tons of coal (anthracite: grade, 6100-6900 kcal/kg) and its annual production capacity is approximately 1 million tons, but actual production in 2011 was 230,000 tons.
- Gowon Coal Mine: This coal mine is located in Jangdong dong, Soodong District, Hwam nam province, and its deposit of coal is approximately 300 million tons (anthracite, grade, 6000-6800 kcal/kg). Annual production capacity at this mine is about1 million tons, but actual production in recent years has been approximately 200,000 tons.
- Goguanwon Coal Mine: This mine is located in Goguanwon, Saebyul Gun, Hambook province. The mine’s deposit includes approximately 53 million tons of coal (brown coal: grade, 4700-5700 kcal/kg). The annual production capacity is of the mine is 1 million tons, but the actual production in 2011 was approximately 200,000 tons.
- Ryung Dae Coal Mine: This mine is located in Koobong district, Eunsan Gun, Pyong nam province. This mine was flooded in 1999 and was restored by 2011 after a 2-year period of rehabilitation. The deposits of this mine are estimated at 200 million tons (anthracite: grade: 6100-6600 kcal/kg), and its annual capacity is 1 million tons.
- 6.13 (Ahoji) Coal Mine: This mine is located in Haksong, Kyong heong Gun, Hambook province. The deposit of coal for this mine is 100 million tons (brown coal: grade, 4700-5700 kcal/kg) and the mine’s annual production capacity is approximately 1 million tons, but actual production is approximately 800,000 tons per year.
- Ryong Moon Coal Mine: This mine is loacted in Ryong moon dong, Koojang Gun, Pyong Book province. The mine was flooded but it was rehabilitated in 2009, and is now producing 73,000 tons per year. Deposit for this mine are estimated at 150 million tons (anthracite, grade: 6400 kcal/kg). The mine is operating using the inside-of-pit method of mining. The mine has been sending its products to the Pyongyang Power Plant.
- Suchang Youth Coal Mine: This mine located in Suchang dong , Duck-chon city, Pyong nam province. The mine has deposits of about 300 million tons (anthracite: grade, 6200 kcal/kg), and its annual production capacity is approximately 1.5 million tons, though it has been producing 350,000 tons per year recently. The mine’s products are sent to the Bookchang (Pukchang) power plant.
- Chong Nam Coal Mine: This mine is located in Chong Nam dong, Chong nam gun, Pyong nam province, in the Anju area. The mine was flooded in 1990, but restored in 2007. The deposits of coal are estimated at approximately 250 million tons (brown coal: grade, 5400-5700 kcal/kg). The production capacity of the mine is approximately 3 million tons/year, and the mine is providing its products to the Chonriam Steel maker and the Namheong General Chemical Group.
- Go-Bi Coal Mine: This mine is located in the Gobi Worker’s District in Gangdong Gun, Pyongyang City. The deposit of coal for the mine is reported to be 35 million tons (anthracite: grade, 6400 kcal/kg), and its annual production capacity is approx. 1 million tons using underground mining methods, but actual production in recent years has been about 140,000 tons per year. Most of its products are exported to China via Nampo port, and the distance between the coal mine and port is 110 km.
There are currently several urgent problems that the DPRK coal industry must overcome. First, the depth of mining at existing sites is increasing which means that the expense and difficulty of draining underground water has increased, and the operational effectiveness of the mines has decreased, on average. Second, a lack of power, transport equipment, mining technology and funding has held down production. Third, there is a lack of attention to mine development on the part of mine managers. Fourth, deterioration of mining equipment and equipment parts, as well as lack of mine support posts, limits production. Fifth, a high rate of industrial accidents, and the lack of new investments in the coal mining industry, reduces output. And sixth, the lack of electricity for mine operation is a cause of lack of power production due to the fact that most power plants rely on coal supplied by coal mines as energy sources, resulting in a vicious cycle connecting the problems of lack of power and the energy sources used to produce power in the DPRK.
5. Summary of Energy Supply and Demand Results for 2010
Table XX presents a summary version of our estimated 2010 energy balance for the DPRK. A more detailed version of this balances is presented as Tables YY, and a detailed balance that focuses on the supply of and demand for refined petroleum products is shown as Tables ZZ. Figure XX shows the supply of energy by fuel in the NP in 2010. Here a feature of note is the relatively large fraction of the total DPRK energy budget supplied by wood and biomass, which has risen by nearly a factor of two, in our estimate, since 1990, with corresponding decreases in the fractions of the budget accounted for by other fuels, particularly coal and coal products. Figures YY shows the breakdown of overall energy use by sector in 2010. This figures shows the residential sector taking a larger share (over 40 percent of the overall energy budget than the industrial sector, a marked changes since 1990 that is the combined result of continued reduction in fuel demand in the industrial sector, slowly rising use of wood and other biomass fuels in the residential and other sectors, and reductions in the use of other residential fuels (notably coal and electricity) that are not as severe as the reductions experienced in the industrial sector. Figures ZZ shows the patterns of final fuels demand by fuel. Figures AA and BB show the patterns of demand for coal and for oil products in the year 2010.
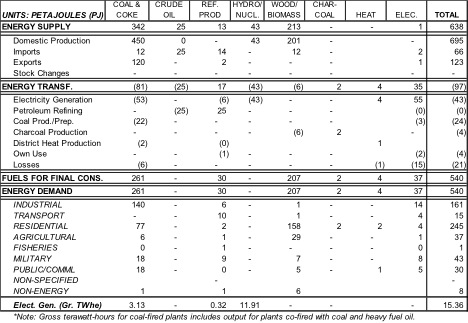

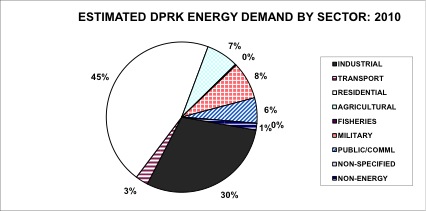
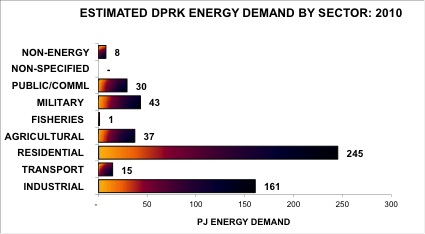
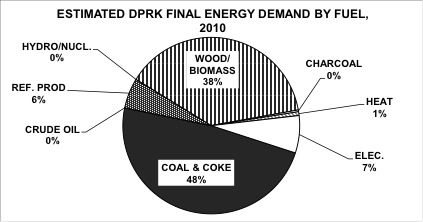
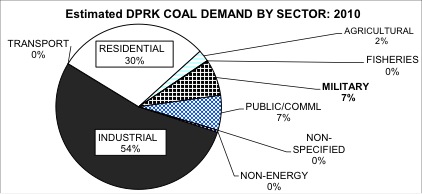
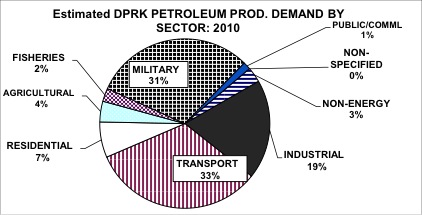
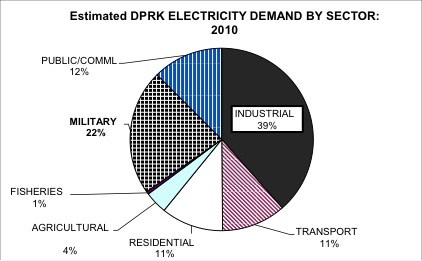
6. Energy Demand in the DPRK Military in 2010
Figures 7shows the estimated total use of coal, petroleum products, and electricity in the various subsectors of the DPRK Armed Forces as of 2010. Overall, we estimate that the DPRK military accounted for a relatively modest 8.0 percent of total energy end use in the country,, 7.1percent of coal, and 22.2 percent of electricity demand, but a much larger 31 percent of refined petroleum products.
Figure 7: 2010 DPRK Military Sector Energy Demand by Fuel
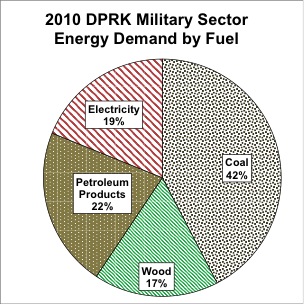
Table 1 presents 2010 energy demand estimates by subsector and fuel for the branches of the military, military manufacturing, and military buildings and other uses. Coal and electricity provide 42 and 19 percent of overall military energy use, respectively, with over 90 percent of electricity and nearly 98 per cent of coal used in the “buildings and other uses” category. Our estimates of the use of coal and electricity, however, include significant placeholder estimates for “other” uses of these fuels. The remaining 39 percent of fuels demand is supplied by petroleum products (22 percent) and wood (17 percent), with the latter being relatively high because it is assumed to be used in relatively inefficient cooking and heating stoves, and even simple fire pits, as has been observed by visitors to the DPRK. The breakdown of our estimate of petroleum products use in the military (Army, Air Force, and Navy only) is shown in Figure 8. Demand for petroleum products by vehicles and armaments in the ground forces accounts for just over one third of the total, with the Navy using 44 percent and the Air Force the remaining 22 percent. The ubiquitous two-and-a-half ton military trucks—when summed across the military branches—are estimated to use about 37 percent of total military petroleum products demand, and it should be noted that these trucks may nominally be in military service, but in fact, based on our observations and those of others visiting the DPRK, also are constantly pressed into service transporting civilian goods and, in fact, civilians, so for these vehicles the line between DPRK military and civilian petroleum products use is bound to be rather blurry.
Table 1: Estimated DPRK Military Energy Demand By Fuel and Subsector in 2010
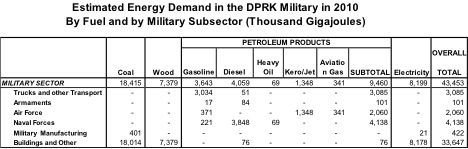
Figure 8: Estimated 2010 DPRK Military Sector Petroleum Products Demand by Type of Equipment
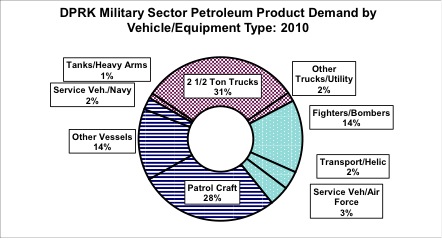
6.2. Changes Since 1990
Figures 9 shows the trend in estimated energy use in the DPRK military, by fuel type, from 1990 through 2010, and Figure 10 shows the same trend by subsector. Overall military fuel use has declined for all fuels except wood, and for all subsectors, but military fuel use in the DPRK has declined by substantially less than estimated overall energy use. In 1990, our estimate is that the DPRK military used a relatively modest 4.5 percent of total energy demand in the country, including 15.1 percent of refined products, 3.1 percent of coal, and 11.6 percent of electricity demand. By 2010, however, these figures had risen to 8.0 percent, 31.2 percent, and 22.2 percent, respectively. Table 2 provides estimates of the fraction of energy use in the DPRK by the armed forces, both by fuel and for the sum of all fuels.
Figure 9: Estimated DPRK Military Energy Use by Fuel, 1990 through 2010
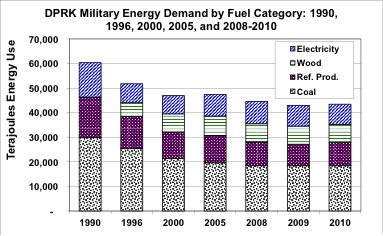
Figure 10: Estimated DPRK Military Energy Use by Subsector, 1990 through 2010
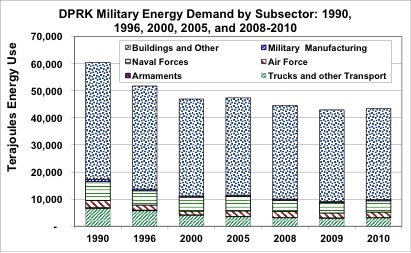
Table 2: Fraction of National Fuel Use in the DPRK Military, 1990 – 2010

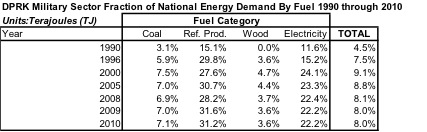
6.3. DPRK Military Fuel Supplies in a Conflict Scenario
If North Korea chose to engage in a full-scale conflict, the pace of its war effort would be extremely rapid, with nearly continuous operations. In a three-week campaign with nearly constant operations, the ground forces would burn through the equivalent of about 6 months of what we estimate above to be its routine fuel usage. The Navy would likely use about 60 percent of their normal annual energy demand within the same three weeks. Some reduction in military energy use will likely come from decreased energy usage in barracks, since most soldiers will be in the field, and through a reduction in stocks of equipment through attrition, as equipment either fails or is destroyed in battle. Some equipment may be recovered for repair, which would likely be difficult in a conflict situation. In all probability, repair options will be minimal and likely confined to operator-level repairs.
In a full-fledged conflict with ROK/U.S. forces, the DPRK’s stock of aircraft will be rapidly disabled or destroyed as a result of air to air action, and through targeting of DPRK planes on the ground. Some DPRK planes will be kept underground, but it is likely that those aircraft will either remain in storage or, if they are sent into action, will be quickly disabled. Even if all of South Korea’s runways are cut, ROK and U.S. naval aviation, plus warplanes refueled from tanker facilities on Guam, would still be able to support a significant ROK/U.S. air presence. Once North Korea’s limited stock of 4th generation fighter aircraft are no longer functioning (North Korea is believed to have 35 MiG-29s), North Korea’s remaining aircraft will be rapidly destroyed if they fly. North Korean aircraft remaining in North Korean airspace are less likely to be destroyed – and also flying fewer hours. Because North Korea’s formidable and layered air defenses pose a serious penetration challenge, U.S. and South Korean Air Forces are unlikely to enter North Korean airspace to attack individual aircraft.
North Korea’s coastal (brown water) navy will likely sail south, parallel to the coast rather than away from the coast. The farther south the flotilla moves and the further away from North Korea’s shore based (and hence stationary) artillery batteries and the further away from any air protection they move, the more likely they are to be disabled or destroyed. It is unlikely North Korea’s navy will conduct an underway replenishment of its fuel supplies. A conflict will likely conclude prior to any naval vessels having to refuel.
All North Korean ground forces due north of Seoul and in the vicinity of the Demilitarized Zone can reach Seoul on one full tank of fuel if there is minimal to no resistance to their advance along the way. If North Korean ground forces encounter strong resistance or are forced to take a circuitous route to Seoul they will likely not have fuel to go much further than Seoul. Unless—and this may be an element of DPRK strategy—the DPRK is able to capture and tap fuel depots in the ROK, within four days at the most, North Korea will need to move several thousand refueling vehicles along exposed routes through South Korea in order to refuel and re-arm the North Korean military. The ubiquitous two and one half ton truck and all its many variants are extremely vulnerable to small arms fire, artillery, missiles, and other weapons. North Korea would need to refuel the energy-intensive fleet of two and one half ton trucks often in order to keep their military operation viable. It is unlikely North Korea can sustain such a dynamic and growing logistics chain for more than a few weeks, even in the event that it is able to advance into ROK territory.
Given a conflict scenario similar to that sketched out above, several years ago, we carried out a rough calculation that suggested (and an updated version still suggests) that it would take about three to four months of DPRK refinery output, at current levels, to resupply the gasoline and diesel fuel that the military would use in the first month of an active conflict. By the end of the first month of conflict, it would take about two months of total refinery production plus imports (assuming current levels) of gasoline and diesel to operate for an additional month of war the DPRK military vehicles that we estimate might remain operable after the initial 30 days of conflict.
This calculation includes several simplifying assumptions, each with significant to considerable degrees of uncertainty. First, it assumes that 50 percent of DPRK military ground vehicles and armaments would be inoperable after 30 days of conflict, and that 90 percent of the DPRK’s navy and 100 percent of its air force would be similarly inoperable or in deep storage. Given the superior firepower, particularly from the air, of the ROK/U.S. alliance, these assumptions seem reasonable to us. Second, it assumes that the DPRK does not have many months of fuel stored in deep bunkers. Here, we have no direct information one way or another, but suspect that the relatively constant fuel shortages over the past decade and more have probably eroded stocks, at least somewhat. Even if there were large stores if fuel deeply buried in the mountains of the DPRK, as is assumed by many, if only 50 percent of ground vehicles are operable, there will be limited capacity to move the fuel stocks to where they are needed. Third, it assumes that the one operating refinery continues to provide fuel at current levels, and that the second major DPRK refinery, at Sonbong on the DPRK’s northeast coast (currently and recently inactive) is not reopened. The degree to which the currently-operating refinery, in the DPRK’s northwest and connected by pipeline with China, maintains its output depends largely on the degree to which China continues supplying crude oil. Refineries are easy military targets, but it seems unlikely to us that the ROK-US forces would attack a facility so close to China. Whether China might increase or decrease the flow of crude oil to the refinery is an open question—our guess is that they might not do either. Reopening the Sonbong refinery would likely take much too long to help much in the event of a conflict, and it is unclear where the crude oil to fuel it would come from. Fourth, we assume that the current (mostly minor) sources of refined products would not increase or decrease much as a result of a conflict. If anything, it seems to us that it would be more difficult, not easier, to import oil by truck, train, or small tanker ship in the event of an armed conflict.
These caveats notwithstanding, the essential finding from our calculation is that the DPRK military would quickly—in a matter of weeks or certainly months—run short of fuel in any major armed conflict. With regard to consideration of the terrible prospect of war on the Korean Peninsula, this finding has (at least) two implications. First, the major part of a war between the DPRK and the ROK and its allies is likely to be over, at least in terms of use of large fuel-using vehicles by the DPRK, within two or so months. Second, knowing that a war is likely to be brief, the ROK and its allies might be more inclined NOT to inflict difficult-to-reverse damage on major DPRK energy facilities.
7. Conclusion
Though North Korea possesses the World’s fifth largest military and has the largest proportion of its citizens under arms of any nation[117], the military places a surprisingly light, relative to its size, burden on the overall energy budget of the country. There are likely both political and commercial reasons for such a large military to use energy so austerely. On a political level, one possibility is that it is the calculation of the DPRK’s leadership that the combination of aggressive rhetoric, as the DPRK has engaged in over the past few months, plus too much military activity can lead to perceptions that an attack is imminent, and sets the stage for miscalculation on either the DPRK or the ROK/U.S. side. On a practical level, a high military operations tempo places an excessive strain on existing DPRK supplies of petroleum fuels, and/or results in unaffordable outlays of hard currency to import diesel oil and gasoline.
The international community has limited influence on how North Korea balances those choices but there are frameworks and suggested pathways that the international community can adopt to shape the DPRK’s response to its current dilemma[118]. Consideration of the status of energy use in the DPRK military as described in this Working Paper, together with a thorough understanding (to the extent possible) of the motivations of DPRK leaders, can help to inform policy decisions related to the governance and future of the Korean peninsula.
III. REFERENCES
[1] Korea Foreign Trade Association (1993), Major Economic Indicators for North Korea.
[2] The Economist Intelligence Unit (1994), South Korea, North Korea No. 1 1994. The Economist Intelligence Unit, London, United Kingdom. Country Report, 1st Quarter 1994.
[3] Far Eastern Economic Review (1995), 1995 Asia Yearbook, North Korea.
[4]Korea Trade-Investment Promotion Agency (KOTRA) data (from http://www.kotra.or.kr/main/info/nk/eng/main.php3, visited 6/3/02) in “South/North Korea’s Trend of Real (GDP) Growth Rate”, which lists the Bank of Korea as a Source. Similar growth in the North Korean “GNI” was also cited in data provided to Nautilus by the Korea Energy Economics Institute.
[5] Bank of Korea (2011), New Release: Gross Domestic Product Estimates for North Korea in 2010, dated November 3, 2011, and available as http://www.nkeconwatch.com/nk-uploads/GDP_of_North_Korea_in_2010.pdf.
[6] For example N. Eberstadt (2001), If North Korea Were Really “Reforming”, How Could We Tell—And What Would We Be Able To See? states “…official claims of ‘turning the corner’ and ‘completing the Forced March’ notwithstanding, the [NP] remains in dire economic straits”. Eberstadt goes on to cite the UN Food and Agriculture Organization’s finding that NP cereal production in 2000/2001 “is expected to be fully a third below the level of 1995/96”, and asserts, based in part on the NP’s meager reported export earnings in the first half of 2001, that “The country’s export capabilities are likewise in a state of virtual collapse…”.
[7] U.S. Bureau of the Census (1995a), The Collapse of Soviet and Russian Trade with the DPRK, 1989-1993: Impacts and Implications. Prepared by N. Eberstadt, M. Rubin, and A. Tretyakova, Eurasia Branch, International Programs Center, Population Division, U.S. Bureau of the Census, Washington, D.C., USA. March 9, 1995.
[8] U.S. Bureau of the Census (1995b), China’s Trade with the DPRK, 1990-1994: Pyongyang’s Thrifty New Patron. North Korea Trade Project Memorandum, International Programs Center, Population Division, U.S. Bureau of the Census, Washington, D.C., USA. May, 1995.
[9] N. Aden, “North Korean Trade with China as Reported in Chinese Customs Statistics: Recent Energy Trends and Implications”, as prepared for the Energy Experts Working Group Meeting, June 26th and 27th, 2006, Palo Alto, CA, USA). Dr. Aden’s paper is available as http://nautilus.wpengine.netdna-cdn.com/wp-content/uploads/2012/01/0679Aden1.pdf. Data for 2010 and 2011 from United Nations Comtrade Statistics database.
[10] Issues related to Chinese investment in the NP, and changes in NP policies that have made investment possible, are addressed in the Nautilus Institute Policy Forum Online 06-70A, August 23rd, 2006, “DPRK’s Reform and Sino-DPRK Economic Cooperation”, by Li Dunqiu (http://www.nautilus.org/fora/security/0670Li.html). See also Professor Li’s presentation as prepared for the Energy Experts Working Group Meeting, June 26th and 27th, 2006, Palo Alto, CA, USA, and available as http://www.nautilus.org/DPRKEnergyMeeting/Papers/Li.ppt. Professor Li describes two “waves” of recent Chinese investment in the NP, with a first wave of investment led by private companies and businessmen, mainly from China’s northeast provinces, and the second wave described as “mostly represented by large state-owned enterprises, in areas like heavy industry, energy, mineral [resources] and transportation”.
[11] As of 1995 the DPRK’s trade deficit was estimated at $879 million, based on United States Department of Energy’s Energy Information Administration (UDOE/EIA, 1996), Country Analysis Brief, North Korea.
[12] United States Department of Energy’s Energy Information Administration (UDOE/EIA, 1996), Country Analysis Brief, North Korea. Part of USDOE/EIA World-wide Web site, www.eia.doe.gov/emeu/cabs/nkorea.html.
[13] For example, see Joongang Ilbo, Lee Young-jong, “North Korea Overseas Trade Reaps $1.97 Billion For Last Year,” Seoul, 06/04/01.
[14] As estimated by ERINA (Economic Research Institute for Northeast Asia) in Chapter 5 of Northeast Asia Economic Databook 2005, dated approximately December, 2005. ERINA’s estimates are based on data from the Korea Trade-Investment Promotion Agency (KOTRA) for trade between the DPRK and nations other than the DRPK, plus figures on trade between the Koreas from the ROK Ministry of Unification. Avalable as http://www.erina.or.jp/En/Lib/datab/2005pdf/05-De.pdf. Page 53.
[15] Bank of Korea (2011), New Release: Gross Domestic Product Estimates for North Korea in 2010, dated November 3, 2011, and available as http://www.nkeconwatch.com/nk-uploads/GDP_of_North_Korea_in_2010.pdf.
[16] One such affected region is the Sinuiju area, where, after the 1995 floods, “…sand poured in from the Yalu River
and destroyed all the rice fields in the region” (Bernard Krisher “Urgent Proposals To Get Food & Drugs To North Korea”, extracted in Northeast Asia Peace and Security Network Daily Report, 30 May 1997. Nautilus Institute, Berkeley, CA, USA.
[17] See, for example, Cankor (2011), “DPRK Flood Damage Reports by KCNA”, dated 8 August 2011, and available as http://vtncankor.wordpress.com/2011/08/08/dprk-flood-damage-reports-by-kcna/; and United States Central Intelligence Agency (2010), North Korea: Assessing the Impact of Flooding on Agricultural Output (U//FOUO), dated 15 December 2010, and available as http://www.fas.org/irp/cia/product/nk-flood.pdf.
[18] Another way in which the food shortage likely has affected the economy is that scrap metal, some taken from industrial facilities, apparently has been (we do not know to what extent the practice continues) used as barter to obtain food via cross-border trade with China (Korea Times, “N. KOREA BARTERS SCRAP IRON FOR CHINESE FLOUR, CORN,” Beijing, 05/18/97). Although the extent to which operational industrial facilities have been dismantled to trade for food is unknown, we find it conceivable that even if the NP does manage to obtain the needed inputs and investment to restart industrial production, many plants will be found to be inoperable due to key missing (sold for scrap) parts. In the same vein, there have also been reports from defectors that North Koreans have cut pieces of telephone and electrical wire to barter the copper in them to Chinese smugglers in exchange for food and other items (Korea Times, “RUMORS OF WAR RAMPANT IN N. KOREA,” 05/23/97).
[19] Primary energy counts all fuel use, including conversion and transmission/distribution losses. Commercial energy excludes, for the most part, use of biomass fuels such as firewood and crop wastes.
[20] In his paper and presentation “Changes In The North Korean Economy And Implications For The Energy Sector: Is North Korea Really Short of Energy?”, as prepared for the Energy Experts Working Group Meeting, June 26th and 27th, 2006, Palo Alto, CA, USA, William B. Brown discussed the state of DPRK energy markets, and noted that by one measure of electricity cost, the ratio of the price of rice to the price of a kilowatt-hour of electricity, power was one hundred times as expensive in the United States in 2006 than it was in the DPRK. See http://www.nautilus.org/DPRKEnergyMeeting/Papers/Brown.html and http://www.nautilus.org/DPRKEnergyMeeting/Papers/Brown.ppt.
[21] David von Hippel, and Peter Hayes (2012), Foundations of Energy Security for the DPRK: 1990-2009 Energy Balances, Engagement Options, and Future Paths for Energy and Economic Redevelopment, dated 18 December 2012, and available as https://nautilus.org/napsnet/napsnet-special-reports/foundations-of-energy-security-for-the-dprk-1990-2009-energy-balances-engagement-options-and-future-paths-for-energy-and-economic-redevelopment/
[22] Kyung-Sool Kim, “DPR Korean Energy Demand/Supply Analysis: Energy Balance Sheet 2003”, prepared for the DPRK Energy Experts Working Group Meeting, June 26th and 27th, 2006, Palo Alto, CA, USA, and available as http://nautilus.wpengine.netdna-cdn.com/wp-content/uploads/2012/01/Kim.ppt.
[23] The IEA’s most recent (2009) energy balance for the NP, for example, is available as http://www.iea.org/stats/balancetable.asp?COUNTRY_CODE=KP
[24] Document in the authors’ files [VO-90].
[25] Choi Su Young, Study of the Present State of Energy Supply in North Korea, RINU, 1993. P. 14.
[26] For example, U.S. Department of Energy’s Energy Information Administration, EIA Country Analysis Brief, Updated February 2006, and previously available as http://www.eia.doe.gov/emeu/cabs/North_Korea/Background.html; and British Petroleum Company (2012), BP Statistical Review of World Energy June 2012, “Coal”, available as http://www.bp.com/liveassets/bp_internet/globalbp/globalbp_uk_english/reports_and_publications/statistical_energy_review_2011/STAGING/local_assets/pdf/coal_section_2012.pdf.
[27] Changchun Killim Sinmun (Internet Version-WWW) in Korean 31 Aug 06 – 08 Sep 06, “”Guide to DPRK Mineral Resources”.
[28] This assumes that the NP will continue to use domestic coal. If its economy develops, and with the global implications of coal use on climate change, as well as the relative economics of coal production in other nations the NP might trade with (the United States and Australia, for example), this is not a given.
[29] “Standard” bituminous coal is defined as 29.3 GJ/tonne, or about 7000 kcal/kg, so 6000 kcal/kg is coal of relatively high energy content, while coal of 1000 kcal per kg would be considered of quite poor quality.
[30] Combustion efficiencies decline in part because a large volume of inert material (ash) must be heated up by the burning coal. “Fly ash” denotes that fraction of coal ash that leaves the boiler with the hot exhaust gases and is trapped by ash collection devices or emitted to the atmosphere. “Bottom ash” is that fraction of the inert material in the coal that remains in the bottom of the boiler after the coal is combusted.
[31] Chinese language spreadsheet dated 12‑Feb‑93 provided by J. Sinton of Lawrence Berkeley Laboratory; Sinton, J. (1995), “Physical Intensity of Selected Industrial Products”. Spreadsheet printout. LBL” Lawrence Berkeley Laboratory, Berkeley, California, USA.
[32] These own-use figures do not include the capture and combustion of coal-bed methane, which is employed in at least one NP coal mine.
[33] It is reported (Document in authors’ files [VO1]) that in some areas of the Anju field 6 m3 of water must be pumped to mine a tonne of coal. It is not known how representative this situation is of the Anju field as a whole or of all mines in the NP.
[34] See, for example, page 24 of Rural Energy Survey in Unhari Village, The Democratic People’s Republic of Korea (DPRK): Methods, Results, and Implications, David F. von Hippel, Peter Hayes, James H. Williams, Chris Greacen, Mick Sagrillo, and Timothy Savage, Nautilus Institute Report, dated May 20, 2001, available as http://www.nautilus.org/about/staff/peter-hayes/Unhari_Survey.pdf.
[35] Data on Russia’s energy trade with the DPRK, and on China’s coal imports from the DPRK in 2010, are taken from the United Nations “Comtrade” database (http://comtrade.un.org/db/default.aspx, accessed on several occasions).
[36] DPRK sources place estimates of total oil reserves at 6 to 10 billion tonnes. Although we have been told by independent sources that oil deposits do indeed exist beneath the DPRK and its offshore territory, we have been unable to confirm the extent of those deposits.
[37] Some sources indicate by even the 1993 exports of oil from the Former Soviet Union to the DPRK had fallen to as little as a tenth of the pre-end-of-cold-war level (Choi Su Young (1993), Study of the Present State of Energy Supply in North Korea, Research Institute for National Unification (RINU), Seoul, (ROK); and Alexander Karabanov, 1993, personal communication).
[38] Data for Figure 2 from China Customs Statistics, compiled by Nathanial Aden—see footnote above, except for 2010 data, which are from the United Nations “Comtrade” database (see above).
[39] Keun-Wook Paik, “Challenges and Opportunities in Sino-DPRK Energy Cooperation”, in China Brief: A Journal of Analysis and Information, Volume VI, Issue 16, August 2, 2006, published by the Jamestown Foundation, pages 6 and 7. In addition, Selig S. Harrison, in “Quiet Struggle in the East China Sea”, (Current History, September 2002, page 271) identifies several other oil exploration arrangements made between the NP and mostly small western companies before 2000.
[40] Selig S. Harrison (2005), Seabed Petroleum in Northeast Asia: Conflict or Cooperation? Published by the Woodrow Wilson International Center for Scholars, Washington, D.C.. Available as http://www.wilsoncenter.org/topics/pubs/Asia_petroleum.pdf.
[41] “Oil & Gas Reserves Found in DPRK”, from a Korean-oriented website based in Japan, and dated 2002, http://www1.korea-np.co.jp/pk/185th_issue/2002103105.htm. A very similar (likely derivative) article appears at http://www.gasandoil.com/goc/discover/dix24872.htm.
[42] The Korea Herald, “New gas reserves found in East Sea”, dated March 4, 2005, by Kim Min-hee Available as http://www.nautilus.org/aesnet/2005/MAR0905/Korea_Herald_NewGAS.pdf.
[43] Note that the shaded row and column in this table are calculated based on data in the original source table (Table 3.1 in the report DPR KOREA: STATE OF THE ENVIRONMENT 2003, published by the United Nations Environment Programme, and available as http://www.rrcap.unep.org/reports/soe/dprksoe.cfm). The year to which the data in the table correspond is not explicitly described in the source document, but the total forest value is the same as provided in the UN FAO Forest Resource Assessment for 1990. Text in the source document indicates that the units for wood stocks shown in Table 2-6 may in fact be incorrect—it is possible that the units should be cubic meters of wood per hectare, not tonnes per hectare.
[44] Table and map from presentation entitled “Forest and Other Biomass Production in the DPRK: Current Situation and Recent Trends as Indicated by Remote Sensing Data – Status of Forest Resources, Degradation & Biomass in North Korea using Remote Sensing Data” by Professor Lee Seung-ho of the Remote Sensing Laboratory, Korea Forest Research Institute, as prepared for the DPRK Energy Experts Working Group Meeting, June 26th and 27th, 2006, Palo Alto, CA, USA). Professor Lee’s paper is available as http://nautilus.wpengine.netdna-cdn.com/wp-content/uploads/2011/12/Lee.ppt.
[45] The Forestry Department of the Food and Agriculture Organization (FAO) of the United Nations, in its Global Forest Resources Assessment 2010, Country Report, The Democratic People’s Republic of Korea, dated 2010, and available as http://www.fao.org/docrep/013/al489E/al489e.pdf, presents a variety of data on the NP forest sector, but little of the information appears to have been updated since the 1990s. FAO does present, based on extrapolation of forest trends in the 1990s, an estimate of forest area in 2010 that is nearly the same (5.657 million ha) as our estimate for that year (which was also prepared largely by extrapolation).
[46] Randall Ireson, Food Security in North Korea: Designing Realistic Possibilities, dated February 2006, published by the Walter H. Shorenstein Asia-Pacific Research Center. Freeman Spogli Institute for International Studies, Stanford University, and available as http://iis-db.stanford.edu/pubs/21046/Ireson_FoodSecurity_2006.pdf.
[47] See Figure 1 in UN FAO, Special Report, FAO/WFP Crop and Food Security Assessment Mission to the Democratic People’s Republic of Korea, dated 16 November 2010, and available as http://www.fao.org/docrep/013/al968e/al968e00.htm.
[48] Manure from goals and sheep, which are typically difficult to collect, are not included in this estimate. Animal population estimates are from UN Food and Agriculture Organization FAOSTAT, available as http://faostat.fao.org/site/568/default.aspx. Estimates of manure production per animal are derived from data in Rural Energy Production: Biogas Plant, a Sustainable Source of Energy for Cooperative Farms, by Arthur Wellinger, dated December 12, 2003, and published by ADRA (Adventist Development and Relief Agency International) and Nova Energie. This report provides case studies of the application of manure-fed biogas digesters in the NP.
[49] Yonhap news article from included in a 2011-4-20 post on North Korea Economy Watch, “Agricultural Statistics” archive, available as http://www.nkeconwatch.com/category/statistics/agriculture-statistics/.
[50] NP Delegation, “THE POTENTIAL IMPACT OF THE INTER-STATE ELECTRIC TIES IN NORTH EAST ASIA ON ENVIRONMENT,” September 31, 2003. Paper presented at Nautilus Institute’s 3rd Workshop on Grid Interconnections, held in Vladivostok, Russia, September 30 to October 3, 2003. Available as http://www.nautilus.org/archives/energy/grid/2003Workshop/K_DPRK_2_PPR.pdf.
[51] That is, the total shown is the equivalent of 9200 MW of power supplied continuously, year-round. Given that the average capacity factors of NP hydroelectric facilities may be 50 percent or less, this implies a total potential “nameplate” hydroelectric potential on the order of 18,000 MW, though not nearly all of this potential can be taken advantage of in practice.
[52] Friedrich Naumann Foundation (2011), “Geothermal Energy – Energy Source for the DPR Korea?”, available as http://www.fnfkorea.org/en/news/geothermal-energy-energy-source-for-the-dpr-korea, and “North Korea: Hope for Economic Revival” (undated, but apparently 2011 or 2012), available as http://www.fnfasia.org/index.php?option=com_content&view=article&id=1527%3Anorth-korea-hope-for-economic-revival&catid=3%3Alatest-news&Itemid=36.
[53] People’s Daily Online (2011), “China, DPRK to boost renewable energy cooperation”, available as http://english.peopledaily.com.cn/90001/90776/90883/7433273.html. In this article, “Thae Jong Su, alternate member of the Political Bureau of the Korean Workers Party (KWP) and member of the Secretariat from the Democratic People’s Republic of Korea” is quoted as saying “[t]he DPRK hopes to use geothermal energy in its efforts to develop its economy and build a strong and prosperous country”.
[54] Youtube, “North Korean military (KPA) installing wind power turbines“, at coordinates 37.945745°, 125.411339°. Available at http://www.youtube.com/watch?v=JYG_SOHZ_fA. Turbine size is our rough estimate based on measurements made from Google Earth satellite imagery.
[55] Figure 2-11 is Excerpt from the “Global Windspeed at 80 m” map by the company 3TIER, available as http://www.3tier.com/static/ttcms/us/images/support/maps/3tier_5km_global_wind_speed.pdf. The map is based on a combination of satellite data and the results of “mesoscale numerical weather prediction (NWP) atmospheric simulations” done by the company.
[56] See, for example, http://howto.altenergystore.com/Reference-Materials/Solar-Insolation-Data-USA-Cities/a35/.
[57] Marina Trigubenko (1991), “Industry of the DPRK”. Paper presented at Korea Development Institute Symposium, Seoul, ROK (October, 1991).
[58] The authors visited this installation on their 1998 visit to the NP. We do not know its current status.
[59] See, for example, K.Steiner-Dicks, Tidal: Asia’s Cinderella renewable energy”, Tidal Today, dated July 5, 2011, and available as http://social.tidaltoday.com/technology-engineering/tidal-asia%E2%80%99s-cinderella-renewable-energy; and Renewable Energy World.com, “China Endorses 300 MW Ocean Energy Project”, dated November 2, 2004, and available as http://www.renewableenergyworld.com/rea/news/article/2004/11/china-endorses-300-mw-ocean-energy-project-17685.
[60] Photo taken by D. von Hippel at the West Sea Barrage Visitors’ Center, near Nampo, NP, in October 1998.
[61] Larry A. Niksch, United States Congressional Research Service (CRS), CRS Issue Brief for Congress: North Korea’s Nuclear Weapons Program, updated January 17, 2006. The same figure is also quoted in Yo-Taik Song, “IN OUR TIMES SERIES, PART 6, The North Korean Nuclear Program: Technical and Policy Issues”, available as http://www.phy.duke.edu/~myhan/ot6-song.html.
[62] The DPRK has been highly reluctant to reveal the extent of its deposits of Uranium ore and its annual production capacity to the outside world. This same estimate of reserves (26 million tonnes of ore), however, was provided in information from private sources in China and DPRK business contacts compiled by E.Yoon (see, for example, [INSERT REFERENCE].
[63] North Korean Hullabaloo”, by Paul Vos Benkowski, 6 – Nukewatch Pathfinder, Winter, 2006-2007, page 6.
[64] Monazite is a name for a group of rare earth phosphate minerals, the most common form of which (Monazite-(Ce)) contains Cerium, Lanthanum, Thorium, Neodymium, and Yttrium. Monazite is radioactive, and it seems likely to have been exported in this instance primarily as a source of Thorium, though that is just the authors’ conjecture. A description of Monazite can be found at Amethyst Galleries “THE MINERAL MONAZITE”, http://www.galleries.com/minerals/phosphat/monazite/monazite.htm.
[65] “North Korea Profile, Nuclear Exports”, prepared for the Nuclear Threat Initiative by the by the Center for Nonproliferation Studies at the Monterey Institute of International Studies, 2003, available as http://www.nti.org/e_research/profiles/NK/Nuclear/47_1273.html.
[66] Choi Su Young (1993), Study of the Present State of Energy Supply in North Korea, Research Institute for National Unification (RINU), Seoul, (ROK).
[67] ROK Ministry of Unification (1996), “Electric Generation Capacity and Actual Generation”. Obtained from World-wide web site http://www/unikorea.go.kr/eng/ja/table/enk21.htm in the 1990s (but URL is no longer operative).
[68] Moiseyev, V. (1996), The Electric Energy Sector of the DPRK. Paper presented at the workshop on “Security on the Korean Peninsula,” November 21, 1996, Diplomatic Academy, Moscow, sponsored by the Center for Nonproliferation Studies at the Monterey Institute of International Studies (with funding from the Rockerfeller Foundation).
[69] A. Karabanov (1993); personal communication.
[70] Confidential document in authors’ files.
[71] Confidential document in authors’ files.
[72] Other reports indicate that total electricity losses in the NP were on the order of 25 percent of generation in 1990, but the 25 percent figure includes routine and emergency station losses and “own use” as well as T&D losses. Our estimate of 16 percent T&D losses, coupled with our estimates of own use and emergency station losses, yield an overall loss rate that is also in the 25 percent range.
[73] A document in the authors’ files, citing a NP source [NKES-01], indicates that the Pyongyang power plant has two district heating boilers rated (each, we presume) at 210 tonnes of steam/hr, or 100 Gcal/hr. Based on a very rough calculation, two boilers of this size could supply space heat and hot water for tens of thousands of households (perhaps 50,000 to 100,000).
[74] Choi (1993), for example, cites a total capacity for coal-fired generating stations of 2,850 MW in 1991, while the United Nations lists 4,500 MW of thermal capacity for 1989 through 1992. Other documents in our files list a total of 2,900 MW of capacity as of 1990 in the largest seven thermal plants alone, and still others list “official figures” of up 6,000 MW of thermal capacity in 1990. We have adopted the United Nations figure as our estimate for 1990.
[75] It has been reported that a large number of the smaller power plants reportedly included in official estimates of overall generation capacity were essentially built as “shams” to satisfy authorities, and are actually never been capable of generating power.
[76] Please see von Hippel and Hayes, 2012, for a listing of the sources used in developing this table.
[77] This value is substantially lower than an official (we assume) figure of 35 percent quoted in UNDP (1994) (Studies in Support of Tumen River Area Development Programme, as prepared by KIEP, Seoul, ROK for the UNDP, July, 1994). An efficiency of 35 percent seems too high oil-fired generation in the DPRK, given reports about the condition of the oil-fired plant at Sonbong. The 29.5 percent efficiency we have used is consistent with information we have received about the Sonbong plant’s recent operations.
[78] Sinton, J., editor (1996), China Energy Databook 1996 Edition, Revised January 1996. Lawrence Berkeley National Laboratory, University of California, Berkeley, California, USA. LBL-32822.Rev.3. UC-900.
[79] It should be remembered that most of the thermal power plants in the NP were built with assistance from the USSR—the example of efficiencies in Chinese plants is used here only as a benchmark.
[80] UNDP (1994), Studies in Support of Tumen River Area Development Programme. Prepared by KIEP, Seoul, ROK for the UNDP, July, 1994.
[81] Confidential document in authors’ files.
[82] Oxford Recycling Inc. (http://www.oxfordrecycling.com/product.html#5, visited 6/8/02) lists a sulfur content of 1.3 percent for fuel from shredded tires.
[83] Observers suggest that the coal mine feeding the Pukchang power plant was working at less than full capacity (as of several years ago), as the use of largely older, manual tools limited output despite the mine being in operation around the clock. The mine provides coal to other NP counties and provinces. Observers report that the Pukchang power plant itself appeared to be operating at near-full capacity during approximately 2005, with most or all boilers in use most of the time.
[84] J.Y. Yoon , “Analysis of Present Status and Future Supply /Demand Prospects for the DPRK Power System”, presented at the DPRK Energy Experts Working Group Meeting, June 26th and 27th, 2006, Palo Alto, CA, USA). Available as http://nautilus.wpengine.netdna-cdn.com/wp-content/uploads/2012/01/Yoon.ppt.
[85] For 2009, we assume that there was a decrease in overall gross generation approximately equal to that estimated by J.Y. Yoon in his presentation for the 2010 Energy and Minerals Experts Working Group Meeting in Beijing, September 2010 (available as https://nautilus.org/wp-content/uploads/2011/12/01.-Yoon.ppt, and in narrative form at https://nautilus.org/napsnet/napsnet-special-reports/the-dprk-power-sector-data-and-interconnection-options/), “Analysis on DPRK Power Industry & Interconnection Options”. In the presentation, Yoon quotes ROK analysts as estimating that the NP’s generation in 2008 was 25.5 TWh, and generation in 2009 was 23.5 TWh. We do not use these absolute generation estimates, because we believe that they are too high (Mr. Yoon agreed that a “minimum” value could be closer to 16 TWh for 2007, for which ROK analysts estimate output of 23.7 TWh), but we use the ratio of these 2009 and 2008 estimates, 92.2%, to estimate a target value for 2009 output. As another point of comparison, a recent article by the Yonhap News Agency (“N. Korea’s power consumption per capita at 1970s levels”, dated 8/6/2010, and available as http://english.yonhapnews.co.kr/news/2012/08/06/0200000000AEN20120806003300315.HTML?source=rss), quoting the ROK’s Statistics Korea, describes per-capita consumption in the NP of 819 kWh per capita, which would, based on the population assumptions used in this report, equate to about 19.7 TWh of overall consumption. Whether the quoted figure is intended to be actual end-use consumption, or simply overall estimated electricity production divided by population, is unclear, as is the ultimate source used by Statistics Korea to prepare the estimate.
[86] In 2005, the first year in which we separately account for fuel used by diesel generators (in previous years, some oil accounted in the energy balances presented in Chapter 3 as used in specific sectors was undoubtedly used in generators), we have assumed that the total capacity of diesel generators in the NP was about 100 MW, which would include both generators officially recorded as imported from China and some stock of existing generators and/or generators imported from elsewhere. Note, however, that UN Comtrade statistics on imports of generators to the NP from countries other than China indicate very few such trades, which is not surprising.
[87] Please see the volume of detailed calculations provided as an Attachment to von Hippel and Hayes, 2009, for a listing of the sources used in developing this table.
[88] As an example of the potential of the combined impoundment/run-of-river design to produce power consistently, Prof. Y.S. Jang (personal communication, 1996) reports that the capacity factor of hydroelectric plants in North Korea was over 70 percent during 1943.
[89] Several sources that have been to the NP recently said they had no knowledge of major damage to large hydroelectric facilities. Another source had heard of damage to “one or two” “small to medium-sized” (less than 10 MW) plants.
[90] KEEI (Korean Energy Economics Institute, 1996; personal communication from Mr. Roh Dongseok, Electricity Policy Division) cites an 800 MW increase in capacity from the newly-opened Kumgang Mountain plant. Earlier ROK estimates had also placed the (expected) capacity of this plant at 800 MW, although its current capacity under the phases now completed and/or taking into account existing reservoir levels is probably in the range of 100 – 150 hundred megawatts. The Kumgang mountain plant was also referred to in announcements in the DPRK press, but without reference to plant capacity.
[91] Confidential document in authors’ files.
[92] Note that the actual conversion efficiency of energy in falling water to electricity in hydro plants is typically less than 100%, on the order of 70 to 90 percent.
[93] Kim, E.-W., H. Kim, H.-K. Lim, C. Nahm, M.-C. Shin, and Y. Kim (1983), The Electric Future of Korea. Resource Systems Institute, Honolulu, Hawaii, USA. Research Materials RM-83-8.
[94] See table in J.Y. Yoon , “Analysis of Present Status and Future Supply /Demand Prospects for the DPRK Power System”, presented at the DPRK Energy Experts Working Group Meeting, June 26th and 27th, 2006, Palo Alto, CA, USA). Available as http://nautilus.wpengine.netdna-cdn.com/wp-content/uploads/2012/01/Yoon.ppt.
[95] Choi Song Min (2012), “Iconic Pyongyang Power Plant Could Go”, DailyNK, dated 2012-05-08, available as http://www.dailynk.com/english/read.php?cataId=nk01500&num=9207.
[96] Apparently the shared hydro facilities on the Tumen and Yalu rivers have turbine sets dedicated to and operated by the NP, and turbine sets dedicated to and operated by China. The two sets of turbines are operated at different frequencies. The water resource appears, however, to be jointly managed, so that the two sets of turbines operate with the same capacity factor.
[97] See, for example, Alexandre Mansourov (2013), “Fear Prevails Over Greed: The Kaesong Shutdown” (available as http://38north.org/2013/05/amansourov052113/), and Curtis Melvin (2013), “Whither the Kaesong Industrial Complex?” (available as http://38north.org/2013/05/cmelvin052113/), both in 38 North, and both dated, 21 May 2013.
[98] Moiseyev, V. (1996), The Electric Energy Sector of the DPRK Paper presented at the workshop on “Security on the Korean Peninsula,” November 21, 1996, Diplomatic Academy, Moscow, sponsored by the Center for Nonproliferation Studies at the Monterey Institute of International Studies (with funding from the Rockefeller Foundation).
[99] Kilometers of line here probably refers to conductor-kilometers.
[100] More recent estimates provided by experts suggest that there may be somewhat under 80 transmission substations in the NP designed to operate with nominally 220 kV inputs, with perhaps another 200 transmission substations operating at the 66 kV/11 kV levels, 2500 11 kV distribution substations, and about 15,000 transformers to distribute power to consumers.
[101] Capacity is supplied in units of million volt-amps (MVA).
[102] The historically poor control of frequency, and frequent loss of power, on the NP grid has reportedly figured in determining the efficiency of industrial equipment in an interesting way. In order to make sure that the USSR-built industrial equipment installed in the DPRK would hold up under the prevailing conditions of poor power quality, Soviet engineers typically augmented (usually older) USSR designs to make the DPRK plants extra-rugged. These more rugged plants were thus probably more electricity-intensive, on the whole, than typical Soviet plants of the same types and vintages.
[103] Our own power measurements in the DPRK in 1998 and 2000, in fact, showed a much wider range of frequency variation—with frequencies dropping at times to the 45 Hz range.
[104] The fact that the power grids in the Koreas operate at a different frequency than most of the rest of continental Asia (and virtually all of Europe) is probably a legacy of the Japanese colonial period (and possibly of US influence in the ROK). Japan uses both 50- and 60-cycle grids (“Listing of Countries with their Frequency and Voltage”, provided on ZZZAP Power World-wide Web site http://azap.com/countries.html).
[105] Order-of-magnitude cost estimate obtained in conversation (1997) with G. Jutte of Siemens Power Transmission and Distribution, Limited. Indications at that time were that per-unit costs for these systems were declining. There are a number of technical issues that will have to be considered when and if AC-DC-AC converters are to be used in Korea, including the line voltage on the NP side, the distance over which the power must be transferred, and many others. The AC-DC-AC systems could also be used to inter-convert 50 Hz and 60 Hz power at the borders of the NP with China and Russia, suggesting that the $460 million interconnection cost listed above may be somewhat high (or may include different/additional hardware).
[106] United Nations estimate, as cited in Jang, Young Sik (1994), North Korean Energy Economics. Korea Development Institute.
[107] It is not clear whether these figures are given per tonne of crude oil input or per tonne of product output, though the difference between the two measures is unlikely to be more than 10 percent.
[108] International Petroleum Encyclopedia, 1996. Tulsa, Oklahoma Petroleum Publishing Company, Tulsa, OK. Other sources (document in the authors’ files [OS-2-27-2012, page 45]) suggest that the current capacity of this refinery is 2.5 million tonnes/year.
[109] Fridley, D. (1996), Lawrence Berkeley National Laboratory (personal communication).
[110] Fridley, D. (1996), Lawrence Berkeley National Laboratory (personal communication).
[111] Some information about this refinery, and plans for its expansion, was at one time available on the UNIDO (UN Industrial Development Organization) World-wide Web site at http://www.unido.org, though it is unclear if that information remains available.
[112] International Petroleum Encyclopedia, 1996. Tulsa, Oklahoma Petroleum Publishing Company, Tulsa, OK.
[113] Web page http://www1.korea-np.co.jp/pk/095th_issue/99051905.htm, dated 1999, by “The People’s Korea”, and titled “Rajin-Sonbong Region”.
[114] Confidential document in authors’ files.
[115] Shen, W.B. (1988), “Progress of Energy Saving in China’s Petrochemical Industry”. In Meyers, S. (Ed.), Proceedings of the Chinese – American Symposium on Energy Markets and the Future of Energy Demand, Nanjing, China June 22-24, 1988. Lawrence Berkeley Laboratory, Berkeley, California, USA.
[116] This information is largely taken from the report by Edward Yoon (2012) commissioned by Nautilus, Status and Future of the DPRK’s Minerals Sector, which has not yet been published, but an earlier version of which can be found as http://nautilus.wpengine.netdna-cdn.com/wp-content/uploads/2011/12/DPRK-Minerals-Sector-YOON.pdf.
[117] Hackett, James, editor (2010), The Military Balance, 2010, Routledge, pages 411-413
[118] Peter Hayes and David von Hippel (2011) “North Korea’s ‘Collapse’ Pathways and the Role of the Energy Sector”, Chapter 8 in The Survival of North Korea: Essays on Strategy, Economics and International Relations, Edited by Suk Hi Kim, Bernard Selinger, and Terence Roehrig, McFarland & Company, Inc.
IV. NAUTILUS INVITES YOUR RESPONSES
The Nautilus Peace and Security Network invites your responses to this report. Please leave a comment below or send your response to: nautilus@nautilus.org. Comments will only be posted if they include the author’s name and affiliation.